


Abstract
We conducted a reanalysis of genome-wide histone H3 tail methylation data in mammalian pluripotent and differentiated cells. We show that the promoters marked with histone H3 lysine 27 trimethylation (H3K27me3) tend to have more exonic positions in the promoter regions. However, this is not due to any preferential marking on exons over introns by H3K27me3. The relationship is also independent the status of histone H3 lysine 4 trimethylation (H3K4me3) mark, CpG content and the platforms used in the high-throughput profiling of histone modifications. It provides evidence for the link between histone modifications and transcribed exons in promoter regions.
Contact: liang.chen@usc.edu
Supplementary information: Supplementary data are available at Bioinformatics online.
1 INTRODUCTION
Histone modification is closely related to cellular states and gene regulation. Chromatin immunoprecipitation (ChIP) combined with chip or sequencing technologies has been a powerful tool to map the genome-wide distribution of histone modifications. The high-resolution maps of several key histone modifications have been obtained for the embryonic stem (ES) cells and the differentiated cell lineages (Barski et al., 2007; Guenther et al., 2007; Mikkelsen et al., 2007; Pan et al., 2007; Zhao et al., 2007). Among the modifications on histone tails, histone H3 lysine 4 and lysine 27 methylation are of particular interest. Genes with the promoters marked by histone H3 lysine 4 trimethylation (H3K4me3) but not histone H3 lysine 27 trimethylation (H3K27me3) are actively expressed. Genes with the promoters marked by both H3K4me3 and H3K27me3 (termed ‘bivalent domains’) are poised for expression, and those with only H3K27me3 marks are stably repressed (reviewed in Bibikova et al., 2008). These modifications are catalyzed by trithorax- and Polycomb-group proteins, respectively. The proteins mediate the epigenetic inheritance of lineage-specific gene expression patterns and have important function in development (Ringrose and Paro, 2004). All of these reflect the central role of H3K4me3 and H3K27me3 in the maintenance of pluripotent state and the lineage potential.
Another histone modification H3K36me3 has been reported to be associated with transcriptional elongation (Bibikova et al., 2008). More recent studies show that exons are preferentially marked with H3K36me3 relative to introns, which indicates a dynamic link between transcription and splicing (Kolasinska-Zwierz et al., 2009). Intragenic histone hyper-acetylation affects nearby alternative splicing, which further indicates the coupling of transcription and splicing through histone modifications (Schor et al., 2009). In addition, it has been reported that RNA-directed transcriptional gene silencing (TGS) can be initiated through promoter-targeted siRNAs and the targeted promoters are marked with silent histone H3K9me2 and H3K27me3 (Han et al., 2007; Morris et al., 2004). During TGS, low-copy of promoter-associated RNAs are transcribed (e.g. RNAs transcribed from upstream promoter in close proximity) and recognized by the antisense strand of the siRNA to mediate TGS (Han et al., 2007). These results indicate that transcribed RNAs are closely related to histone modifications. Here, we explore the relationship between H3K27me3 modification and the RNA transcribed from the same promoter. Specifically, we found that the promoters marked by H3K27me3 tend to have more exonic positions in the promoter regions, which further indicates the potential relationship between histone modifications and transcribed RNAs.
2 METHODS
We assembled 19 824 promoters (between −0.5 and +2 kb of the annotated transcript start site) from the mouse Refseq transcripts (downloaded from the UCSC genome browser, version mm9) and 20 181 promoters from the human Refseq transcripts (version hg18). Here, the transcript start site means the first base of annotated transcript. Note that if a gene had alternative promoters, these different promoters were analyzed separately. The (−0.5 and +2 kb) region was commonly used as the promoter region in histone modification studies (e.g. Ku et al., 2008; Mikkelsen et al., 2007). We call these promoter sets the ‘full’ promoter sets. The annotated transcript start site may be inaccurate and the identification of transcription start sites is still a challenging subject. To achieve a better-defined promoter set, we focused on the transcripts with validated transcription start sites. In particular, we selected the transcripts with at least one full-length cDNA starting from a position within 10 bp of the annotated transcript start site. The position was treated as the start site of the first exon (i.e. the transcript start site). If a transcript had more than one such position, the position supported by the most number of full-length cDNAs was selected. The full-length cDNA information was from the DBTSS database (Wakaguri et al., 2008). A total of 4968 mouse promoters and 3694 human promoters were identified according to the criteria. We call these promoter sets the ‘conservative’ promoter sets.
If a promoter overlaps with a genomic interval enriched with a specific chromatin modification, the promoter is said to be marked by that chromatin modification. The histone modification data were from Mikkelsen et al. (2007) and Meissner et al. (2008) including the ChIP-seq data for mouse ES cells, neural progenitor (NP) cells, embryonic fibroblasts (MEF) and brain; the ChIP-seq (Ku et al., 2008) and ChIP-chip (Pan et al., 2007) data for human ES cells. The genomic intervals enriched with a histone modification, which were inferred based on sliding window approach or hidden Markov model approach, were obtained from the original papers. For the ‘full’ promoter sets, we removed 2138 mouse promoters and 1235 human promoters that correspond to transcripts with length <2 kb. Most of them are olfactory receptors with single coding-exon. And majority of them were not marked with either H3K27me3 or H3K4me3. For the ‘conservative’ promoter sets, we removed 260 mouse promoters and 116 human promoters that correspond to transcripts with length <2 kb. Therefore, we finally had 17 686 mouse promoters and 18 946 human promoters for the ‘full’ promoter sets, and 4708 mouse promoter and 3578 human promoters for the ‘conservative’ promoter sets.
A gene may have multiple promoters, then these promoters were analyzed separately and independently. The sequence properties (e.g. exon length) of a promoter were calculated based on the isoform starting from the promoter. Other isoforms starting from different promoters did not interfere with the calculation. In the ‘full’ promoter sets, there were 767 (5%) mouse genes and 1587 (9%) human genes with more than one promoter. In the ‘conservative’ promoter sets, there were 23 (0.5%) mouse genes and 29 (0.8%) human genes with more than one promoter. In addition, a promoter may correspond to multiple transcript isoforms. Those isoforms shared the same promoter and had different downstream splicing events. For the final ‘full’ promoter sets, ∼6% of the mouse promoters and 17% of the human promoters were shared by more than one transcript isoform. For the final ‘conservative’ promoter sets, the percentage was 3 and 12% for the mouse and human promoters, respectively. For the promoters corresponding to one transcript isoform, the exonic and intronic positions were counted directly. For the promoters shared by multiple isoforms, the positions appearing in all of the transcript isoforms were counted as exonic positions. The positions spliced out from all of the isoforms were counted as intronic positions. The other positions were alternative positions. Only 1% of the mouse and 4% of the human ‘full’ promoters had alternative positions in the promoter region. For majority of the promoters shared by multiple isoforms, the transcript isoforms had alternative splicing events >2 kb downstream of the transcript start site (with no alternative positions in the promoter region). These alternative splicing events did not interfere with the calculation of the promoter sequence properties.
The number of exonic positions (excluding alternative positions) on the pre-mRNA level overlapping the promoter was counted and we call it ‘pExon-length’. We also calculated the length of the 5′ UTR region overlapping with the promoter (‘p5′ UTR-length’), the length of the first exon (‘1st Exon-length’), the length of other exonic region (except the first exon) overlapping with the promoter (‘pOtherExon-length’), and the length of the transcript (‘Trs-length’). For promoters shared by multiple isoforms, the average lengths from the isoforms were used. Promoters containing a 500 bp interval within −0.5 to +2 kb with a (G+C) fraction ≥0.55 and a CpG observed to expected ratio (O/E)≥ 0.6 were classified as high CpG promoters (HCPs). Other promoters were classified as non-HCPs. All of the statistical tests were performed using software R.
3 RESULTS
We observed that the H3K27me3 enrichment was associated with the number of exonic positions in the promoter region (‘pExon-length’). Figure 1A plot the ‘pExon-length’ for the promoters marked with H3K27me3 and the promoters without H3K27me3 mark. The promoters were from the ‘full’ promoter sets. It clearly shows that the promoter marked with H3K27me3 tended to have more exonic positions (the P-values based on the Wilcoxon test <2.2 × 10⁻¹⁶). If a promoter was consistently marked with H3K27me3 across multiple tissue and cell lines, it tended to have more exonic positions (Fig. 1B). Among the 391 mouse promoters with the ‘pExon-length’ equal to 2 kb (i.e. the first exon is ≥2 kb), 48% of them were marked with H3K27me3 in at least one cell line or tissue. For the remaining promoters with the ‘pExon-length’ <2 kb, only 22% of them were marked with H3k27me3 in at least one cell line or tissue. The P-value based on the χ2-test is <2.2 × 10⁻¹⁶. This association was also observed in human ES cells for both ChIP-seq and ChIP-chip data (Fig. 1C). It shows that the association between ‘pExon-length’ and H3K27me3 is independent of the high-throughput platforms. Similarly, the χ2-test was performed to compare the proportion of the marked promoters among the promoters with the ‘pExon-length’ equal to 2 kb and the proportion among the promoters with the ‘pExon-length’ <2 kb. The P-value is 2.4 × 10⁻⁵ for the ChIP-seq data and 9.4 × 10⁻¹⁵ for the ChIP-chip data. For the ‘conservative’ promoter sets, the results were similar (Supplementary Fig. 1).
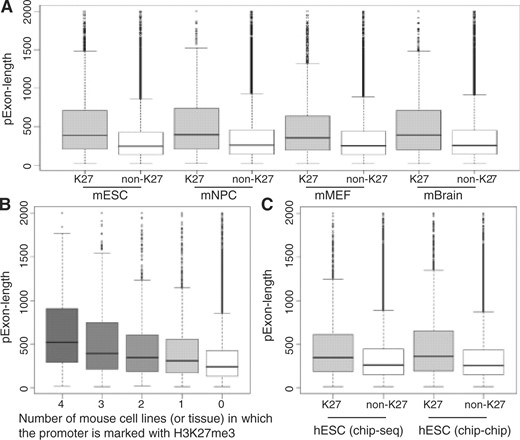
The ‘pExon-length’ of the promoters marked with H3K27me3 and the promoters without H3K27me3 mark. (A and B) are for mouse cell lines and tissue. (C) is for human ES cells and the histone modifications were profiled using ChIP-seq or ChIP-chip technologies. The ‘full’ promoter sets were used.
Table 1 lists the correlations between the histone modification signals and the ‘pExon-length’ and other parameters. The modification signal was the number of sequence reads mapped to the promoter for the ChIP-seq data or the average probe intensity in the promoter for the ChIP-chip data. The ‘pExon-length’ had a significant positive correlation with the H3K27me3 signal for all of the considered cell lines and for both the ‘full’ promoter sets and the ‘conservative’ promoter sets. However, the correlation between the ‘pExon-length’ and H3K4me3 was positive for some cell lines and negative for other cell lines, indicating inconsistent patterns between cell lines. The magnitude of the correlation was small and the P-value could be as high as 0.54 for the human ES cells. In addition, the H3K27me3 signal had a stronger association with the ‘pExon-length’ than with the 5′ UTR length in the promoter region (‘p5′ UTR-length’) and the length of the first exon (‘1st Exon-length’). The latter two were highly correlated with the ‘pExon-length’ (the correlations among these three parameters were about 0.46–0.78). If we removed the contribution from the first exon to the ‘pExon-length’ calculation, the ‘pOtherExon-length’ still had a significant positive correlation with the H3K27me3 signal (all P-values were <0.05). It indicates that the first exon length is probably the most important but not the only reason for the correlation between the ‘pExon-length’ and the H3K27me3 signal. In addition, we considered the whole transcript length (‘Trs-length’). The correlations between the H3K27me3 signal and the ‘Trs-length’ were small and were not consistent between the high-throughput platforms, and some of the P-values were >0.05.
Correlations between the histone modification signals and the ‘pExon-length’, ‘p5′ UTR-length’, ‘1st Exon-length’, ‘pOtherExon-length’ and ‘Trs-length’
| Cell line | ‘pExon-length’ and K27 | ‘pExon-length’ and K4 | ‘p5′ UTR-length’ and K27 | ‘1st Exon-length’ and K27 | ‘pOtherExon-length’ and K27 | ‘Trs-length’ and K27 | |
|---|---|---|---|---|---|---|---|
| ‘Full’ promoter sets | mESC | 0.27 | 0.025 | 0.18 | 0.24 | 0.046 | 0.097 |
| (<2.2 × 10⁻¹⁶) | (0.00080) | (<2.2 × 10⁻¹⁶) | (<2.2 × 10⁻¹⁶) | (1.1 × 10⁻⁹) | (<2.2 × 10⁻¹⁶) | ||
| mNPC | 0.10 | −0.039 | 0.08 | 0.074 | 0.021 | 0.043 | |
| (<2.2 × 10⁻¹⁶) | (2.0 × 10⁻⁷) | (<2.2 × 10⁻¹⁶) | (<2.2 × 10⁻¹⁶) | (0.0044) | (8.7 × 10⁻⁹) | ||
| mMEF | 0.18 | −0.027 | 0.13 | 0.15 | 0.029 | 0.070 | |
| (<2.2 × 10⁻¹⁶) | (0.00032) | (<2.2 × 10⁻¹⁶) | (<2.2 × 10⁻¹⁶) | (0.00010) | (<2.2 × 10⁻¹⁶) | ||
| mBrain | 0.13 | −0.052 | 0.082 | 0.090 | 0.041 | −0.0040 | |
| (<2.2 × 10⁻¹⁶) | (2.9 × 10⁻¹²) | (<2.2 × 10⁻¹⁶) | (<2.2 × 10⁻¹⁶) | (6.6 × 10⁻⁸) | (0.60) | ||
| hESC (ChIP-seq) | 0.12 | −0.041 | 0.079 | 0.079 | 0.038 | 0.012 | |
| (<2.2 × 10⁻¹⁶) | (2.1 × 10⁻⁸) | (<2.2 × 10⁻¹⁶) | (<2.2 × 10⁻¹⁶) | (2.4 × 10⁻⁷) | (0.099) | ||
| hESC (ChIP-chip) | 0.14 | −0.0074 | 0.054 | 0.098 | 0.034 | 0.040 | |
| (<2.2 × 10⁻¹⁶) | (0.31) | (8.2 × 10⁻¹⁴) | (<2.2 × 10⁻¹⁶) | (2.6 × 10⁻⁶) | (5.2 × 10⁻⁸) | ||
| ‘Conserved’ promoter sets | mESC | 0.27 | 0.019 | 0.21 | 0.22 | 0.061 | 0.086 |
| (<2.2 × 10⁻¹⁶) | (0.19) | (<2.2 × 10⁻¹⁶) | (<2.2 × 10⁻¹⁶) | (2.6 × 10⁻⁵) | (4.1 × 10⁻⁹) | ||
| mNPC | 0.10 | −0.042 | 0.091 | 0.066 | 0.042 | 0.038 | |
| (3.8 × 10⁻¹²) | (0.0040) | (3.8 × 10⁻¹⁰) | (6.2 × 10⁻⁶) | (0.0039) | (0.0096) | ||
| mMEF | 0.18 | −0.042 | 0.15 | 0.15 | 0.041 | 0.061 | |
| (<2.2 × 10⁻¹⁶) | (0.0043) | (<2.2 × 10⁻¹⁶) | (<2.2 × 10⁻¹⁶) | (0.0052) | (3.2 × 10⁻⁵) | ||
| mBrain | 0.14 | −0.069 | 0.12 | 0.10 | 0.032 | 0.015 | |
| (<2.2 × 10⁻¹⁶) | (2.4 × 10⁻⁶) | (4.4 × 10⁻¹⁶) | (6.1 × 10⁻¹²) | (0.027) | (0.30) | ||
| hESC (ChIP-seq) | 0.15 | −0.010 | 0.14 | 0.12 | 0.036 | 0.018 | |
| (<2.2 × 10⁻¹⁶) | (0.54) | (2.2 × 10⁻¹⁶) | (4.7 × 10⁻¹³) | (0.032) | (0.28) | ||
| hESC (ChIP-chip) | 0.16 | 0.016 | 0.15 | 0.13 | 0.034 | 0.045 | |
| (<2.2 × 10⁻¹⁶) | (0.33) | (<2.2 × 10⁻¹⁶) | (6.7 × 10⁻¹⁵) | (0.040) | (0.0074) |
Histone modification signal was the number of sequence reads mapped to the promoter or the average probe intensity for the promoter. Pearson's correlation coefficients were calculated, between the number of exonic positions overlapping with the promoter region (‘pExon-length’) and the H3K27me3 signal; between the ‘pExon-length’ and the H3K4me3 signal; between the length 5′ UTR region overlapping with the promoter region (‘p5′ UTR-length’) and the H3K27me3 signal; between the length of the first exon (‘1st Exon-length’) and the H3K27me3 signal; between the length of other exonic region (except the first exon) overlapping with the promoter (‘pOtherExon-length’) and the H3K27me3 signal; and between the length of the whole transcript (‘Trs-length’) and the H3K27me3 signal.
To understand whether the association between H3K27me3 and the ‘pExon-length’ is a secondary effect of nucleosome occupancy, we studied the profile of non-modified histone positions. We investigated the relationship between nucleosome density and ‘pExon-length’. Mikkelsen et al. (2007) profiled the histone H3 positions in the mouse ES cells using the Pan-H3 antibodies. By analyzing the data, we found that the correlation between the histone H3-occupancy and the ‘pExon-length’ was −0.070 for the ‘full’ promoter set and −0.068 for the ‘conservative’ promoter set. When we normalized the H3K27me3 signal by the pan-H3 signal (the H3K27me3 reads mapped to the promoter/the pan-H3 reads mapped to the promoter), the correlation between the normalized H3K27me3 signal and the ‘pExon-length’ was 0.23 and 0.22 for the ‘full’ and ‘conservative’ promoter sets (the P-values for the correlations <2.2 × 10⁻¹⁶). The results indicate that the correlation between H3K27me3 and the ‘pExon-length’ is not due to the correlation between H3K27me3 and the nucleosome-occupancy. It may be noteworthy to mention that the nucleosome-occupancy level tends to be higher in internal exons than in introns (Andersson et al., 2009; Schwartz et al., 2009; Tilgner et al., 2009). Here, we focused on the promoter-region exons instead of the internal exons.
Promoters can be marked by both H3K4me3 and H3K27me3. The association between the ‘pExon-length’ and the H3K27me3 signal in the promoter region was, however, independent of the H3K4me3 status as shown in Figure 2A (the ‘full’ promoter set was used). When comparing the ‘pExon-length’ of H3K27me3+ and H3K4me3+ promoters, and the ‘pExon-length’ of H3K27me3+ and H3K4me3− promoters, the P-values based on the Wilcoxon tests were >0.05. CpG islands are important epigenetic and functional regulatory elements and it has been shown that the H3K27me3 signals are enriched in the promoter CpG islands (Mikkelsen et al., 2007; Roh et al., 2006). To study whether the association between the ‘pExon-length’ and the H3K27me3 signal is dependent on the CpG percentage, we divided our promoters into HCPs and non-HCPs. Figure 2B shows that the association was independent of the CpG percentage. If the HCPs or the non-HCPs were consistently marked with H3K27me3, they tended to have longer ‘pExon-length’. The results for the ‘conservative’ promoter set was similar (Supplementary Fig. 2). Besides the promoter CpG level, we also considered the GC content outside of the promoter regions. Specifically, we calculated the GC content in the downstream (2 and 20 kb) region of the transcript start site. The GC content in the large region contains information about the genomic compositional structures. We studied the correlation between the H3K27me3 signal in the upstream promoter region and the downstream GC content. Most of the correlations were between 0.13 and 0.17. However, the correlation for the human ChIP-seq data was as low as 0.008 for the ‘full’ promoter set and 0.010 for the ‘conservative’ promoter set (P-values were 0.26 and 0.57). The results indicate that the genomic compositional structures may be related to H3K27me3 modification, but the association was not significant for the human ChIP-seq data.
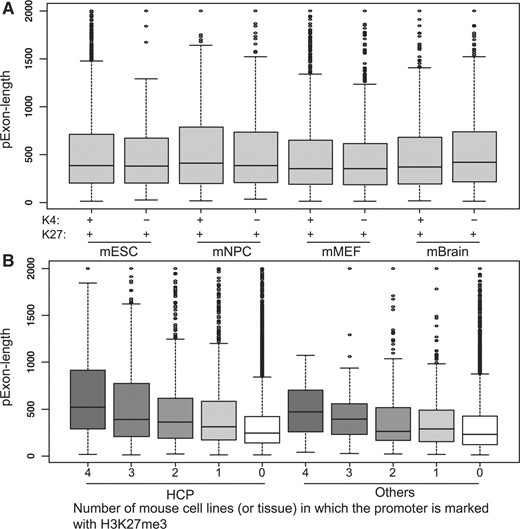
The association between the ‘pExon-length’ and H3K27me3 is independent of H3K4me3 (A) and CpG content (B). The ‘full’ promoter set was used.
One possible explanation for such an association is that the H3K27m3 signal is higher in exonic regions than in intronic regions. Thus, we investigated whether the H3K27me3 signal was different between the intronic regions and the exonic regions of promoters. For the promoters marked with the H3K27me3 modification, the sequence read coverage at the exonic positions of the promoter was compared with the sequence read coverage at the intronic positions of the promoter. There was no significant difference of the H3K27me3 signal between exonic positions and intronic positions of promoters (the P-values based on the paired Wilcoxon tests are >0.05 for both the ‘full’ and ‘conservative’ promoter sets). When the H3K27me3 signal was high at the exonic positions of a promoter, the signal at the intronic positions of this promoter was also high (see Fig. 3 for the ‘full’ promoter set and Supplementary Fig. 3 for the ‘conservative’ promoter set). The results indicate that the exon length of the promoter region is involved in the H3K27me3 modification, but this modification on the histone does not distinguish exonic and intronic positions.
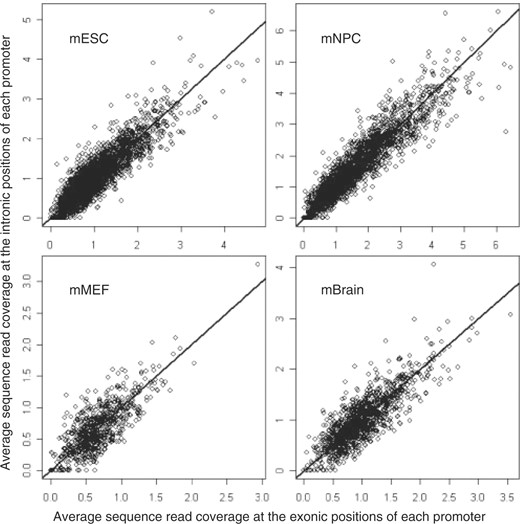
H3K27me3 signal at exonic positions versus H3k27me3 signal at intronic positions. For each promoter marked with H3K27me3 modification, we calculated the sequence read coverage for each exonic and intronic position. The sequence reads were based on the ChIP-seq data for H3K27me3 modification in the mouse ES cells, NP cells, MEF cells and brain tissue. Then the average read coverage for the exonic positions and the average read coverage for the intronic positions were calculated, respectively, for every promoter marked with H3K27me3 and shown in the figure. The straight line is y=x. The ‘full’ promoter set was used.
Genes with multiple alternative promoters may have distinct chromatin status (Mikkelsen et al., 2007). We suspected that alternative promoters distinctly marked by H3K27me3 might have different ‘pExon-lengths’. In our study, there were 767 mouse genes and 1587 human genes with more than one promoter from the ‘full’ promoter sets. These genes had a total of 1631 and 3549 alternative promoters for mouse and human, respectively. The alternative promoters marked with H3K27me3 tended to have longer ‘pExon-length’ than the alternative promoters unmarked with H3K27me3 (the P-values based on the one-sided Wilcoxon tests to compare the two groups were all <2.6 × 10⁻⁵ for mouse and human). Pair-wise comparison was also conducted. We selected the pairs of alternative promoters that belong to the same gene but with distinct H3K27me3 signals. For the mouse promoters, we pooled the sequence reads from three cell lines and brain tissue together. The read counts were multiplied by a constant to make the total reads equal to 10 million for each cell line and tissue (a total of 40 million reads for the pooled sample). For the human promoters, we also multiplied the read counts by a constant to make the total reads equal to 10 million. If a pair of mouse alternative promoters had a read-count difference ≥200, we called them having distinct H3K27me3 patterns. If a pair of human alternative promoters had a read-count difference ≥50, we called them having distinct H3K27me3 patterns. Then the ‘pExon-length’ of the promoter with higher H3K27me3 reads was compared with that of the promoter with lower H3K27me3 reads and belonging to the same gene. The P-value based on the paired one-sided Wilcoxon test was 0.001 and 0.03 for the mouse and human promoters, respectively. However, we should note that the alternative promoter information based on the Refseq annotation is far from complete.
We show several examples in which genes have alternative promoters and the ‘pExon-length’ and H3K27me3 signal were different for these alternative promoters in Figure 4. Specifically Figure 4A shows the H3K27me3 signal for Gnas transcript isoforms in mouse ES cells, NP cells, MEF cells and brain. The promoters with longer exonic regions were marked with H3K27me3 in all four conditions. However, the promoter with shorter exonic region was marked with H3K27me3 only in ESCs. Figure 4B shows the H3K27me3 signal for Runx1 transcript isoforms in mouse ES cells, NP cells, MEF cells and brain. The promoter with longer exonic region was marked with H3K27me3 in ES cells and brain. However, the promoter with shorter exonic region remained unmarked under these four conditions.
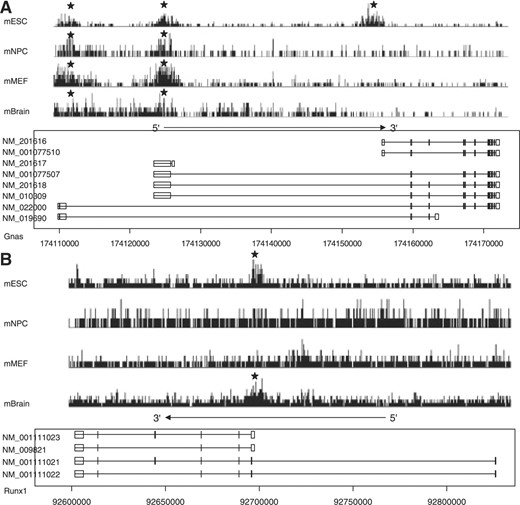
Examples of the alternative promoters having different exonic lengths and histone modification in promoters. The signal of H3K27me3 modification in four mouse cell lines or tissue was profiled. The stars indicate the promoters marked with H3K27me3.
4 DISCUSSION
Here, we analyzed the relationship between the exonic positions and the histone modifications in gene promoter regions. We found that although H3K27me3 marks do not distinguish exonic or intronic positions, the number of exonic positions is positively associated with the H3K27me3 signal. This association is independent of the H3K4me3 status, nucleosome occupancy, CpG content and high-throughput platforms.
Funding: National Institutes of Health (P50 HG 002790, partially).
Conflict of Interest: none declared.
REFERENCES
Author notes
Associate Editor: Dmitrij Frishman

