


Abstract
Prostaglandin F2alpha (PGF) causes luteolysis of the pig corpus luteum (CL) only after Day 12 of the estrous cycle. Recent evidence indicates that progesterone (P4) may protect the CL from cell death. The present study tested the hypothesis that acute inhibition of P4 by treatment with epostane (EPO; 3betaHSD inhibitor) in CL lacking luteolytic capacity (Day 9 CL) will allow PGF to induce responses associated with luteolysis. Multiple PGF-induced responses were evaluated, including genes involved in production of PGF and estradiol-17beta, apoptosis (caspase 3), and transcription (FOSB). These responses are associated with PGF-induced luteolysis and do not normally occur in CL lacking luteolytic capacity. Animals on Day 7 after estrus were divided into four groups: 1) control (C), 2) PGF, 3) EPO, and 4) PGF plus EPO (PGF+EPO). Treatment with EPO (10 mg/kg) or vehicle was given every 12 h for 36 h. Treatment with PGF (25 mg) or vehicle was given at 38 h, and CL were collected from all animals at 48 h. Some CL from each animal were frozen in liquid nitrogen for mRNA and protein analysis. Remaining CL were incubated in media for 2 h for determination of P4 and PGF production. EPO dramatically decreased production of P4 by luteal tissue (ng/mg tissue) by 90% and 95% in EPO and PGF+EPO groups, respectively, compared to C (P < 0.01). Low production of PGF by luteal tissue was found in C, PGF, and EPO groups; however, treatment with PGF+EPO dramatically increased (782%) luteal PGF production. Similar to intraluteal PGF production, increased mRNA for cyclooxygenase 2 (PTGS2) and phospholipase A2 (group IB; PLA2G1B) was found in the PGF+EPO, but not in the EPO or PGF, group. Aromatase (CYP19A1) mRNA was not induced by PGF or EPO; however, PGF+EPO caused a more than 40-fold increase in CYP19A1 mRNA (P < 0.01). CASP3 mRNA was increased (P < 0.01) by EPO (3.4-fold) and by PGF (2.7-fold) but was most dramatically increased by PGF+EPO (5.3-fold), whereas caspase activity was only increased by PGF (1.5-fold) or PGF+EPO (2.2-fold). Thus, these data support the hypothesis that elimination of the protective effect of intraluteal P4 does not directly cause luteolysis of the early CL but allows PGF to induce luteolytic responses in CL lacking luteolytic capacity.
Introduction
The corpus luteum (CL) is the endocrine gland responsible for the production of progesterone (P4) from the ovary following ovulation. Subsequent regression of the CL or luteolysis allows nonpregnant animals to continue normal reproductive cycles. Luteolysis involves a decrease in P4 production [1–3] and a structural regression of the CL involving widespread cell death [4]. Prostaglandin F2α (PGF) is the primary factor responsible for inducing luteolysis in many species, including pigs [1–3]. Initiation of luteolysis follows PGF binding to a seven-transmembrane G protein-coupled receptor called the FP receptor [5]. The highest concentration of FP receptors occurs on the plasma membrane of the ovine steroidogenic large luteal cells [6]. Binding of PGF to the FP receptor leads to elevation of free intracellular calcium ([Ca2+]i) and activation of protein kinase C [7, 8] and mitogen-activated protein kinase [9, 10] pathways.
Exogenous PGF causes premature regression of the CL in many species, but only if given after a specific day of the reproductive cycle [11–16]. In the porcine CL, PGF causes luteolysis only after Day 12 of the estrous cycle [1, 2]. Before Day 12, the porcine CL does not regress after a single treatment with PGF, even though receptors for PGF are abundantly expressed in the CL [17, 18]. The mechanisms that prevent PGF-induced luteolysis before Day 12 but then allow luteolysis (luteolytic capacity) to occur after Day 12 are unknown.
Luteolysis induced by PGF is associated with specific responses in CL that do not occur in CL without luteolytic capacity. For example, in the porcine and/or bovine CL, PGF induces pathways involved in luteal estradiol biosynthesis (CYP19A1, also known as aromatase) and signaling (ESR2, also known as estrogen receptor β) [19] as well as intraluteal PGF production [20, 21]. Similarly, PGF causes a specific decrease in P4 production only in CL with luteolytic capacity, probably mediated by a specific decrease in steroidogenic acute regulatory protein (STAR) [22]. These PGF-induced changes in estradiol, PGF, and P4 synthesis pathways as well as other PGF responses observed in older CL [20] are useful markers of a CL with luteolytic capacity.
The primary steroid hormone produced by the CL is P4, which is essential for maintenance of pregnancy, mammary development and lactation, and normal reproductive cycles. Substantial evidence from both older literature [23, 24] and recent studies [25, 26] supports a direct role for intraluteal P4 in regulation of the CL. For example, P4 has been reported to be a survival factor in the bovine [27, 28] and rat [29–31] CL and in luteinized granulosa cells from bovine [32], human [33], and rat [34].
The present research tested a hypothesis that combines the concept of the survival effect of intraluteal P4 with the concept of luteolytic capacity. The finding of elevated nuclear P4 receptor (PGR) in CL lacking luteolytic capacity [19, 35] is consistent with a greater protective role for P4 in the early CL. We hypothesized that P4 may protect the CL from the luteolytic actions of PGF before acquisition of luteolytic capacity and that removing P4 from a CL without luteolytic capacity will remove the protective effects of P4 and allow luteolytic responses to occur after exogenous PGF treatment.
Materials and Methods
Chemicals and Reagents
Prostaglandin F2α (Prostamate) was from Phoenix Pharmaceuticals. Ketamine was from Fort Dodge Animal Health, and epostane (EPO) was donated by Sanofi-Synthelabo Research. T7 RNA polymerase, Taq polymerase, Reverse Transcriptase, dNTPs, RNasin, and DNase I were purchased from Promega. Molecular weight markers were from Gibco/BRL. Magnetight oligo(dT) beads were from Novagen. Unless otherwise specified, other chemicals and reagents used in the present study were purchased from Sigma Chemical Company.
Animals
Crossbred gilts (Cambrough × Line 19; age, 6–8 mo) were obtained from the University of Wisconsin-Madison herd. Animals were kept in individual pens with free access to water and were fed a maintenance diet of corn and soybean meal. For all experiments, animals were checked daily for standing estrus with a mature boar. First day of estrus was designated as Day 0. On Day 7, gilts (n = 4 per group) were divided according to a 2 × 2 design. The four groups included control, EPO, PGF, and PGF plus EPO (PGF+EPO). EPO (10 mg/kg) was fed in a mixture of corn and soybean meal every 12 h for 36 h. At 38 h, animals received either vehicle or 25 mg of PGF. Ovaries were collected 10 h after injection (48 h after start of EPO), and some of the CL were frozen in liquid nitrogen. The remainder of the CL was transported to the laboratory, cut into small pieces, and incubated in media (M199, 0.1% bovine serum albumin) for 2 h. Media were collected and frozen until assayed for P4 and PGF concentrations. The tissue in each well (n = 4 wells/animal) was weighed to allow expression of hormone production per milligram of tissue. The Research Animal Resource Center Committee of the College of Agriculture and Life Sciences at the University of Wisconsin-Madison approved all procedures performed on animals.
Hormone Measurements
Serum P4 was measured using a solid-phase radioimmunoassay kit (Coat-A-Count P4; Diagnostics Products Corporation) with charcoal-stripped porcine serum used for constructing the standard curve. Media P4 was measured using a competitive ELISA as described previously [36]. Media were diluted 1:1000 in assay buffer (40 mM MOPS, 0.12 M NaCl, 10 mM ethylenediaminetetra-acetic acid [EDTA], 0.1% gelatin, 0.5% Tween 20, and 0.005% chlorohexidine digluconate; pH 7.4). An ELISA for PGF was developed in our laboratory as described previously [20]. Media from luteal incubations were diluted 20-fold in assay buffer. Rabbit anti-sheep immunoglobulin (Ig) G (2 μg/ml; Calbiochem) was coated onto 96-well plates and washed three times with PBS buffer. Sheep anti-PGF (1:50 000; Assay Design, Inc.) was incubated on the plate for 1 h to allow binding to anti-sheep IgG. Samples and standards were then added and allowed to bind for 15 min. A PGF-horseradish peroxidase (HRP) conjugate made by the mixed anhydride method of Hayashi and Yamamoto [37] was incubated on the plate for 1 h. Absorbance was measured at 525 nm using an enzyme immunoassay plate reader (Bio-Tek Instruments, Model EL310; Fisher).
Isolation of Total RNA
Total RNA was isolated using the RNAgents Total RNA Isolation System (Promega). Briefly, CL were ground in a mortar and pestle cooled with liquid nitrogen. Approximately 30 mg of tissue were transferred to a fresh tube containing 900 μl of denaturing solution and homogenized for 20 sec using a polytron tissue grinder. Ninety microliters of 2 M sodium acetate and 900 μl of phenol/chloroform/isoamyl alcohol were added to the lysate and incubated on ice for 15 min. Samples were centrifuged for 20 min at 16 000 × g in a refrigerated microcentrifuge. Supernatant was transferred to a fresh tube, and RNA was precipitated with an equal volume of isopropanol and incubated at −20°C for 1 h. Samples were then centrifuged at 16 000 × g for 10 min to pellet RNA and washed with 1 ml of 70% ethanol. The RNA pellet was dried and resuspended in 30 μl of diethylpyrocarbonate-treated water, and RNA purity and quantity were measured by absorbance at 260/280 nm in a spectrophotometer.
Reverse Transcription-Polymerase Chain Reaction
Evaluation of ESR2, CYP19A1, STAR, and FOSB mRNA was done using glyceraldehyde-3-phosphate dehydrogenase (GAPDH) mRNA as an internal control. Primers for GAPDH were designed from the published partial porcine sequence (X94251) to produce the expected 285-bp product. ESR2, CYP19A1, STAR, and FOSB primers were synthesized from published GenBank sequences to produce the expected 214-, 358-, 395-, and 129-bp products, respectively (see Supplemental Table S1 for primer sequences, available online at www.biolreprod.org). Reverse transcription was carried out with 19 μl of 1× master mix (1× RT buffer, 0.2 mM dNTPs, 100 pmol of random primer, and 40 U of reverse transcriptase) and 2 μl of total RNA for 1.5 h at 37°C. For PCR, 4 μl of RT reaction were added to 1× PCR master mix (1× thermophilic buffer supplied with enzyme, 1.5 mM MgCl2, 0.2 mM dNTPs, 0.4 μM each of forward and reverse primers, and 0.5 U of Taq DNA polymerase) in a 20-μl final volume and amplified for 25–30 cycles of PCR (95°C for 30 sec, 54–57°C for 30 sec, and 72°C for 30 sec, followed by a final extension at 72°C for 5 min). Reaction products were separated on 5% PAGE gels and stained with ethidium bromide. For each sample, two products were quantified using Collage imaging system (Fotodyne). Values were calculated as the ratio of gene-specific band intensity to GAPDH band intensity.
Steady-state concentrations of mRNA for CASP3, PLA2G1B, and PTGS2 were quantified by real-time PCR using a GeneAmp 5700 Sequence Detection System (PE Biosystems), with PCR products detected with SYBR Green I (Molecular Probes). Primers for amplification were designed using Primer Express (PE Biosystem). Each PCR reaction mix (25 μl) contained 1× PCR Buffer (Promega) with 1:20 000 dilution of SYBR Green I, 1.5 mM MgCl2, 200 μM dNTP, 250 nM forward primer, 250 nM reverse primer, 2 μl of RT products, and 1.25 U of GoTaq polymerase (Promega) [38, 39]. Thermal cycling conditions were 94°C for 30 sec; followed by 40 cycles at 94°C for 30 sec, 57°C for 30 sec, and 72°C for 30 sec; and then 72°C for 10 min. Melting curve analyses and agarose gel electrophoresis were performed after real-time PCR reactions to monitor PCR product purity. (Primers for investigated genes are listed in Supplemental Table S1.)
The threshold cycle (CT) numbers were determined for the amplified cDNA for each investigated mRNA and for the housekeeping gene, ACTB (known as β-ACT), in each unknown sample during real-time PCR. The relative quantification of investigated gene expression was evaluated using a standard curve method [40]. For each sample, the amount of investigated gene mRNA and of housekeeping gene mRNA, ACTB, was determined from the standard curve. Final values were expressed as the amount of investigated gene mRNA divided by the amount of ACTB mRNA.
Western Blotting for STAR and ESR2
Frozen luteal tissue (∼60 mg) was homogenized in 900 μl of cold homogenization buffer (50 mM Tris [pH 7.4], 150 mM NaCl, 1 mM sodium orthovanadate, 1 mM PMSF, 1 mg/ml of leupeptin, 1 mg/ml of aprotinin, 1% Triton X-100, and 0.25% deoxycholate) using a polytron tissue grinder. Lysate was centrifuged twice at 16 000 × g for 10 min to obtain a clear lysate. Protein concentration in supernatant was measured by BCA assay (Pierce Biochemical). Sixty micrograms of protein extract were combined with 10 μl of 6× loading buffer and steamed for 5 min. The entire sample was loaded on a 10% SDS-PAGE gel, and proteins were separated at 120 mA for 1.5 h. Proteins were transferred to polyvinylidene fluoride membranes using the Mini-PROTEAN II gel transfer system (Bio-Rad). Following transfer, blots were incubated in blocking buffer (10 mM Tris [pH 7.4], 150 mM NaCl, 0.1% Tween 20, and 5% nonfat dry milk) overnight at 4°C. Specific ESR2 protein was determined by immunoblots using anti-ESR2 antibody (HC-150; Santa Cruz Biotechnology) at 1:2000 dilution for 2 h at 25°C, followed by three washes (10 mM Tris [pH 7.4], 150 mM NaCl, and 0.1% [v/v] Tween 20). Anti-rabbit HRP (Santa Cruz Biotechnology) was added at 1:5000 dilution for 1 h at 25°C, followed by three washes. Specific STAR protein immunoblotting proceeded by incubating blots with anti-StAR antibody at 1:5000 dilution for 2 h at 25°C, followed by three washes. Anti-rabbit HRP (Santa Cruz Biotechnology) was added at 1:5000 dilution for 1 h at 25°C, followed by three washes. Specific proteins were detected with enhanced chemiluminescent reagent (NEN Life Science Products). Blots were exposed to x-ray film for 5 min and quantified using collage photo imaging system.
Caspase Activity Assay
Caspase 3 (CASP3) activity in luteal tissue was measured with a Caspase-Glo 3/7 assay kit (Promega) [41]. Cytosolic extracts from luteal tissue were prepared by homogenization in hypotonic extraction buffer (25 mM Hepes [pH 7.5], 5 mM MgCL2, 1 mM ethylene glycol tetraacetic acid, and 1 μg/ml each of pepstatin, leupeptin, and aprotinin) and subsequently centrifuged (15 min, 13 000 relative centrifugal force, 4°C). An equal volume of Caspase-Glo 3/7 reagent and 10 μg/ml of cytosolic protein for each sample were added to an individual luminometer cuvette (12 × 75 mm) and incubated at room temperature for 1 h. The luminescence of each sample was measured in a Monolight 2010 Luminometer (Analytical Luminescence Laboratory).
Statistical Analyses
Results for CYP19A1, CASP3, PLA2G1B, PTGS2, FOSB, ESR2, STAR, caspase activity, media PGF, and media P4 were analyzed by two-way ANOVA using the general linear model procedure of the Statistical Analysis System (SAS) [42]. Analysis of P4 from serum was done using the PROC MIXED procedure of the SAS [42].
Results
Serum P4
Circulating P4 concentrations were similar in all groups before EPO treatment (Day 7). EPO treatment resulted in an abrupt and sustained decrease (P < 0.05) in circulating P4 from approximately 22 ng/ml to less than 2 ng/ml within 12 h (Fig. 1). Circulating P4 remained high in the two groups that were not treated with EPO. Low circulating P4 continued throughout the rest of the experiment for gilts treated with EPO (Fig. 1). As expected, no difference was found in circulating P4 between the control animals and the PGF-treated animals at any time before PGF treatment. Treatment with PGF at 38 h did not affect circulating P4 at 48 h (Fig. 1).
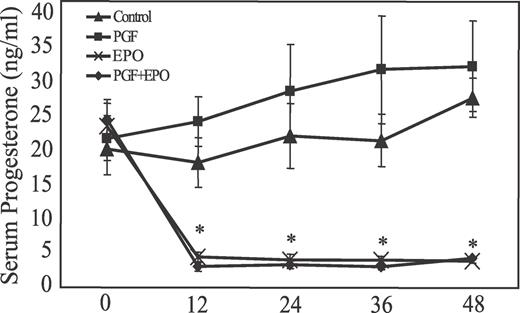
Effect of EPO treatment on circulating progesterone concentrations in gilts. Time zero is on Day 7 of the estrous cycle and just before EPO treatment. At 38 h after start of EPO, gilts were treated with PGF or saline, and CL were removed 10 h later (48 h after start of EPO or Day 9 of the estrous cycle). An asterisk denotes significant differences (P < 0.01) between the groups that were treated with EPO compared with the groups that were not treated with EPO.
Media P4 and PGF Production
Treatment with PGF alone, 10 h before CL removal, did not affect in vitro P4 production compared to control animals (Fig. 2). However, in vivo treatment with EPO for 48 h decreased P4 production to 11% of control values (P < 0.05). Treatment with PGF+EPO tended to further reduce in vitro P4 production to 50% of the values with EPO alone (P = 0.081 compared to EPO alone).
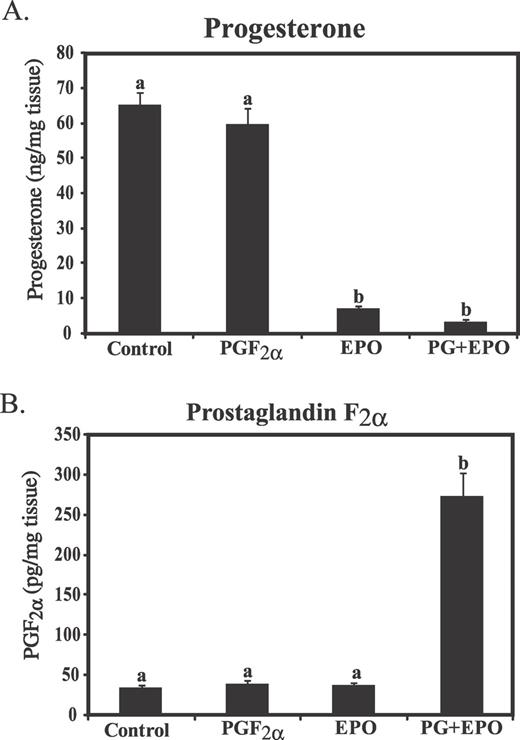
Effect of in vivo treatment with EPO for 48 h or PGF (10 h after treatment) on secretion of progesterone (A) or PGF (B) during a 2-h in vitro incubation of diced luteal tissue. Different lowercase letters indicate significant differences between groups (P < 0.01).
Luteal PGF secretion was not different between control and PGF-treated animals (Fig. 2). EPO treatment also did not affect PGF secretion from luteal tissue in vitro. However, treatment with PGF+EPO resulted in a dramatic increase in luteal PGF production (7.86-fold increase over control, P < 0.05).
STAR mRNA and Protein Expression
STAR mRNA (pixel intensity of STAR mRNA/GAPDH mRNA) was not affected by treatment (Fig. 3A). In contrast, STAR protein (Fig. 3B) was greater in animals treated with EPO alone (2.70-fold greater than control, P < 0.05), but this effect was eliminated when EPO was combined with PGF.
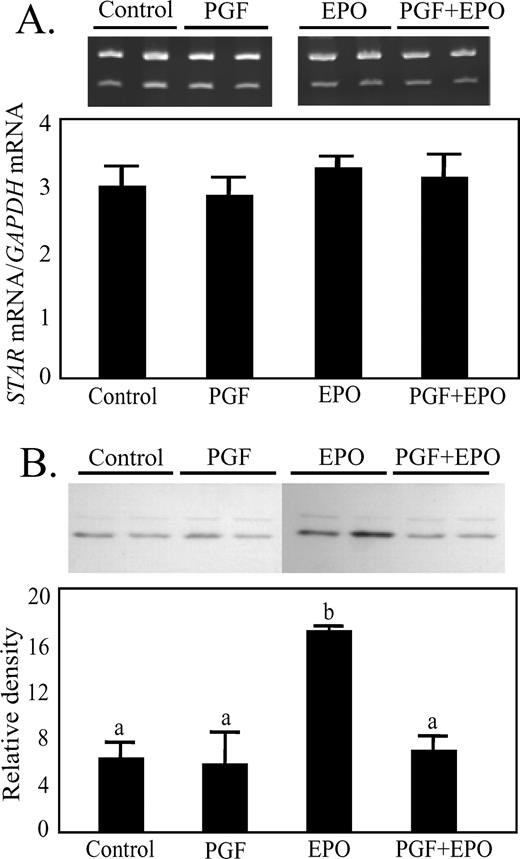
Effect of in vivo treatment with EPO for 48 h or PGF (10 h after treatment) on expression of STAR mRNA (A) or STAR protein (B) in luteal tissue. A) Representative ethidium bromide-stained gel, with GAPDH mRNA in the upper band and STAR mRNA in the lower band. The ratio of the two mRNAs is shown in the graph. B) Representative Western blot for STAR protein with a graph of the normalized results. Different lowercase letters indicate significant differences between groups (P < 0.05).
Expression of Genes Related to Production of PGF
Steady-state concentrations of PLA2G1B (Table 1) were not significantly increased by either PGF or EPO treatment, although values were numerically greater than controls (EPO, 2.03-fold greater than control; PGF, 3.08-fold greater than control). Treatment with PGF+EPO increased (P < 0.05) mRNA for PLA2G1B compared to control (3.69-fold greater than control), but the values with PGF+EPO were not significantly greater than those with PGF or EPO alone. Steady-state concentrations of mRNA for PTGS2 (Table 1) were not altered by PGF or EPO treatment (PGF, 89% of control; EPO, 75% of control). However, treatment with PGF+EPO increased PTGS2 mRNA (154% of control, P < 0.05).
Effects of PGF and epostane (EPO) on steady-state concentrations of specific mRNA transcripts in porcine CL on Day 9 of the estrous cycle.*
| Gene | Control | PGF | EPO | PGF+EPO |
|---|---|---|---|---|
| PLA2G1B (× 0.001) | 7.67 ± 4.71a | 23.6 ± 6.61ab | 15.6 ± 7.12ab | 28.3 ± 5.90b |
| PTGS2 (× 0.01) | 3.78 ± 0.42a | 3.35 ± 0.42a | 2.83 ± 0.58a | 5.83 ± 0.51b |
| Gene | Control | PGF | EPO | PGF+EPO |
|---|---|---|---|---|
| PLA2G1B (× 0.001) | 7.67 ± 4.71a | 23.6 ± 6.61ab | 15.6 ± 7.12ab | 28.3 ± 5.90b |
| PTGS2 (× 0.01) | 3.78 ± 0.42a | 3.35 ± 0.42a | 2.83 ± 0.58a | 5.83 ± 0.51b |
All values are normalized to ACTB mRNA.
Denotes significant difference, P < 0.05.
Expression of Genes Related to Estrogen Production or Action
The steady-state concentrations of ESR2 mRNA were not different in any of the treatment groups (Fig. 4A). Likewise, ESR2 protein levels were not altered in any treatment group (Fig. 4B). In contrast, treatment with PGF dramatically increased CYP19A1 mRNA (Fig. 5A), but only when combined with EPO (42-fold greater than control, P < 0.05).
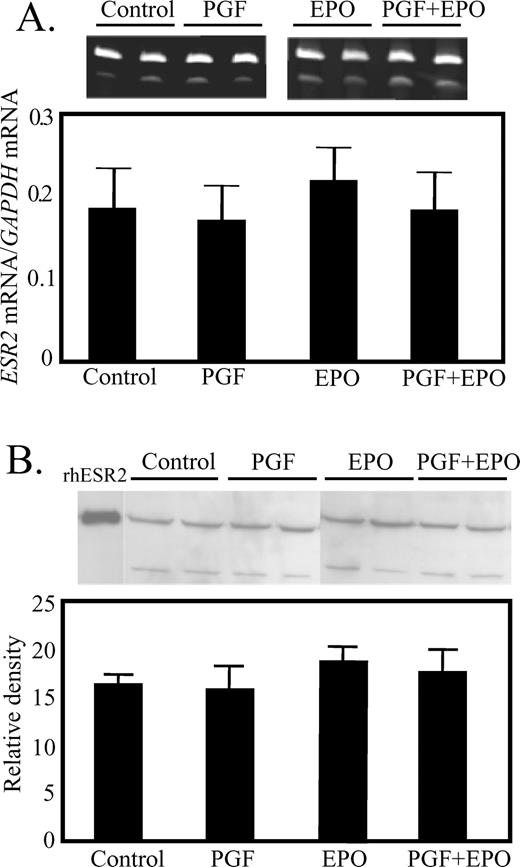
Lack of effect of in vivo treatment with EPO for 48 h or PGF (10 h after treatment) on expression of ESR2 mRNA (A) or ESR2 protein (B) in luteal tissue. A) Representative ethidium bromide-stained gel, with GAPDH mRNA in the upper band and ESR2 in the lower band. The ratio for all samples is shown in the graph. B) Representative Western blot for ESR2 protein.
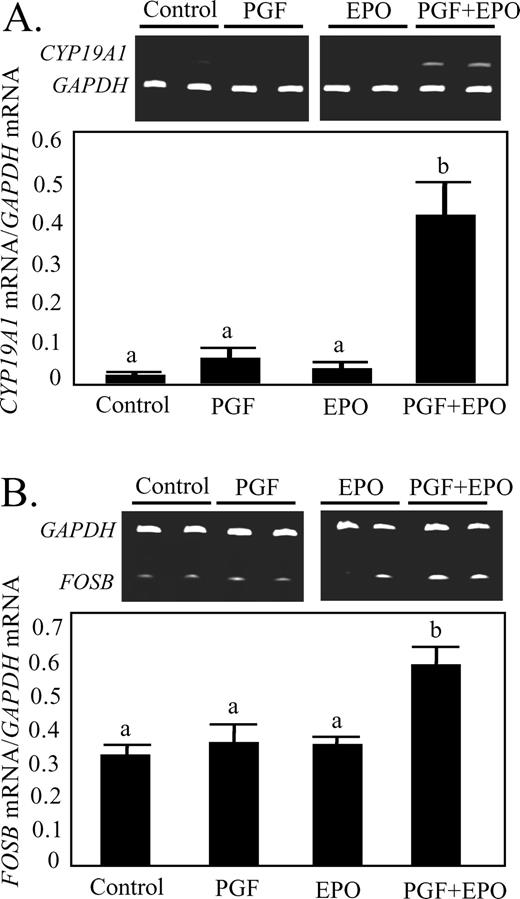
Effect of in vivo treatment with EPO for 48 h or PGF (10 h after treatment) on concentrations of CYP19A1 (A) or FOSB (B) mRNA in luteal tissue. Different lowercase letters indicate significant differences between groups (P < 0.05).
Expression of FOSB and CASP3 mRNA and CASP3 Activity
The transcription factor FOSB (Fig. 5B) was induced only in the PGF+EPO group (P < 0.05). The mRNA for CASP3 (Fig. 6A) was increased (P < 0.05) by PGF (2.4-fold), EPO (2.9-fold), and PGF+EPO (4.4-fold). The CASP3 activity (Fig. 6B) was not increased by EPO but was increased (P < 0.05) by PGF (1.5-fold) and by PGF+EPO (2.1-fold).
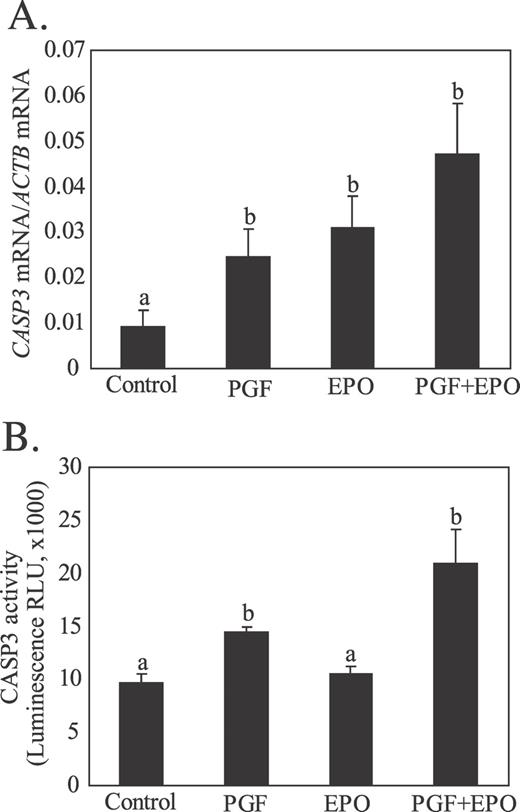
Effect of in vivo treatment with EPO for 48 h or PGF (10 h after treatment) on expression of CASP3 mRNA (A) or CASP3 activity (B) in luteal tissue. Different lowercase letters indicate significant differences between groups (P < 0.05).
Discussion
The length of the luteal phase and timing of luteolysis are tightly controlled by complex interactions of the uterus, hypothalamus and pituitary, and ovary. In particular, the secretion of PGF from the uterus is thought to begin the luteolytic cascade during spontaneous luteolysis in the pig [1, 43]. Nevertheless, the pig CL is resistant to PGF-induced luteolysis for 12 of the 15 days of the luteal phase [1, 2]. The early CL of many other species also manifest resistance to PGF-induced luteolysis, but for a shorter period than the pig CL (generally only the first week or less of the luteal phase) [1, 2, 11–16]. Intriguingly, much of this period of PGF resistance is marked by an abundance of luteal PGF receptors [17, 18] and some biological responses to PGF treatment; however, the full luteolytic cascade is not induced by a single PGF treatment. The differences in the porcine CL after Day 12 that enable the full luteolytic response to PGF treatment have not been fully defined. In the bovine CL, greater amounts of PGR are found in the early CL than in the later CL [35], and decreasing PGR as the CL ages may underlie the acquisition of luteolytic capacity. We also previously reported a decrease in PGR as the porcine CL matures, consistent with a role for P4 and PGR in protecting the early CL [19]. The present study directly tested this hypothesis by examining the effect of short-term removal of P4 on PGF-induced responses in CL without luteolytic capacity. Acute P4 removal in vivo was accomplished using EPO, an HSD3B1 inhibitor. After a single EPO treatment, serum P4 decreased dramatically, from 20–26 ng/ml to less than 2 ng/ml (Fig. 1), and this decreased P4 was maintained for the 48-h duration of the present study. By giving PGF to animals treated with or without EPO, we could determine the effects of exogenous PGF in animals with high and low P4 concentrations in the intraluteal environment. The key findings of the present study demonstrated that withdrawing luteal P4 promotes the ability of PGF to induce luteolytic responses in CL that are normally resistant to PGF-induced luteolysis.
The luteolytic role of intraluteal P4 has been investigated for many years. Studies using PGR antagonists or exogenous P4 supplementation have demonstrated that P4 protects luteal cells in vivo from luteolysis or cell death. Treatment of rat luteal cells with P4 blocks FasL-induced cell death [30, 44]. Rueda et al. [28] tested the hypothesis that P4 acts at a local level to inhibit luteal apoptosis in cultured bovine luteal cells. Treatment with aminoglutethimide (CYP11A1 inhibitor) decreased P4 synthesis and increased luteal cell apoptosis, whereas P4 supplementation blocked this effect. In addition, treatment with the PGR antagonists RU 486 or onapristone caused an increase in DNA fragmentation [27–31]. These observations support the concept that P4 represses the onset of luteal apoptosis by a PGR-dependent mechanism. Evidence also indicates a role for P4 in the primate CL, based on the finding that in vivo treatment with an inhibitor of P4 synthesis promoted premature luteal regression [45]. Subsequent elegant studies using rhesus monkeys have further characterized the critical role of intraluteal P4 in luteolysis and identified many changes in gene expression that are associated with inhibiting intraluteal P4 [46, 47].
In contrast to these previous studies, we observed very minor effects following inhibition of intraluteal P4 for 48 h in vivo (Days 7–9 of the estrous cycle). No change was found in intraluteal PGF secretion, even though intraluteal P4 secretion was greatly reduced during in vitro incubations of luteal tissue from animals treated with EPO in vivo. An increase was observed in CASP3 mRNA after EPO treatment, but no change in CASP3 activity was noted, suggesting that apoptotic pathways may have been facilitated by lowering intraluteal P4 concentrations but likely were not fully activated. No other endpoint evaluated as a marker of luteolysis was altered by EPO treatment alone. The most dramatic effect of EPO alone was the almost 3-fold induction of STAR protein concentrations. This effect of reduced intraluteal P4 on STAR protein was unexpected and cannot be fully explained at this time. The lack of effect of EPO treatment on STAR mRNA suggests that inhibition of intraluteal P4 may have decreased STAR protein degradation or possibly increased STAR mRNA translation efficiency. Except for this one unexpected effect on STAR protein, the lack of major effects from a dramatic decrease in intraluteal P4 for 2 d seem contradictory to previous studies showing a luteolytic effect of P4 inhibition. Perhaps the difference may be explained by our use of an animal model that lacked luteolytic capacity, compared to previous studies that used animal models or cells that would have already acquired luteolytic capacity. We also cannot rule out species or other methodological differences that explain this inconsistency between studies. Nevertheless, the most likely interpretation of our results at present is that inhibition of intraluteal P4 alone did not cause luteolysis in porcine CL that lack luteolytic capacity.
By far, the most dramatic effects were observed following EPO treatment combined with PGF treatment. As we have reported previously [19, 20, 22], PGF treatment of the Day 9 porcine CL did not activate the luteolytic markers that were evaluated in the present study. However, after EPO treatment, the effect of PGF was very similar to responses that we have observed in older porcine CL that have luteolytic capacity, including increased CASP3 activity, intraluteal PGF production, and increased CYP19A1 and FOSB mRNAs.
Upregulation of intraluteal PGF production following treatment with PGF has been observed in the CL of pigs [20, 48], cows [21, 49], sheep [50, 51], and rats [52]. Many factors can stimulate the biosynthesis of PGF production by the CL, including cytokines [53, 54] and PGF itself [20, 21, 48–51]. Positive-feedback loops are fairly uncommon in adult animals, but clearly, PGF induction of luteal PGF production demonstrates a positive feedback or autoamplification loop that results in the eventual destruction of the CL. This positive-feedback loop does not occur in the pig CL without luteolytic capacity (i.e., before Day 12). However, after Day 12, PGF treatment does induce a dramatic induction of luteal PGF production [20, 48]. Yet, in EPO-treated animals on Day 9, PGF was able to robustly induce intraluteal PGF production to levels consistent with those in luteolysis [20]. This result is consistent with a blockade by P4 of PGF-induced upregulation of luteal PGF production. The induction of PTGS2 (COX-2) and a key phospholipase A2 gene (PLA2G1B) may underlie the positive-feedback effects of PGF, as demonstrated by the dramatic PGF-induced increase in mRNA for these enzymes following reduction in intraluteal P4. The role of PTGS2 in luteolysis has previously been indicated in the CL of other species [21, 50, 55]. Other studies have also shown similar results in vitro, with P4 treatment of luteal cells inhibiting PGF production [56].
The present results provide further evidence for a complex regulatory relationship between the P4 and PGF biosynthetic and signaling pathways in the CL [57]. In particular, the present study is, to our knowledge, the first report of a PGF-induced decrease in STAR protein in a CL that normally lacks luteolytic capacity [22]. Previous studies have reported decreases in luteal STAR mRNA and protein after PGF treatment of fully functional CL [19, 58–61]. Similar to our results, PGF induced a rapid decrease in STAR protein without affecting STAR mRNA in the rat CL [62]. It appears that the acute decrease in P4 following inhibition of HSD3B1 leads to an upregulation in STAR protein while, at the same time, promoting the ability of PGF to decrease STAR protein.
Treatment with PGF also dramatically induces a number of transcription factors, including the AP-1 transcription factor proteins [63, 64] that may underlie many of the luteolytic effects of PGF on gene expression. In the present study, PGF induced a sustained increase in FOSB only in animals that had also received EPO and not in those that had not received EPO. Activation of the FOSB transcription factor is associated with cell death in a number of physiological contexts [65]. For example, P4 supplementation of pregnant rats blocks the normal rise in AP-1 proteins, including FOSB, that occurs in the uterus at parturition [66]. Similarly, it appears that intraluteal P4 regulates transcription of the CYP19A1 gene and the normal upregulation of estradiol production and CYP19A1 activity in regressing CL [67, 68]. Previous studies have reported that CYP19A1 mRNA levels and estradiol production are only induced by PGF in CL with luteolytic capacity [19]. Thus, the PGF-induced increase in CYP19A1 expression is another marker for luteolytic capacity that was found in the early porcine CL after EPO treatment. Thus, the results for each of these varied responses are consistent with intraluteal P4 inhibiting the induction by PGF of various genes in CL without luteolytic capacity.
Our experimental design did not provide information on the intracellular mechanisms by which P4 blocks PGF-induced luteolytic responses before Day 12 in the porcine CL. The effects of P4 could be mediated by several types of luteal PGRs (for review, see [26, 69]). Binding sites for P4 and mRNA for various forms of PGRs have been reported in the CL of a number of species [19, 35, 70–72]. The classical PGR (PGR), including the A and B splice variants, are present in the CL of various species [19, 35, 73]. Besides the nuclear and membrane-associated pathways for the classical PGR, P4 could have antiapoptotic effects through various forms of membrane-bound PGRs (MPRα, MPRβ, and MPRγ) first characterized by Zhu et al. [74] and found in other species, including in the porcine, bovine, and ovine CL [19, 75]. Another PGR was recently identified and localized to the endoplasmic reticulum of ovine luteal cells [76]. This seven-transmembrane domain receptor can mobilize intracellular Ca2+ after P4 binding, but the classical PGR antagonist RU 486 did not block this P4 action. Alternatively, a membrane receptor for P4, RDA288, was found to have an important role in mediating the antiapoptotic action of P4 in rat granulosa cells [77]. In addition, PGR membrane component 1 (PGRMC1) and SERPINEA1 (formerly PAI-1) binding protein 1 (SERBP1) are found on rat granulosa and luteal cells [78]. In particular, PGRMC1 is a likely candidate for mediating nongenomic actions of P4, because RNA inhibition of PGRMC1 reduced the ability of P4 to protect human granulosa-luteal cell from apoptosis [79]. Recent studies report that P4 induces a negative regulator of PGR, FKBP5, in human cancer cell lines and that regulation of this protein could alter sensitivity to P4 action at different stages of luteal development [80]. Also, a recent report demonstrates that high intraluteal concentrations of P4 alter properties of the plasma membrane such that PGF-induced intracellular calcium mobilization is attenuated [81]. Thus, a surprising variety of potential receptors for P4 and regulators of P4 action exists, making it likely that P4 has both genomic (e.g., on FOSB and CYP19A1 mRNA) and nongenomic (possibly PGF biosynthesis and STAR protein) effects mediated by nuclear, membrane, and intracellular signaling pathways in the CL. The present study has not only demonstrated the role of P4 in luteolytic capacity but also highlighted key endpoints (CYP19A1, STAR, FOSB, and intraluteal PGF secretion) that are differentially regulated by PGF in a reduced P4 environment. It seems clear that future studies are needed to distinguish the PGR subtypes and specific intracellular mechanisms that underlie the effect of P4 in inhibiting the action of PGF in the CL without luteolytic capacity.
References
Author notes
Supported by NIH HD-50616, USDA-00-35203-9134, and an Advanced Opportunity Fellowship to F.J.D.
Current address: Department of Poultry Science, Pennsylvania State University, University Park, PA 16802-3501.
