


Abstract
Angiotensin-converting enzyme inhibitors (ACEis) and angiotensin receptor blockers (ARBs) may protect against aging-related decline. This study directly compared ACEis and ARBs on associations with risk of mobility disability in older adults when combined with a physical activity intervention.
This was a secondary analysis of the Lifestyle Interventions and Independence for Elders (LIFE) trial. Participants aged 70–89 years were randomized to a physical activity or health education intervention. Outcomes included incident and persistent major mobility disability, injurious falls, short physical performance battery, and gait speed. For this analysis, only participants who reported ACEi or ARB use at baseline were included. Baseline differences between ACEi and ARB groups were adjusted for using inverse probability of treatment weights. Weighted Cox proportional hazard models and analysis of covariance models were used to evaluate the independent effects of medications and interaction effects with the intervention on each outcome.
Of 1,635 participants in the Lifestyle Interventions and Independence for Elders study, 796 used either an ACEi (496, 62.3%) or ARB (300, 37.7%). Compared with ACEi users, ARB users had 28% lower risk (hazard ratio [HR] = 0.72 [0.60–0.85]) of incident major mobility disability and 35% (HR = 0.65 [0.52–0.82]) lower risk of persistent major mobility disability whereas no interaction between medication use and intervention was observed. Risk of injurious falls and changes in short physical performance battery or gait speed were not different between ARB and ACEi users.
These results suggest that ARBs may protect from major mobility disability by other mechanisms than improving physical performance.
A cornerstone of healthy aging is the capacity to live and function independently by maintaining mobility (1). Physical independence can be positively or negatively influenced by a number of clinical factors, including pharmacotherapy. Earlier studies have shown a potential protective effect on maintaining mobility associated with the use of angiotensin-converting enzyme inhibitors (ACEis) medications (2–5). Hypotheses to describe these protective effects observed with ACEi include influence on muscle mass and strength (4,6,7), greater tolerability for physical activity (PA) (4), or reduction of inflammatory markers (eg, interleukin-6, C-reactive protein) (8–10). These effects are generally a result of blockade along the renin–angiotensin system.
Angiotensin receptor blockers (ARBs) have similar activity along the renin–angiotensin system pathway and have been observed to have similar effects on physical performance, inflammation, and muscular changes (11). ARBs are generally used interchangeably with ACEis for the treatment of hypertension and prevention of cardiovascular and renal diseases (12–14); however, in many cases, ARBs may be preferable to ACEis in many given the former’s reduced adverse effect profile (eg, cough and angioedema) (15). In addition, ARBs have been found to be protected through a distinct pathway not shared by ACEi, that is, activation of peroxisome proliferator-activated receptor-gamma, with potential effects on metabolic syndrome, inflammation, and neurodegeneration (16–18).
The comparative effects of ACEi versus ARBs paired with a PA intervention to help prevent mobility disability and enhance physical functioning have not been specifically explored. The Lifestyle Interventions and Independence for Elders (LIFE) trial serves as an ideal source to compare older persons taking ACEi and ARB medications because it is the largest (1,635 participants) and longest (average 2.6 years follow-up) randomized trial to evaluate the benefit of PA on mobility disability in older adults (19,20). As such, the primary objective of this secondary analysis of the LIFE trial was to directly compare incident and persistent mobility disability rates between ACEi and ARB users in the LIFE study and the potential synergism of medication use with main PA intervention. In addition to the primary major mobility disability (MMD) outcome, the effect on other measures of physical performance and risk of falls were also explored. On the basis of the potential to reduce inflammation, enhance muscle function and response to exercise, we hypothesized that ARBs would exhibit a larger influence on response to PA and a larger protective effect on MMD other measures of physical performance, and risk of injurious falls than ACEi.
Methods
LIFE Study Overview
The LIFE study was a multicenter, single-blind, parallel randomized trial conducted across eight centers in the United States between February 2010 and December 2013 (20). The study protocol was approved by the institutional review boards of each institution. Written informed consent was obtained from all study participants. The trial was monitored by a data and safety monitoring board appointed by the National Institute on Aging. The LIFE study was registered with www.clinicaltrials.gov before participant enrollment in the trial (NCT01072500). Details of the study design, rationale and characteristics of the full study population are described elsewhere (20,21). Participants were eligible for the trial who were 70–89 years of age, scored less than 10 on the short physical performance battery (SPPB), were sedentary with less than or equal to 125 minutes of activity per week, and were able to complete the 400 m walk test within 15 minutes without sitting, leaning or without assistance.
Intervention
Details of the study interventions were published previously (20,22). The PA intervention involved walking, with a goal of 150 minutes per week, strength, flexibility, and balance training. The intervention included attendance at two center-based visits per week and home-based activity three to four times per week for the duration of the study. The PA sessions were individualized and progressed toward a goal of 30 minutes of walking daily at moderate intensity, 10 minutes of primarily lower-extremity strength training by means of ankle weights (2 sets of 10 repetitions), 10 minutes of balance training, and large muscle group flexibility exercises.
The health education (HE) intervention included weekly educational workshops during the first 26 weeks, and then monthly sessions thereafter. Workshops included topics relevant to older adults, such as how to effectively negotiate the health care system, how to travel safely, preventive services and screenings recommended at different ages, where to go for reliable health information, and nutrition. The workshops did not include any PA topics. The program also included a 5 to 10 minute instructor-led program of gentle upper extremity stretching or flexibility exercises.
Medication Use and Study Variables
Medication use was assessed at baseline and again at 12 month follow-up by visual inspection of all prescription and nonprescription medications taken in the previous 2 weeks. Participants were grouped according to use of ACEis or ARBs during the baseline assessment for outcomes occurring in the first 12 months whereas the 12-month medication inventory was used thereafter to assess discontinuation of baseline medications. If a baseline user was observed to discontinue the medication at the 12 month assessment, or switched to the other medication group, they were censored at 12 months. New users or switchers for each medication group that were observed at the 12 month assessment were not added to the analytic cohort. Individuals not using one of these medication groups (N = 820) or who reported using both groups (N = 19) at baseline were excluded. The final analytic group consisted only of those individuals using ACEis or ARBs at baseline. Baseline data included, among others, demographic information, medical history, medication inventory, body mass index, and lower-extremity function measured via SPPB (21,23). The total number of antihypertensive medications was recorded for each participant to control for severity of hypertensive disease. Baseline characteristics were described and compared between ACEi and ARB users via t-tests and chi-squared tests.
Follow-up Visits and Outcome Assessment
Participants were assessed every 6 months at clinic visits. Home, telephone, and proxy assessments were attempted if participants could return to the clinic. The assessment staff were masked to the intervention assignment and remained separate from the intervention team. Participants were asked not to disclose their assigned intervention arm or talk about their interventions during the assessment.
Details of MMD ascertainment were reported previously (19). Briefly, participants were asked to walk 400 m at their usual pace, and MMD was defined as the inability to complete the walk within 15 minutes without sitting and without the help of another person or walker. When MMD could not be objectively measured because of the inability of the participant to come to the clinic and absence of a suitable walking course at the participant’s home, institution, or hospital, an alternative adjudication of the outcome was based on objective inability to walk 4 m in less than 10 seconds, or self-, proxy-, or medical record-reported inability to walk across a room. If participants met these alternative criteria, they were considered to be unable to complete the 400 m walk within 15 minutes. Two consecutive MMD assessments or MMD followed by death defined persistent MMD. Falls were assessed based on prior work (24), where the outcome of “injurious fall” was defined as a fall resulting in a fracture or injury requiring hospitalization. Outcomes were adjudicated by at least two reviewers using hospital records. SPPB was measured during each clinical follow-up visit and gait speed was measured based on completion time of the 400 m walk test or from the SPPB.
Statistical Analysis
Two general approaches were used to compare outcomes among ACEi and ARB users. The first compared the LIFE randomized intervention arms, PA versus HE, among each medication group using interaction terms (2,5). This approach evaluated the effect of the PA intervention by medication group to determine whether there was a synergistic effect of medications with response to PA. The cohort was then separated by intervention assignment and multivariable logistic models were used to generate probabilities (propensity scores) of being treated with ACEis or ARBs conditional on baseline demographic and clinical characteristics of participants (Table 1). Using this probability, inverse probability of treatment weights (IPTW) were calculated for each participant, which are a commonly used approach to control for confounding (25–27). Covariate balance with IPTW was assessed using standardized differences (SD) where a value of less than or equal to 0.10 is suggestive of covariate balance between the two groups (28).
Baseline Characteristics Before and After Inverse Probability of Treatment Weighting Adjustment Among Angiotensin-Converting Enzyme Inhibitors (ACEis) and Angiotensin Receptor Blocker (ARBs) Users
| Characteristics | Medication use | p-value | St. Diff.* | |
|---|---|---|---|---|
| ACEi N = 496 (62.3%) | ARBs N = 300 (37.7%) | |||
| Physical activity intervention | 249 (50.2%) | 142 (47.3%) | — | — |
| Age, mean (SD) | 78.9 (5.3) | 78.5 (5.1) | .344 | <0.00 |
| Female | 281 (56.7%) | 239 (79.7%) | <.001 | 0.02 |
| Race | <.001 | |||
| White | 383 (77.2%) | 197 (65.7%) | ||
| Black | 77 (15.5%) | 81 (27.0%) | ||
| Other | 36 (7.3%) | 22 (7.3%) | ||
| Education, ≥ high school | 331 (66.7%) | 197 (65.7%) | .758 | 0.02 |
| Systolic blood pressure, mean (SD) | 126.9 (18.5) | 129.7 (20.0) | .050 | 0.08 |
| Diastolic blood pressure, mean (SD) | 67.0 (10.4) | 68.2 (11.2) | .130 | 0.06 |
| Smoking | .856 | |||
| Never | 259 (52.2%) | 161 (53.7%) | ||
| Former | 224 (45.2%) | 130 (43.3%) | ||
| Current | 13 (2.6%) | 9 (3.0%) | ||
| Body mass index | 30.6 (5.6) | 32.0 (5.9) | <.001 | <0.00 |
| Hypertension | 440 (88.7%) | 283 (94.3%) | .008 | 0.10 |
| Cerebrovascular disease | 176 (35.5%) | 86 (28.7%) | .047 | <0.00 |
| Diabetes | 198 (39.9%) | 187 (37.7%) | .530 | <0.00 |
| Heart attack | 58 (11.7%) | 28 (9.3%) | .299 | <0.00 |
| Heart failure | 34 (6.9%) | 23 (7.7%) | .667 | <0.00 |
| Arthritis | 85 (17.1%) | 69 (23.0%) | .042 | 0.01 |
| Chronic lung disease | 30 (16.1%) | 51 (17.0%) | .748 | 0.01 |
| SPPB ≤7 | 225 (45.4%) | 131 (43.7%) | .641 | 0.01 |
| Number of antihypertensive drugs | .789 | <0.00 | ||
| 1 | 156 (31.5%) | 95 (32.3%) | ||
| 2 | 223 (45.0%) | 130 (43.3%) | ||
| 3+ | 117 (23.6%) | 73 (24.3%) | ||
| Self-rated overall health | .507 | 0.01 | ||
| Poor | 29 (5.9%) | 10 (3.3%) | ||
| Fair | 114 (23.0%) | 72 (24.0%) | ||
| Good | 258 (52.0%) | 159 (53.0%) | ||
| Very good–excellent | 95 (19.1%) | 59 (19.7%) | ||
| Moderate activity (daily average), mean (SD) | ||||
| Minutes | 25.1 (24.0) | 26.1 (20.3) | .577 | 0.10 |
| Steps | 916.6 (1,126.8) | 870.1 (924.8) | .573 | 0.01 |
| Gait speed (m/s), mean (SD) | 0.81 (0.17) | 0.81 (0.15) | .664 | 0.02 |
| Cognitive assessment (3MSE), mean (SD) | 91.5 (5.5) | 91.5 (5.6) | .970 | 0.05 |
| Session attendance | 64% | 67% | .112 | <0.00 |
*Standardized differences were assessed using weights generated from the propensity score model. A St. Diff. > 0.10 is considered a significant difference between groups. ACEi = angiotensin-converting enzyme inhibitors; ARB = angiotensin receptor blockers; IPTW = inverse probability of treatment weight.; 3MSE = Modified Mini-Mental State Examiniation; SD = standard devision; SPPB = short physical performance battery; St. Diff. = standardized differences.
MMD, persistent MMD, and injurious falls were assessed in proportional hazards regression models stratified by clinical site with hazard ratios (HRs) and 95% confidence intervals (CIs) reported. The proportional hazard assumption was confirmed using Schoenfeld residual plots. Several models were estimated either with the intervention and medications as individual covariates or with an interaction effect between intervention and medications. Fully adjusted models included baseline characteristics, the number of other antihypertensive medications, and baseline SPPB score. IPTW-weighted models were separately estimated for both PA and HE intervention arms and in an overall model. Post hoc sensitivity analyses evaluated sex- and race-stratified models given baseline differences in sex and race between ACEi and ARB users as well as an evaluation of the recorded cause of failure for the 400 m walk test between the two medication groups.
SPPB and gait speed were also assessed using analysis of covariance. Similarly, each was first evaluated for the overall cohort by intervention arm and ACEi/ARB use, by the interaction between the intervention and medication variables, and when fully adjusted for other baseline characteristics. IPTW was then used to directly compare ACEi and ARB users in separate weighted analysis of covariance models for each intervention arm. Results from the unadjusted and IPTW-adjusted models were reported. All analyses were performed using SAS Enterprise Guide, version 7.1 (SAS Institute, Cary, NC).
Results
Of 1,635 participants in the LIFE study, 796 used ACEi (496, 62.3%) or ARBs (300, 37.7%). Table 1 demonstrates that ACEi and ARB user groups were comparable in most baseline characteristics with slightly higher body mass index in ARB users, a higher proportion of female ARB users compared with ACEi (79.7% vs. 56.7%), and a higher proportion of blacks treated with ARBs (27.0% vs. 15.5%). Other metrics of baseline physical and mental functioning were similarly distributed. With IPTW applied, the cohort was balanced with all SDs less than or equal to 0.10.
Numbers of events and follow-up times are reported in Table 2. Crude event rates were not significantly different between ACEi and ARB users. Table 3 presents the results of the proportional hazard regression models. Results for the PA versus HE intervention were consistent with prior studies in the full LIFE cohort showing a protective benefit of PA interventions for MMD (19). For the PA versus HE comparison using an interaction term for medication use, results for PA versus HE were consistent between ACEis and ARBs, which showed a lack of an interaction effect for the medications. For the direct comparison of ARB versus ACEi, there was a consistent protective trend for ARBs versus ACEi (Table 3). In IPTW-adjusted models, there was a 28% lower rate of MMD for ARB users versus ACEi users (HR = 0.72 [0.60–0.85]) and 35% lower rate of persistent MMD (HR = 0.65 [0.52–0.82]), which did not differ by PA intervention group within or between medication user groups. Risk of injurious falls was not significantly different when compared between ARB versus ACEi users (Table 3). Reasons for failure during the 400 m walk test revealed no differences between ACEi and ARB users in shortness of breath, fainting, fatigue, leg weakness, or other reasons for failure. Given an observed higher proportion of females and blacks in the ARB group, an exploratory analysis was conducted but found no differences when models were stratified by sex and race.
Number of Events, Person-Years, and Event Rates for Major Mobility Disability and Injurious Falls by Medication Use and Intervention Arm
| Outcome | Physical activity | Health education | ||||
|---|---|---|---|---|---|---|
| Events, N (%) | Person-years (PY) | Events/100 PY | Events, N (%) | Person-Years (PY) | Events/100 PY | |
| MMDa | ||||||
| ACEi | 81 (32.5) | 533.02 | 15.2 | 98 (40.3) | 498.83 | 19.7 |
| ARB | 37 (26.1) | 327.73 | 11.3 | 56 (35.9) | 354.92 | 15.8 |
| Persistent MMDa | ||||||
| ACEi | 42 (16.9) | 547.62 | 7.7 | 66 (27.2) | 521.00 | 12.7 |
| ARB | 16 (11.3) | 336.22 | 4.8 | 34 (21.8) | 368.65 | 9.2 |
| Injurious fallsa | ||||||
| ACEi | 31 (12.4) | 646.35 | 4.8 | 30 (12.3) | 605.79 | 5.0 |
| ARB | 15 (10.6) | 336.77 | 4.5 | 18 (11.5) | 384.07 | 4.7 |
Note: ACEi = angiotensin-converting enzyme inhibitors; ARB = angiotensin receptor blockers; MMD = major mobility disability.
aAll rate comparisons were nonsignificant between ACEi and ARB groups (p > .05).
Regression-Adjusted and Inverse Probability of Treatment Weight (IPTW) Adjusted Cox Proportional Hazard Regression Results for Incident and Persistent Major Mobility Disability (MMD) and Injurious Falls
| MMD | Persistent MMD | Injurious falls | |
|---|---|---|---|
| HR (95% CI) | HR (95% CI) | HR (95% CI) | |
| Individual intervention and exposure regression terms. Controlled for all baseline characteristics | |||
| PA versus HE intervention | 0.74 (0.58–0.95) | 0.58 (0.42–0.81) | 0.75 (0.49–1.16) |
| ARB versus ACEi | 0.80 (0.61–1.04) | 0.73 (0.51–1.04) | 1.06 (0.66–1.70) |
| Trial intervention versus control stratified by medication use. Controlled for all baseline characteristics | |||
| PA versus HE (ACEi users only) | 0.79 (0.58–1.07) | 0.64 (0.43–0.95) | 0.70 (0.41–1.19) |
| PA versus HE (ARB users only) | 0.67 (0.44–1.02) | 0.48 (0.26–0.87) | 0.87 (0.42–1.79) |
| IPTW-adjusted models | |||
| Direct medication group comparison—pooled analytic cohort | |||
| ARB versus ACEi | 0.72 (0.60–0.85) | 0.65 (0.52–0.82) | 1.05 (0.78–1.41) |
Note: p-value for interaction between intervention and medications was not significant in all models. Medication comparisons were similar magnitude for PA and HE interventions when analyzed separately in IPTW models. Post hoc power calculations for pooled survival analysis: MMD (0.94); persistent MMD (0.96); and falls (0.81). ACEi = angiotensin-converting enzyme inhibitors; ARB = angiotensin receptor blockers; HR = hazard ratio; MMD = major mobility disability; 95% CI = 95% confidence interval.
SPPB scores and 400 m gait speed were similar at baseline for all groups and diverged during follow-up periods (Figure 1). In IPTW-adjusted analyses of covariance, the PA intervention was associated with higher SPPB scores and faster gait speed throughout follow-up (p < .001) irrespective of medication use. ACEi and ARB use alone was not associated with SPPB or gait speed and the interaction between medication use and the intervention was also not significant in unadjusted and adjusted models for these outcomes.
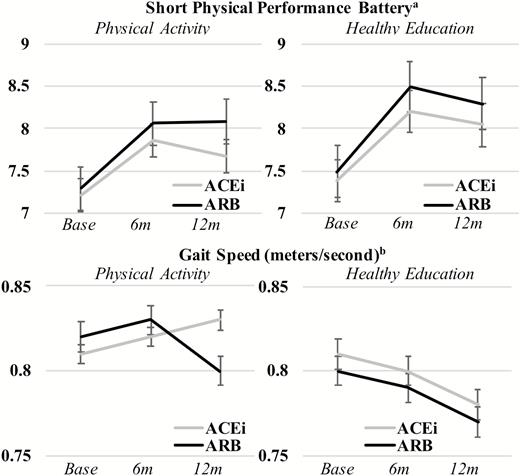
Graph of baseline, 6 and 12 months follow-up short physical performance battery (SPPB) and gait speed measures testing the effect of the trial intervention, treatment, and the interaction of intervention and treatment. aShort physical performance batter (SPPB) range from 0 to 12 points.
bGait speed measured during 400 m walk test or proxy measures.
Note: Follow-up occurred at baseline visit, 6 months (6 m) and 12 months (12 m). Panels A/B: SPPB score by intervention arm and by treatment (unadjusted): Treatment × intervention (p = .298); treatment only (p = .478); intervention only (p = .002). Panels A/B: SPPB score by intervention arm and by treatment (IPTW-adjusted): Treatment × intervention (p = .443); treatment only (p = .541); intervention only (p = .012). Panels C/D: gait speed by intervention arm and by treatment (unadjusted): Treatment × intervention (p = .140); treatment only (p = .376); intervention only (p < .001). Panels C/D: gait speed by intervention arm and by treatment (unadjusted): Treatment × intervention (p = .244); treatment only (p = .179); intervention only (p < .001). All analyses conducted using analysis of covariance repeated measures.
Discussion
Overall, we observed a lower rate of MMD (28% reduction) and persistent MMD (35% reduction) in participants using ARBs than those using ACEis, which remained after adjustment for baseline factors utilizing IPTW balancing techniques. The interaction terms between medication groups and intervention arms were nonsignificant for MMD outcomes, which suggest the observed associations were not mediated through synergism with the PA intervention as hypothesized but are independent effects that may be attributed to several hypothesized physiological pathways.
ACEis and ARBs are first-line treatment options for hypertension, prevention of cardiovascular disease, and renoprotection with mechanisms of action along the renin–angiotensin system. Recent evidence suggests that ACEis may have secondary effects on physical functioning (2,5), possibly due to reductions in chronic, low-grade inflammation, which impairs muscle function and is an independent risk factor for disability and mobility impairment (29). ARBs may have similar reductive effects on inflammatory markers but with better tolerability and safety; thus, investigation of the relative effects between these two interchangeable drug classes could have implications for prescribing in older adults common indications. Compared with other outcomes measured, the 400 m walk test may capture a more sustained, aerobic activity and was the only outcome with significant findings for the direct comparison of ARBs to ACEis. This difference in protection against MMD, but not other measures, could be attributed to evidence that ARBs may be uniquely neuroprotective in addition to other effects due to activation of proliferator-activated receptor-gamma or effects on aerobic activity and endurance through pathways not yet identified (16–18).
ACEis and ARBs have both been postulated as therapeutic options for preventing sarcopenia, protecting functional status, and delaying age-related cognitive decline (4,29). To the best of our knowledge, this is the first study to directly compare associations between ARBs and ACEis on the risk of MMD and physical functioning outcomes. In the LIFE trial and other studies, ACEis have been shown to be protective for mobility-related outcomes in older adults (2,5,29). Thus, relative findings for ARBs protecting against MMD results should be interpreted to be an effect beyond that already observed for ACEi, that is, both ACEis and ARBs should be considered as potentially protective with differential effects and pathways. Similar to prior analyses, both medication groups did not demonstrate a significant interaction with the PA intervention, suggesting that these benefits can be realized without further intervention.
The analytical approach in this study differed from prior studies that examined the associations of antihypertensive medications versus non-users as the current design should help mitigate indication bias or healthy user effects, which could account for reasons participants used one medication over the other or no medications at all (2,5). These common biases are greatly reduced when two interchangeable medications are compared; however, the potential for residual confounding persists. Notable differences were observed at baseline including black race and female sex, which are known channeling factors to ARBs given higher incidence of adverse effects of ACEi in these groups. However, race- and sex-stratified post hoc sensitivity analyses did not differ from the primary analyses.
The findings from this analysis showing ARBs may have added value in preventing mobility disability in an older population may help guide strategic prescribing decisions for older adults, especially those at risk for mobility, disability, and loss of physical independence. In practice, ARBs could be preferentially selected over ACEis for the treatment of hypertension, cardiovascular disease, or diabetes in older adults given these secondary benefits or be used independently to help preserve mobility. Further exploration of mechanistic pathways leading to the preservation of mobility unique to ARBs is needed to explain the observations in this study.
Limitations
This study was a post hoc subgroup analysis of the LIFE trial, which was not powered to detect the influence of medications on outcomes. Overall estimates of the PA versus HE intervention were consistent with the original trial for these subgroups of patients using either ACEis or ARBs. More modest effects of medication influence on these outcomes may not be detectable using these data; however, we did observe statistical differences for the primary MMD and persistent MMD outcomes. Post hoc power calculations for the survival analysis showed power of more than 0.80 for all outcomes when accounting for follow-up and accrual time. Participants were not randomly assigned ACEi and ARB treatment and it is commonly known that observational comparisons between medications are subject to indication bias. However, by comparing medications that are therapeutically interchangeable, this bias is reduced. In addition, most baseline measures were similar between users of these medications and robust IPTW adjustment techniques were used to further balance these measured confounders. Medication use was measured only at baseline and at 12 months follow-up for LIFE participants and we used this information to determine exposure or discontinuation of treatment. This could lead to exposure misclassification if patient adherence to medications is poor or if patients discontinued medications before the 12 months follow-up visits. Additional studies with more detailed medication use profiles are needed to assess this limitation. MMD and injurious falls are not all-encompassing outcome measures for disability and injury; however, these were primary and secondary outcomes in the LIFE trial and were objectively measured. Additional effects of both ACEi and ARBs on different measures of mobility, disability, and injury are needed to fully understand medication effects. The LIFE study cohort is representative of a sedentary older adult population with existing physical limitations. ACEis and ARBs are also indicated for the treatment of hypertension, secondary prevention of cardiovascular diseases, and in diabetes. These findings may not generalize to the overall older adult population such as those who are immobile or who have no physical limitations at baseline or with no indications for treatment with ACEis or ARBs. The results of this study should be considered hypothesis generating and not as confirmative as additional studies are needed to confirm these effects as well as to elucidate mechanistic pathways.
Conclusions
In this secondary analysis of the LIFE cohort, ARBs users were associated with lower risk of incident MMD and persistent MMD outcomes compared to ACEi users, but these effects were not observed with other physical functioning measures or injurious falls. This study provides the first direct comparison of ARBs versus ACEi on mobility disability and suggests that, while both medications are known for their benefits on aging-related physical and cognitive decline, ARBs may have additional benefits. Given these medication groups are generally as therapeutic alternatives, ARBs could be strategically prescribed to older adults with therapeutic indications to reduce the risk of aging-related mobility disability in addition to their primary use. Evidence from randomized controlled trials are needed to validate these findings and to provide further evidence for using these medication classes as primary therapy options for aging-related disorders.
Funding
This work received no direct funding. J.B. is funded by a Claude D. Pepper Older American Independence Centers Junior Scholar Award from the University of Florida Institute on Aging through support from the National Institute on Aging at the National Institutes of Health (P30AG028740). S.S. receives research funding from the National Heart, Lung, and Blood Institute at the National Institutes of Health (K01 HL138172). T.G. is the recipient of an Academic Leadership Award (K07AG043587) from the National Institute on Aging at the National Institutes of Health and is supported by the Yale Claude D. Pepper Older Americans Independence Center (P30AG21342). T.B. was partially supported by National Institutes of Health grant R01AG056769. The LIFE study was funded by National Institutes of Health grant UO1AG22376 and partially supported by the Claude D. Pepper Older Americans Independence Centers at the University of Florida (1 P30 AG028740), Wake Forest University (1 P30 AG21332), Tufts University (1P30AG031679), University of Pittsburgh (P30AG024827), and Yale University (P30AG021342) and the National Institutes of Health CTSA at Stanford University (UL1 RR025744), at University of Florida (U54RR025208) and at Yale University (UL1 TR000142). Tufts University was also supported by the Boston Rehabilitation Outcomes Center (1R24HD065688-01A1). Dr. Gill is the recipient of an Academic Leadership Award (K07AG043587) from the National Institute on Aging at the National Institutes of Health.
Conflicts of interest
None.
Acknowledgments
These results were presented as a poster during the Gerontological Society of America’s 70th Annual Scientific Meeting, Boston, Massachusetts, November 14–18, 2018.

