


Abstract
Growing evidence suggests bidirectional links between gut microbiota and sleep quality as shared contributors to health. Little is known about the relationship between microbiota and sleep among older persons.
We used 16S rRNA sequencing to characterize stool microbiota among men (n = 606, mean [standard deviation] age = 83.9 [3.8]) enrolled in the Osteoporotic Fractures in Men (MrOS) study from 2014 to 2016. Sleep was assessed concurrently by a questionnaire (Pittsburgh Sleep Quality index [PSQI]), and activity monitor to examine timing (acrophase) and regularity of patterns (F-statistic). Alpha diversity was measured using Faith’s phylogenetic diversity (PD). Beta diversity was calculated with robust Aitchison distance with matrix completion (RPCA) and phylogenetic-RPCA (PRPCA). Their association with sleep variables was tested with partial distance-based redundancy analysis (dbRDA). Predictive-ratio biomarkers associated with sleep measurements were identified with CoDaCoRe.
In unadjusted analyses, men with poor sleep (PSQI >5) tended to have lower alpha diversity compared to men with normal sleep (Faith’s PD, beta = −0.15; 95% confidence interval [CI]: −0.30 to 0.01, p = .06). Sleep regularity was significantly associated with RPCA and PRPCA, even after adjusting for site, batch, age, ethnicity, body mass index, diabetes, antidepressant and sleep medication use, and health behaviors (RPCA/PRPCA dbRDA; p = .033/.002). In taxonomic analysis, ratios of 7:6 bacteria for better regularity (p = .0004) and 4:7 for worse self-reported sleep (p = .005) were differentially abundant: some butyrate-producing bacteria were associated with better sleep characteristics.
Subjective and objective indicators of sleep quality suggest that older men with better sleep patterns are more likely to harbor butyrate-producing bacteria associated with better health.
Abundant evidence suggests that adequate sleep health is an important aspect of healthy aging. Without it, persons are at increased risk for a multitude of adverse health outcomes including cardiometabolic disorders, systemic inflammation, and all-cause mortality (1). Although adult humans spend about a third of their life sleeping, our understanding of its underlying physiologic basis is not completely understood. However, it is known that disrupted sleep and circadian misalignment are associated with metabolic dysregulation, and some hypothesize that the influence of sleep on metabolic health may be mediated by the gut–brain axis.
A growing number of animal and human studies implicate a bidirectional relationship between sleep and the gut microbiome (2). For example, younger and middle-aged adults with insomnia have been reported to have decreased microbiome richness and diversity with a reduction in short-chain fatty acid (SCFA)-producing bacteria (3). In addition, circadian rhythms have gained attention as being important in regulating metabolism, and both humans and microbes contain clock genes that are important in synchronizing sleep–wake cycles (4). Theoretically, if it can be shown that the gut microbiota and its metabolites influence sleep health, altering intestinal bacterial composition and/or capitalizing on their relevant metabolites could potentially treat sleep disorders.
Sleep comprises multiple dimensions including duration, timing, regularity, continuity, and quality; yet previous studies in humans investigating sleep and the gut microbiome have focused on either self-reported or a single aspect of sleep, such as the effects of short-term sleep restriction on microbial composition (5,6). In addition, although anywhere from 36% to 69% of older adults report sleep disturbances (7), few studies have included older adults, especially those over the age of 75. With increases in life expectancy now beyond 75, there is a considerable need to better understand how sleep health may impact later life span. With advancing age, there is an increasing risk of disease, disability, and dementia, all of which may be impacted by poor sleep. There are biologically plausible reasons why sleep and the gut microbiome might be integrally related, but few have tested this hypothesis. Therefore, we studied 606 older men from the Osteoporotic Fractures in Men (MrOS, https://mrosonline.ucsf.edu/) study, to determine whether both subjective (self-reported) and objective measures of sleep (including timing and regularity assessed via activity monitor) were associated with within-person (alpha) and between-person (beta) gut microbial diversity as well as differential bacterial abundance. We hypothesized that (1) individuals with worse sleep quality scores would have lower alpha diversity; (2) have an overall distinctly different microbiome composition compared to those with higher sleep quality; and (3) sleep quality measures would be significantly correlated with the relative abundance of microbes previously associated with a healthy gut environment.
Method
Study Participants
Originating in 2000–2002, MrOS included 5 994 men aged 65 years and older from 6 U.S. clinical sites (University of Alabama at Birmingham, Birmingham, AL; University of Minnesota, Minneapolis, MN; Stanford University, Palo Alto, CA; University of Pittsburgh, Pittsburgh, PA; Oregon Health and Science University, Portland, OR; and University of California, San Diego, San Diego, CA), with continued follow-up involving 4 full in-clinic examinations through 2016 with 1 841 ongoing participants attending Visit 4 (2014–2016). The study design and recruitment have been previously described (8). Starting in March 2015, men who attended Visit 4 were also invited to provide stool specimens; 982 men provided a stool sample of which 919 were viable samples (Batch 1 = 599, Batch 2 = 320) with 16S rRNA gene amplicon reads (16S) passing quality control (9). Because of the strong effect of recent antibiotic use on the gut microbiome and evidence that some antibiotics can affect sleep (10), we excluded men who reported antibiotic use in the past month (n = 46). For this study, 606 men who had both Visit 4 sleep data and sufficient sequencing data that passed quality filtering steps were included (Figure 1). The institutional review boards of the 6 participating institutions approved the study protocol, and a written informed consent was obtained from all participants.
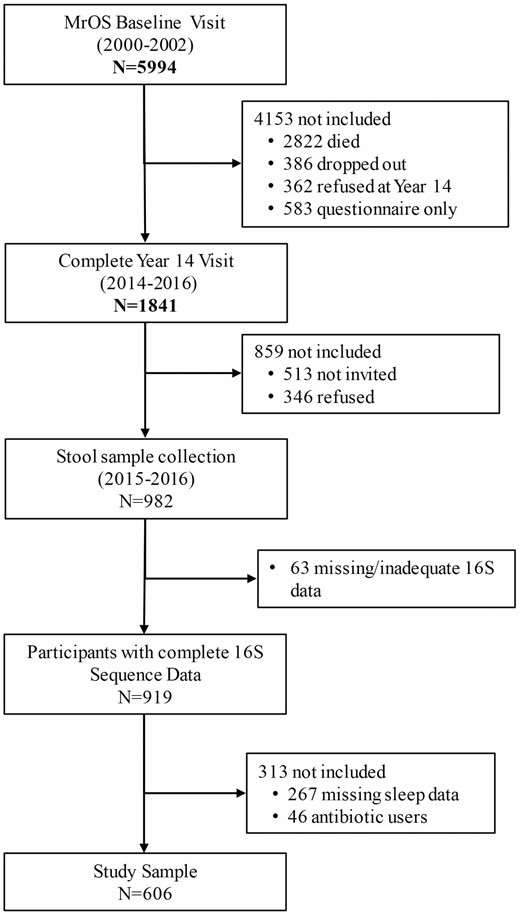
Study flow diagram.
Sleep Measurements
For the objective sleep measures, SenseWear armband devices (Bodymedia Inc., Pittsburgh PA) were worn on the upper right arm for 1 week (participants were asked to remove the device only when bathing); this study included those with 90% wear time for at least five 24-hour periods. Minute-by-minute activity data were processed to calculate 2 circadian rhythm variables based on the extended cosine model: (1) acrophase and (2) pseudo F-statistic. The acrophase measure captures the timing of the peak activity in the 24-hour cycle, and the pseudo F-statistic is a measure of robustness and rhythmicity, or consistency of the rhythm (e.g., regularity) and is calculated by goodness of fit to an extended cosine model based on 24-hour patterns (11). These 2 objective measures were chosen due to acceptable correlations with wrist actigraphy variables assessed in a subset of MrOS men (n = 57) who wore both the gold-standard wrist actigraph and armband device (acrophase 0.83; F-statistic 0.92; unpublished data). While the MrOS Study participants had wrist actigraphy measures for sleep assessed at previous study visits (2003–2005 and 2009–2012), the armband measures were the only objective sleep measures that were available at that same visit as when the stool was collected (2014–2016) and thus were used for the purposes of this study. Subjective sleep measurements, assessed between 2014 and 2016, such as quality of sleep and total sleep time (hours), were obtained based on self-reported Pittsburgh Quality Sleep Questionnaire (12).
Covariates
A list of covariates to include in our statistical models was selected a priori. Prior to data analysis, a discussion was held with the coauthors that included experts from a variety of fields including sleep, gerontology, internal medicine, microbiome, and biostatistics. We took into account the availability and completeness of data, variables known to significantly affect the microbiome, relevance to our overall aim, technical variables, and from a statistical perspective, the collinearity of variables as well as the maximum number of variables to include without compromising statistical power. A consensus was reached to include 10 covariates: sequencing batch, study site, age at visit, ethnicity, body mass index (BMI) (kg/m2) from the previous visit, alcohol intake, self-reported physical activity (assessed via the Physical Activity Scale for the Elderly), diabetes, and medication use (specifically antidepressants and benzodiazepines).
Stool Collection, DNA Extraction, and 16S rRNA Gene Amplicon Sequencing
MrOS participants collected fecal samples for microbiome analysis at home using the OMNIgene-GUT stool/feces collection kit (OMR-200, DNA Genotek, Ottawa, Canada), and 16S rRNA gene amplicon sequencing was performed in 982 men. Details of the stool collection protocol and sequencing have been previously published (13). Briefly, fecal DNA was extracted on the Hamilton STARlet platform using the MoBio PowerMag Soil DNA extraction kit following the manufacturer’s recommendations. The V4 hypervariable region of the 16S bacterial rRNA gene was amplified using the 515F and 806R primers and sequenced on an Illumina MiSeq with 2 × 250 cycles according to manufacturer’s protocols (14).
Bioinformatics
Raw sequences were uploaded to Qiita (15) and processed using its recommended pipeline (https://qitta.ucsd.edu/workflows) for 16S data. Briefly, sequences were demultiplexed, trimmed to 150 nucleotides, and microbial amplicon sequence variants (ASVs) were produced using the Deblur algorithm with the default parameters on Qiita (16). A phylogenetic tree was constructed using a SATé-enabled phylogenetic placement technique as implemented in the q2-fragment-insertion (17) plugin with the Greengenes reference database (version 13.8) (18) as the backbone tree. The resulting ASV table and phylogenetic tree were imported into QIIME 2 (version 2020.6) (19) for additional processing. Taxonomic classification was carried out using the q2-feature-classifier plugin (20). The classifier was trained on the GTDB database(release 89) (21) after extracting the specific V4 region covered by the primers. To improve classification accuracy, human stool-specific taxonomic abundance information was acquired from the readytowear taxonomic weights repository (https://github.com/BenKaehler/readytowear) and added to the training step of the classifier. This weighted bespoke taxonomic approach improves classification accuracy over the common Naive Bayes classification methods (22). Any ASVs that were not successfully classified to at least the Phyla level were removed.
To calculate within-sample diversity (alpha diversity), the ASV table was normalized using the scaling with ranked subsampling (SRS) application (23) with a fixed depth of 5 963 counts. The SRS normalization approach better preserves the original community structure of samples while addressing unequal sampling depth bias. From this table, we calculated ASV richness, Shannon diversity, Pielou’s evenness, and Faith’s phylogenetic diversity (PD) for downstream analysis.
To measure between-sample (beta) diversity, the robust Aitchison distance with matrix completion (RPCA) (24), its phylogenetic-based counterpart, PRPCA (25), and the presence/absence unweighted UniFrac (26) distances were calculated. The non-normalized ASV table was used to calculate RPCA and PRPCA as these tools are compositionally aware and do not require rarefying/normalization; however, for unweighted UniFrac distance calculation, the SRS-normalized table was used.
To identify key microbes associated with sleep variables of interest, we used multiple differential abundance (DA) approaches. Numerous tools exist that differently address complexities of microbiome data such as compositionality, sparsity, and uneven sampling depth. These DA approaches have been shown to vastly differ in identifying significant taxa, depending on the underlying structure of the data (27). Given the lack of an a priori list of microbes to specifically test, we planned to conduct this analysis in an exploratory manner by utilizing multiple approaches as sensitivity analyses and to cross-validate the results. For all DA approaches, we first filtered our non-normalized table to remove any ASVs that did not appear in at least 25% of our samples or did not have a total of 600 counts across all samples. We first attempted to estimate and sort the differential ranks using songbird’s (28) multinomial model, which we then visualized using qurro (29). While we saw no improvements in model performance, as assessed by pseudo-Q2 (a value analogous to R2 in linear regression), when our adjusted model was compared to an intercept-only model, the resulting ranks were still used to manually explore and select potentially interesting sets of ASV log-ratios (also referred to as balances). We next used a learning algorithm to automatically select important balances most associated with sleep variables using the Compositional Data via Continuous Relaxations (CoDaCoRe) package (30). Finally, ASV abundance data were projected onto distance-based redundancy analysis (dbRDA) models using the vegan package’s sppscores() function: this produces species scores corresponding to the relationship between each taxon and a response variable within the constrained ordination space.
Statistical Approach
To test the association between sleep variables and alpha diversity measures, we regressed alpha diversity measures on sleep measures and covariates, and we tested the sleep measures using a type II ANOVA test as implemented in the car package. For each sleep measure, we fit 3 models: an unadjusted model, a base model (adjusted for age, race, site, and sequence batch), and a full model (adjusted for base-model variables plus BMI, diabetes, alcohol intake, physical activity score, depression medications, and benzodiazepine use).
For beta diversity, we used a similar set up as described for alpha diversity. We first performed a series of covariate-adjusted PERMANOVA tests using the vegan package’s adonis2() function, with the microbiota distance matrices as our response variable and the various model sets (i.e., unadjusted, base, or full-model variables) as our explanatory terms. The PERMANOVA test’s assumption of similar multivariate dispersion was assessed using the betadisper() function; as this test only operates on factorial variables, we used the quartile-transformed version of our continuous sleep variables.
PERMANOVA tests of covariates suggested that certain base-model covariates (such as site, batch, and race) were associated with beta diversity and may confound associations with sleep variables. To remove the influence of these covariates, we additionally performed a partial dbRDA using our full-model variables while removing the effects of the base-model covariates. When the overall main effects were statistically significant, as determined by an ANOVA-like permutation test using the anova.cca() function, a sequence of terms as well as marginal test was carried out.
All statistical analyses were conducted using R statistical software 4.2 (31). Significance was defined as p < .05 or 95% confidence intervals (CIs) excluding the null.
Results
The 606 men included in the analysis had a mean age of 84 years (standard deviation [SD] = 3.78), an average BMI of 27 kg/m2 (SD = 3.53) and were overall very physically active (Table 1). Consistent with other observational sleep studies, 40% of men had poor sleep (defined as a PSQI > 5) and 24.2% reported taking sleep medications during the past month.
Characteristics of 606 MrOS Participants
| Characteristic | Mean (SD), n (%), or Ratio |
|---|---|
| Age, y | 83.9 (3.8) |
| Body mass index (kg/m2) | 27.2 (3.4) |
| Diabetes (no:yes) | 549:103 |
| Race/ethnicity: | |
| White | 545 (89.9 %) |
| Black | 20 (3.3 %) |
| Asian | 22 (3.6 %) |
| Hispanic | 9 (1.5 %) |
| Other race/ethnicity | 10 (1.6 %) |
| Alcohol consumption (drinks/wk): | |
| Non-drinker | 238 (39.3 %) |
| <1 | 69 (11.4 %) |
| 1–2 | 68 (11.2 %) |
| 3–5 | 92 (15.2 %) |
| 6–13 | 111 (18.3 %) |
| 14+ | 26 (4.3 %) |
| Physical activity score | 125.5 (65.3) |
| Antidepressant use (no:yes) | 554:52 |
| Benzodiazepine use (no:yes) | 592:14 |
| Sleep quality (range: 0–21) | 5.2 (3.0) |
| Activity acrophase | 13.2 (1.6) |
| Sleep regularity (pseudo-F-statistic) | 951.1 (476.0) |
| Alpha diversity: | |
| Richness | 213.9 (71.8) |
| Shannon Diversity Index | 5.07 (0.8) |
| Evenness | 0.66 (0.074) |
| Faith’s phylogenetic diversity | 19.9 (5.7) |
Sleep Measures and Alpha Diversity
Worse subjective sleep quality in participants was marginally associated with lower alpha diversity, as measured by Faith’s PD (beta = −0.15; 95% CI = −0.30, 0.01; p = .06; Figure 2). The findings lost further significance after adjustment for covariates (beta = −0.07; 95% CI = −0.23, 0.09; p = 0.39). No other measures of alpha diversity including ASV richness, Pielou’s evenness, or Shannon’s diversity were significantly associated with sleep quality (p > .05). Additionally, there were no significant associations between objectively measured sleep and any measure of alpha diversity (p > .05).
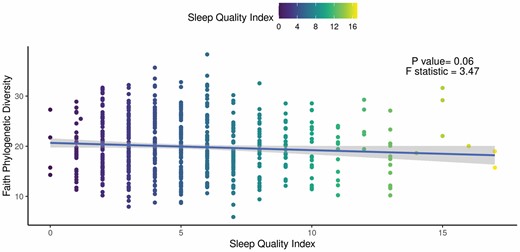
Faith phylogenetic diversity (PD) is associated with sleep quality. Results of the unadjusted regression model show a weak but significant association between (beta = −0.15; 95% CI: −0.30, 0.01; p = .06). Faith PD and Pittsburgh Sleep Quality index (PSQI). The solid line and shaded area correspond to the regression line and 95% CI, respectively.
Sleep Measures and Βeta Diversity
In all beta diversity results (PERMANOVA and dbRDA), there was a limited ability to predict beta diversity based on taxa presence versus taxa abundance as shown by compositionally aware RPCA and PRPCA distances having higher predictive power than unweighted UniFrac as assessed by the global model’s R2 and pseudo F test-statistic (Supplementary Material 1). In the unadjusted models, sleep regularity was significantly associated with PRPCA (p < .008, R2 = 0.9%, F = 5.43) and remained so after adjustment for base-model covariates (p < .007 R2 = 0.8%), but not in the fully adjusted model (p = .19, R2 = 0.3%). Similarly, sleep regularity was also weakly associated with beta diversity measured by RPCA (p = .088, R2 = 0.4%) in the unadjusted model, and remained significant after adjusting for base-model covariates (p = .02, R2 = 0.7%), but not after adjusting for the full-model covariates. Tests of our base-model covariates also identified collection site and race as significant variables in both RPCA and PRPCA models. No sleep variables were associated with any of the beta diversity distances in fully adjusted models. However, the full model with the highest explanatory power was sleep regularity explaining PRPCA diversity. Tests of covariates in this model identified race, BMI, history of diabetes, physical activity score, and medication for depression as significant variables with modest explanatory power. Given that these signals are more robust than the association with sleep regularity itself, we attempted to isolate this signal by removing the effect of the base-model covariates using a partial dbRDA.
The dbRDA models with only the base-model covariates were significantly associated with all 3 beta diversity distances. Among these, the base models best explained variation in RPCA (p < .001, adj.R2 = 4.5%). We then constructed partial dbRDA models that included sleep regularity, full set of variables, but partialled out (removed) the effect of base-model variables. The results of the global models for all 3 distance matrices were statistically significant, with RPCA having the highest explanatory power (p < .001, adj.R2 = 4.4%). In the follow-up sequential ANOVA-like permutation tests (Table 2), sleep regularity was statistically significant when positioned as the first variable in the model (RPCA, p < .03, F = 4.7, R2 = 0.8%), although other covariables had higher explanatory power than sleep regularity. In the marginal tests (Table 2), sleep regularity and alcohol intake were the only nonsignificant terms, suggesting that other stronger signals overlap with sleep regularity’s signal.
Results summary of partial dbRDA based on RPCA distance
| Term | df | Sequence of Terms Results | Marginal Test Results | ||||
|---|---|---|---|---|---|---|---|
| Variance | Test Statistic | p Value | Variance | Test statistic | p Value | ||
| Sleep regularity | 1 | 0.008 | 4.67 | .031 | 0.001 | 0.603 | .461 |
| BMI | 1 | 0.01 | 6.28 | .018 | 0.008 | 4.959 | .031 |
| Diabetes | 1 | 0.013 | 7.66 | .006 | 0.012 | 6.962 | .006 |
| Alcohol intake | 5 | 0.009 | 1.08 | .382 | 0.008 | 0.9 | .511 |
| Physical activity score | 1 | 0.009 | 5.36 | .019 | 0.007 | 4.01 | .037 |
| Medication for depression | 1 | 0.014 | 8.1 | .005 | 0.012 | 7.32 | .008 |
| Use of benzodiazepines | 1 | 0.002 | 1.13 | .268 | 0.002 | 1.127 | .268 |
Notes: We carried a partial dbRDA using RPCA distances using all variables from the full model. The effect of batch, site, age, and race were “partialled” out (i.e., removed) using the Condition() parameter. The order of the terms in the table correspond to the order in which they were included in the model formula. dbRDA = distance-based redundancy analysis; RPCA = robust Aitchison distance with matrix completion.
Sleep Measures and Specific Taxa
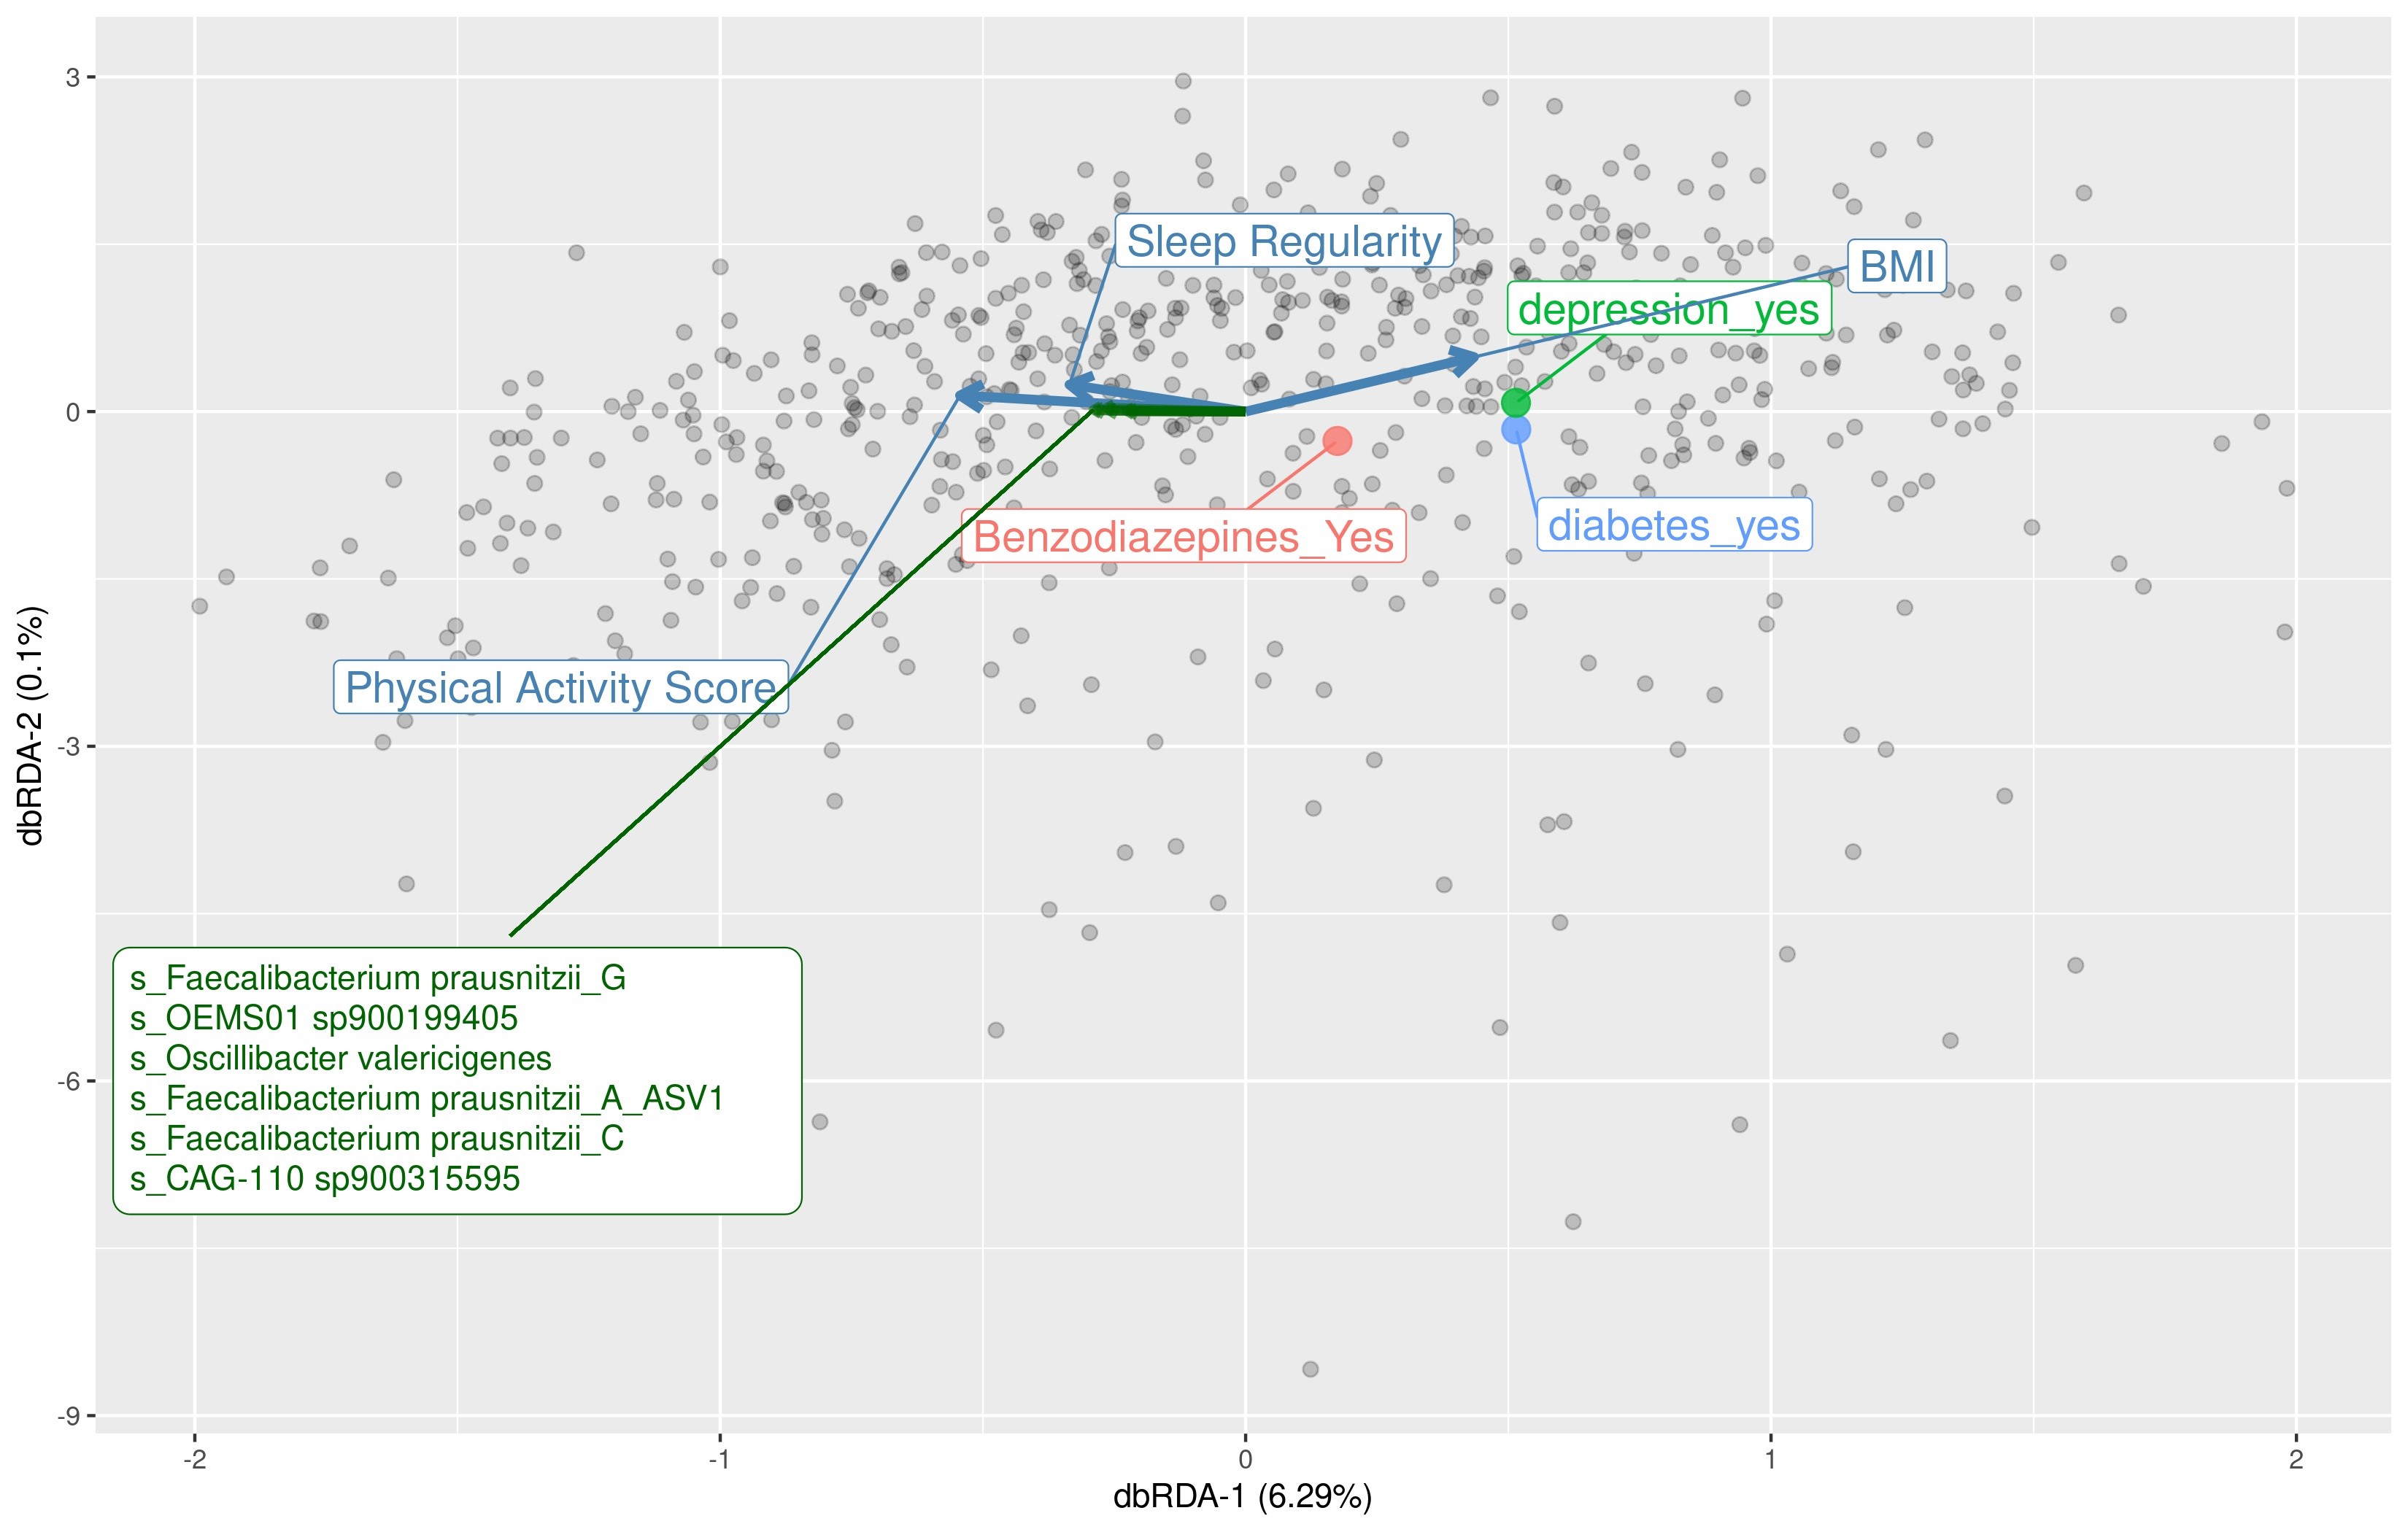
We aimed to identify significant ASVs that were associated with sleep measures using different statistical methods. Initial ASV selection was attempted using a multinomial model (songbird) but we were unable to construct models with informative rankings. CoDaCoRe’s learning algorithm, however, selected 5 ASV balances that had the strongest correlation with sleep regularity. Of these, the top 2 balances were significantly associated with sleep regularity after adjusting for full variables, as assessed by a marginal ANOVA test (Balance 1: beta = 0.493; 95% CI: 0.221, 0.71; p < .001; Balance 2: beta = 0.380; 95% CI: 0.113, 0.648; p =.005). Balance 1 (Figure 3) contained 13 ASVs and was defined by the log relative abundance of 7 ASVs (classified as Faecalibacterium prausnitzii G, 2 Prevotella copri A ASVs, Bacteroides B vulgatus, Bacteroides B dorei, Alistipes onderdonkii, and Ruminococcus D bicirculans) versus the relative abundance of 6 ASVs (classified as Akkermansia muciniphila, Bacteroides caccae, Bacteroides faecichinchillae, Bacteroides fragilis, Buttiauxella agrestis, and Ruminiclostridium E siraeum). Balance 2 contained 11 ASVs, 10 of which overlapped with Balance 1. The log ratio for Balance 1 and 2 was associated with better sleep regularity scores after adjustment for covariates. The algorithm also predicted a single balance that would significantly predict sleep quality (Figure 4). This balance was significantly associated with sleep quality (beta = 0.38, 95% CI: 0.11–0.65; p < .05) and consisted of the ratio of 4 ASVs (classified as Ruthenibacterium lactatiformans, Bacteroides uniformis, Alistipes putredinis, and Escherichia dysenteriae) to 7 ASVs (classified as F. prausnitzii_G, 2 ASVs of P. copri_A, Bacteroides_B vulgatus, B. agrestis, Ruminococcus_D bicirculans, and Oscillibacter valericigenes). The ratio of these taxa was associated with higher PSQI sleep scores indicating worse sleep quality. On the dbRDA triplot (Supplementary Figure 1), the top 5 ASVs positively associated with sleep regularity were F. prausnitzii G, OEMS01 sp0900199405, O. valericigenes, F. prausnitzii A, and F. prausnitzii C.
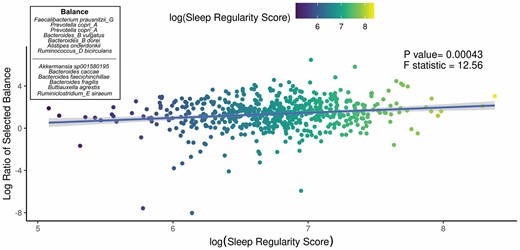
Top predicted ASV log ratio is correlated with sleep regularity. The results of the linear regression model shows the top CoDaCoRe selected balance is significantly associated (beta = 0.493; 95% CI: 0.221, 0.71; p < .001) with objective sleep regularity score, even after adjustment for all variables from the full model. The solid line and adjacent shaded area correspond to regression line and 95% CIs, respectively. The numerator consists of 7 ASVs classified as Faecalibacterium prausnitzii G, 2 Prevotella copri A ASVs, Bacteroides B vulgatus, Bacteroides B dorei, Alistipes onderdonkii, and Ruminococcus D bicirculans; the denominator consists of 6 ASVs classified as Akkermansia muciniphila, Bacteroides caccae, Bacteroides faecichinchillae, Bacteroides fragilis, Buttiauxella agrestis, and Ruminiclostridium E siraeum. ASV = amplicon sequence variant; CI = confidence interval.
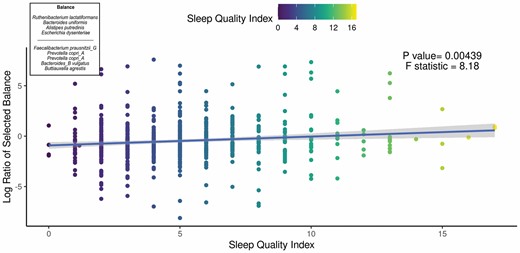
Top predicted ASV log ratio is correlated with self-reported sleep quality index. The results of the linear regression model showing the top CoDaCoRe selected balance is significantly associated (beta = 0.38, 95% CI: 0.11–0.65; p < .05) with the self-reported Pittsburgh Sleep Quality Index, even after adjustment for all variables from the full model. The solid line and adjacent shaded area correspond to regression line and 95% CIs, respectively. The numerator consists of 4 ASVs classified as Ruthenibacterium lactatiformans, Bacteroides uniformis, Alistipes putredinis, and Escherichia dysenteriae; the denominator consists of 7 ASVs classified as Faecalibacterium prausnitzii_G, 2 ASVs of Prevotella copri_A, Bacteroides_B vulgatus, Buttiauxella agrestis, Ruminococcus_D bicirculans, and Oscillibacter valericigenes. ASV = amplicon sequence variant; CI = confidence interval.
Discussion
We determined that both subjectively reported and objectively measured sleep correlated with the gut microbiome diversity measures as well as differential bacterial abundance in a relatively large sample of community-dwelling older men. In particular, we found that men with poorer self-reported sleep ascertained by the PSQI had lower alpha diversity, although these results, in contrast to our hypothesis, were no longer statistically significant after multivariable adjustment. We found that mean sleep regularity was, in accordance with our hypothesis, significantly associated with differences in beta diversity, the implications of which support the findings in an emerging field of circadian rhythms and the gut microbiome (32). In examining specific taxa and in agreement with our hypothesis, we found that sleep regularity predicted DA of 13 taxa (more specifically, the higher relative abundance of 7 taxa vs the lower relative abundance of 6 other taxa). Six of the 7 bacterial species associated with better sleep regularity have been previously linked to better gut health and 4 out of 6 bacterial species associated with worse sleep regularity have been described as being potentially pathogenic, including A. muciniphila, B. fragilis, and Escherichia dysenteriae (33–35). We also found that sleep quality was associated with the DA of 11 taxa. Interestingly, there was a substantial overlap (71.4%) in the specific species of bacteria identified with both better sleep regularity and self-reported sleep.
It has been long accepted that there are important interactions between the gut–brain axis (2). Within the past 15 years, emerging evidence shows important communication between gut microbiota and the central nervous system that primarily occurs through microbial-derived intermediates including the SFCA (36), secondary bile acids (37), and tryptophan metabolites (38). More recently, especially in animal models, there is increasing evidence that the gut microbiota may modulate host circadian rhythms (37). Our study results support an important link between gut microbiota and self-reported sleep as well as sleep regularity, at least in older men.
Of the 7 different taxa that were significantly associated with better sleep, whether determined by more consistent regularity or self-report, at least 5 (F. prausnitzii G, Provotella copri A, Bacteroides B vulgatus, and Bacteroides B dorei) are known to produce butyrate, the predominant SCFA associated with overall gut health. Although Ruminoccocus and Oscillobacter are both associated with SCFA production of butyrate, R. D bicirculans and Oscillobacter valericegenes, which were associated with better sleep in this study, have been less well characterized with regards to human gut health.
In examining the taxa associated with worse sleep regularity and poor self-reported sleep, we found that 75%–80% of those taxa have been associated with human disease, with the remaining 2 (Akkermansia species, Rutherbacterium lactatiformans) not having enough information to suggest a beneficial or harmful effect in humans. Since exploratory studies can yield false positive results, the observation that most of the identified taxa (>70%) have a known biological impact and are found to be associated with sleep characteristics in the expected direction supports the validity of findings.
Considering possible mechanisms, a bidirectional effect between sleep and the gut microbiome is plausible. Human sleep behaviors are hypothesized to affect the composition of the gut microbiome through the differences in the timing of food intake and fasting (e.g., through direct metabolic effects) (39). In mice, the diurnal rhythmicity of microbiota affects bacterial adherence to the gut wall or changes in microbial pathways related to chemotaxis; these functional oscillations then influence the global programming of the host circadian transcriptional, epigenetic, and metabolic oscillations (40).
Much attention has been focused on SCFA, specifically butyrate, propionate, and acetate as important modulators in the gut–microbiome–brain axis. Leone et al. demonstrated that butyrate modulated the expression of clock genes in the liver (41), whereas Szentirmai et al. demonstrated that butyrate enhanced sleep in rats (42). Secondary bile acids may also link the gut microbiome to sleep. When humans ingest food, primary bile acids are produced from cholesterol in the liver and secreted into the gut. The gut microbiota then converts the primary bile acids into secondary bile acids that regulate hepatic and ileal clock genes in mice (37). Finally, serotonin of which 90% is derived from dietary tryptophan absorbed in the gut has been implicated in sleep–wake cycles (37).
Our study results confirm previous investigations done in humans suggesting an important link between the gut microbiota and sleep (43–46). However, at the taxonomic level, only the largest study of over 1 800 individuals also implicated Ruminococcaceae as protective against chronic insomnia (46). A combination of various factors may explain certain discrepancies from our results to previous ones. For example, the older population in our cohort, smaller sample sizes (<50) in other studies, methods of high-throughput sequencing and bioinformatics processing, and choice of appropriate and robust statistical models could differentially influence the results. Our study findings that support underlying biologically plausible explanations for the key taxa identified using the latest taxonomic analyses lend credence to what has been reported in mice models of sleep and the gut microbiome.
This study has multiple strengths including a large sample size, detailed subjective and objective measures of sleep characteristics, and state-of-the-art high-throughput sequencing analyses for microbiota characterization. This study also has some limitations worth noting. First, since we studied predominantly white older men of mean age of 84 years, the results may not apply to different demographics including women and younger persons. However, this population has hitherto been underrepresented in gut microbiome research, thus the current study fills an important gap. Second, this study was cross-sectional in design, so directionality cannot be inferred. To determine the possible mechanisms and directionality of associations, future studies that incorporate longitudinal designs, gnotobiotic animal models, and randomized controlled trials are required. These studies can also elucidate the mechanisms of action by exploring the functional pathways involved with the use of other technologies such as shotgun metagenomics, metabolomics, proteomics, etc. Third, although we attempted to improve our taxonomic classifier by incorporating environment-specific information, species-level designations using 16S methods have its own limitations and require validation using other more sensitive methods (47,48). However, in this setting, the underlying ASV signals would not be incorrect if species names were in fact falsely classified. Fourth, the stool samples were collected at a single time point, while the gut microbiota is known to oscillate diurnally, so the relationship between sleep and gut microbiota could differ depending upon the time of sample collection. Despite these limitations, this study contributes to the small but growing literature on the link between gut microbiota and sleep.
Achieving a full understanding of the complex nature of each human’s gut microbial composition and how it may affect sleep will require a multidisciplinary approach. Even when specific bacteria are convincingly implicated in affecting sleep, there is tremendous intraspecies variability resulting in remarkable genome divergence, and hence potential differing functional capabilities (33). Furthermore, recent research has demonstrated that microbial–microbial interactions can not only influence each other, but also alter host metabolism (49). With increasingly powerful analytic tools, it is conceivable that with careful experimental study design, potential therapies based upon manipulating the gut microbiota and/or harnessing their metabolic products to improve sleep are possible.
Supporting previous sleep-related research, sleep regularity appears to have important health implications. Our study findings highlight a new discovery of the importance of sleep regularity in relation to the gut microbiota in older men. Furthermore, we found that both poor self-reported sleep and worse regularity implicated butyrate-producing bacteria as a positive influence with traditionally pathogenic bacteria leading to human infection being associated with worse sleep patterns. In older adults, sleep disorders are common and although sleep medications can help persons sleep better in the short term, they are not recommended for habitual use (50). If our study results are further explored and mechanisms better understood that implicate diet and optimizing a healthy gut microbiome, perhaps a regular good night’s sleep may be possible for millions.
Funding
The Osteoporotic Fractures in Men (MrOS) Study is supported by National Institutes of Health funding. The following institutes provide support: the National Institutes of Aging (NIA), the National Institute of Arthritis and Musculoskeletal and Skin Diseases (NIAMS grant R01AR061445), the National Center for Advancing Translational Sciences, and NIH Roadmap for accelerated research under the following grant numbers: U01 AG027810, U01 AG042124, U01 AG042139, U01 AG042140, U01 AG042143, U01 AG042145, U01 AG042168, U01 AR066160, R01 AG066671, and UL1 TR000128. The National Heart, Lung, and Blood Institute provides funding for the MrOS Sleep ancillary study “Outcomes of Sleep Disorders in Older Men” under the following grant numbers: R01 HL071194, R01 HL070848, R01 HL070847, R01 HL070842, R01 HL070841, R01 HL070837, R01 HL070838, and R01 HL070839. Funding to support D.K.’s effort is through the Veterans Administration Health Affairs Administration. M.S.’s effort is supported by the following grants: R03 AG070178, R01 AG069915, P30 AG028747-15S1, RF1 NS128360, R03 AG070178, and R01 AG048069. C.K. received funding from the NIA (K01AG061239).
Conflict of Interest
None declared.
Author Contributions
M.E.: data curation (equal), formal analysis (lead), investigation (equal), methodology (lead), writing—original draft (lead). L. Langsetmo: data curation, formal analysis, investigation, methodology (equal), supervision, writing—review & editing (equal). M.S.: formal analysis, investigation, methodology (equal), supervision, validation, visualization, writing—review & editing (equal). A.M.: project administration, validation, writing—review & editing (equal). L.J.: data curation, formal analysis, investigation, methodology, supervision (supporting), writing—review & editing (supporting). Y.Z.: formal analysis, investigation, writing—review & editing (supporting). C.K.: methodology, writing—review & editing (supporting). R.K.: methodology, resources (equal), software (lead), supervision, validation, visualization, writing—review & editing (supporting). K.S.: data curation (equal), formal analysis, funding acquisition (equal), methodology (equal), resources (equal), supervision, writing—review & editing (supporting). D.K.: conceptualization (lead), data curation (equal), formal analysis (equal), funding acquisition (equal), investigation (equal), methodology (equal), project administration (lead), resources (equal), supervision (lead), validation (equal), visualization (equal), writing—original draft (lead).
Data Availability
All sequencing files are available on ENA under project number PRJEB26012. All codes required to reproduce the bioinformatics processing and data analysis can be found in the Open Science Framework project page: https://osf.io/hq5ax. Please note that participant-level personal identifiable data are protected under the Health Insurance Portability and Accountability Act of 1996 (HIPAA), Public Law 104-1919 that mandated the adoption of Federal protections for individually identifiable health information. Thus, public distribution of some of the sample information used in this study is not allowed, however, they can be made available as a Limited Data Set through accessing https://mrosonline.ucsf.edu. Interested users can create an account by registering online and signing a Data Use Agreement (DUA). The DUA stipulates that the data recipient agrees not to Use or Disclose the Limited Data Set for any purpose other than Permitted Uses and Disclosures or as Required by Law. The full DUA is available here: https://mrosonline.ucsf.edu/Account/UserAgreement./

