


Abstract
Access to field experiences can increase participation of diverse groups in the environmental and natural resources (ENR) workforce. Despite a growing interest among the ENR community to attract and retain diverse students, minimal data exist on what factors undergraduate students prioritize when applying for field experiences. Using a nationwide survey of US undergraduate ENR students, we show that attracting most students to field experiences—especially racial or ethnic minority students—will require pay above minimum wage. However, the concurrent landscape of pay in ENR fell short of meeting many students’ pay needs. Aside from pay, ENR students valued training in technical field skills and analytical or research skills, working with their desired study species or taxa, and working near school or family. Additional barriers beyond limited pay included incompatible schedules and noninclusive work environments. Our findings provide important insights for attracting a diverse workforce to this critical stage in career advancement for students in ENR.
Attracting and retaining students from diverse social and cultural backgrounds has become a goal across the science, technology, engineering, and mathematics (STEM) disciplines, including environmental and natural resources (ENR). The benefits of sociocultural diversity in STEM include greater scientific impact for diverse collaborations (Campbell et al. 2013, Nielsen et al. 2017, AlShebli et al. 2018) and broadening scientific inquiry to include topics relevant to a larger portion of society (National Academy of Sciences et al. 2011, Nature 2018). Diversifying STEM is also just; efforts are often focused on increasing access for groups traditionally excluded from STEM by systemic oppression (Grogan 2019, Campbell et al. 2000). There are signs of improvement in ENR; as the stakeholders with power have diversified from primarily white men, the profession as a whole has also diversified to include a greater proportion of women and people of color enrolled in related majors and employed in the workforce (Lopez and Brown 2011, Haynes et al. 2015, Sharik et al. 2015). However, some identity groups are still underrepresented; for example, Hispanics make up 16% of the US population but only 4.9% of the STEM workforce and 4% of the natural resources workforce (Carnevale et al. 2011, Haynes et al. 2015). Addressing such disparities in representation across multiple identities (e.g., racial or ethnic, economic class, disability) is a key priority in many STEM fields.
The undergraduate years are a critical time for the recruitment and retention of underrepresented students in ENR. Only 40% of the students who begin college with an interest in STEM finish with a STEM degree (Gates and Mirkin 2012), but this number falls to 20% for underrepresented minorities (Koenig 2009, Graham et al. 2013, Freeman et al. 2014). There are similar concerning patterns within ENR, and research has highlighted several barriers to completing an ENR degree for underrepresented minorities, including financial pressure, family pressure (likely related to career choice), perceived discrimination, a lack of knowledge, and a lack of confidence (Balcarczyk et al. 2015, 2016, Haynes and Jacobson 2015). Barriers remain for women as well; gender bias and sexual harassment undermine the motivation of undergraduate women to remain in STEM (Leaper and Starr 2019).
Field internships and technician positions (hereafter, field experiences) play a critical role in reducing attrition of underrepresented students and offer important career advancement opportunities for students in ENR (Beltran et al. 2020, Morales et al. 2020). We define a field experience as a type of work experience in which the employee (often a student or recent graduate) works in their field of study or interest either during a semester or over the summer. Field experiences in ENR improve graduation rates and GPA scores, increase retention of ENR majors, improve student self-efficacy, provide opportunities for skill development, and help students clarify career intentions (Busby 2003, Scholz et al. 2004, Edge 2016, Mullens 2017, Beltran et al. 2020). It can be difficult to be qualified for graduate school or entry-level career positions without field experiences, because they provide the opportunity to apply classroom knowledge and network with potential future employers (Mullens 2017, Coco 2000).
Despite their importance, field experiences are not accessible to everyone because of low pay and other barriers (Whitaker 2003, Fournier and Bond 2015). Low pay creates an inequitable environment for students whose financial responsibilities cannot be met by underpaid field experiences. Indeed, research in other fields has shown that people with low incomes could not accept unpaid internships (Curiale 2010) or were more likely to have lower-quality internships (Gardner 2011). The accessibility of field experiences can also be affected by other factors, including having another job, a heavy course load, or limited field experience availability (Hora et al. 2018). Certain groups may face unique challenges when considering field experiences. For example, people with children may not be able to participate in field experiences that require long or nonstandard work hours (Girard 2010, Fink 2013) and in cultures in which family is paramount, relocating may not be an option (Balcarczyk et al. 2015). Therefore, although undergraduate student enrollment has diversified to include more low-income students, disabled students, and parents (Taniguchi and Kaufman 2005, Morningstar et al. 2017, Fry and Cilluffo 2019), field experiences may lag behind these demographic trends in higher education. Furthermore, fieldwork culture may be unsupportive, unwelcoming, or unaccommodating to racial or ethnic minority, LGBTQ+, and disabled students (Morales et al. 2020). Indeed, factors such as these could modulate the amount of pay students can accept. For example, some students might accept a lower-paying field experience if they can live at home, and other students might be willing to work for less money if they can gain desired skills or work with their favorite species. Therefore, regardless of representation, certain segments of society may face distinct barriers or have distinct priorities when participating in field experiences.
Although some barriers to access have been identified, we still know surprisingly little about what ENR students across diverse backgrounds prioritize or how much they need to be paid to participate in field experiences. To address this knowledge gap and provide information to employers seeking to diversify their workforce, we conducted a nationwide survey of undergraduate students enrolled in ENR programs to address the following objectives: to quantify how pay needed to participate in field experiences varies across demographic groups; to quantify how study species or taxa, skills, location, and employer influence the amount of pay needed; to compare needed pay to the concurrent landscape of pay in ENR; to describe trends in the study species or taxa that students want to work with, skills they want to obtain, locations in which they want to work, and organizations they want to work for; and to quantify barriers other than pay that limit student participation in field experiences. For the first objective, we hypothesized that race or ethnicity, gender identity, sexuality, disability status, first-generation college student status, age, number of children, family financial support, whether the student had a paid job in the academic year, and annual self-generated income would influence pay needed, and predicted that nonwhite students, cisgender males, heterosexual students, disabled students, non-first-generation students, older students, parents, students with less family support, students without paid jobs in the academic year, and lower self-generated income students would require more pay (Badgett 1995, Scheid 2005, Taylor 2007, Menéndez et al. 2007, Menon et al. 2012, Frenette et al. 2015, Shade and Jacobson 2015, O'Connor and Bodicoat 2017, Hora et al. 2018, Fournier et al. 2019, Manzoni and Streib 2019). For the second objective, we hypothesized that study species or taxa, skill development, and location would modulate pay, and predicted that working with desired study species or taxa, gaining experience with desired skills, and working internationally would lower needed pay (Busby 2003, Ellis 2003, Bunch et al. 2013). For the third objective, we hypothesized that unpaid and underpaid jobs are still common, and predicted that the average pay would be lower than what students needed (Whitaker 2003, Fournier and Bond 2015).
Data collection and analysis
Survey development
We developed a survey (supplemental appendix A) consisting of two sections. In the first section, we asked the participants what minimum monthly salary they would need to be able to accept a full-time (40 hours per week for 3 months) internship that included housing and a work vehicle. We then asked how their ideal study species or taxa, training in desired skills, proximity to home, and employer would influence how much they would need to be paid to accept this same internship. As a secondary metric, we asked the participants to rank these topics and pay in order of relative importance. We also asked the participants to specify their preferred study species or taxa, skills (up to three), location, and employer.
In the second section, we collected sociodemographic information, including self-generated annual income (i.e., not including family support or financial aid), family support, whether they worked a paid job during the academic year, marital status, family care responsibilities, racial or ethnic identification, gender identity, sexuality, disability status, status as a first- or non-first-generation college student, the state in which they attend school, undergraduate major, age, and how much of a barrier their level of income has been to their academic career (supplemental table S1). Finally, we asked the students to identify any other factors that affected or limited their willingness to participate in field experiences.
At the end of the survey, we provided the opportunity for the students to anonymously enter their email for a chance to win 1 of 16 $25 Amazon gift cards. We pretested the survey in September 2019 with recent graduates of Clemson University's Department of Forestry and Environmental Conservation using the departmental alumni email list, the results of which were not included in our analyses. This survey was approved by Clemson University's Institutional Review Board for Human Subject Reviews (IRB 2019–222).
Study population
We targeted undergraduate students enrolled in environmental science, natural resource, and biological science programs at universities in the United States. We used the “Where to Get Your Degree” list of 446 university and college departments compiled by The Wildlife Society to identify potential departments to contact (The Wildlife Society 2019). This list included departments from 378 university systems, tribal colleges, technical colleges, and community colleges. We chose to target current students because of the potential difficulty and inconsistencies involved in contacting alumni.
Survey distribution
We searched the Internet for a contact (i.e., administrative assistant or department chair) from each department in the list described above. We found contacts for 397 (89%) relevant departments and sent them an email in October 2019 asking them to send our survey link to undergraduates in their program and to report back with the number of students that were sent the survey link. If we received no response from our first request, we sent another email 1 week later to the initial contact and a secondary contact in the same department requesting that they distribute our survey link. For the departments that distributed our survey link, we requested that they redistribute the survey again in 3–4 weeks to the same list. We used the Qualtrics platform (Qualtrics, Provo, Utah, United States) to administer the survey and store participant responses in a password-protected account. Given the challenges of communicating with a large number of contacts, and our reliance on these contacts to disseminate the survey link, we do not know the exact dates that all institutions sent out the survey the first time. Our best estimate is between 15 October and 1 November 2019.
Analysis of relationships between pay and demographics. Prior to analysis, we removed 282 responses from the data set representing the respondents who did not answer the minimum monthly salary question or the demographics questions. We also removed 24 responses for which the minimum monthly salary was above $7000 because they were outliers, and we believed that the respondent may have misinterpreted our question and reported the pay they would require for the entire 3-month field experience as opposed to their required monthly pay. We also removed 38 responses from students enrolled in non-ENR-related majors and 2 responses from students whose answers indicated that they did not take the survey seriously.
We changed the categorical annual income variable to an ordinal variable representing the annual income level ($0–$9,999, 1; $10,000–$19,999, 2; $20,000–$29,999, 3; $30,000–$39,999, 4; $40,000–$49,999, 5; $50,000 and above, 6), and we changed the percentage of tuition covered, percentage of insurance covered, and percentage of rent covered by family variables into ordinal variables (0%–10%, 1; 91%–100%, 10). We then combined these three factors into a single additive family support variable (tuition + rent + insurance = family support). Finally, because of low numbers of responses for some identity groups, we collapsed several categories into dominant and minority groupings (the latter included the respondents who preferred not to answer) to facilitate model convergence in our analysis. Specifically, we reduced race or ethnicity to white or nonwhite (all respondents who identified as racial or ethnic minorities or preferred not to answer), gender identity into cisgender male or cisgender female and noncisgender (transgender, gender nonconforming, genderfluid, preferred to self-describe, and preferred not to answer), sexuality into heterosexual or nonheterosexual (bisexual, gay or lesbian, preferred to self-describe, preferred not to answer), and disability status into abled or disabled (disabled or prefer to self-describe). We grouped the prefer not to answer and prefer to self-describe responses with the minority identity groups because there were too few (typically fewer than 10) responses in these groups to analyze separately and we did not want to remove these respondents from the data set. Aside from the limited sample size concern, we also chose to combine all racial and ethnic minority groups and cisgender females with noncisgender students for the following reasons: Certain identity groups (e.g., gender-expansive groups) are often left out of reported results because of small sample sizes, and we did not want to exclude such groups from our analysis. The identity groups we combined disproportionately experience marginalization, bias, or other forms of oppression in environmental science. And, although we identified variability within these groupings during our exploratory data analysis (e.g., in reported pay requirements), the trends were similar for the minoritized or marginalized identity groups that were pooled in contrast to the majority or nonmarginalized identity groups (supplemental table S2).
We used generalized linear models (GLMs) with a negative binomial distribution using the MASS package (version 7.3–53; Venables and Ripley 2002) in R (version 3.5.1., R Core Team 2018) to test associations between required minimum monthly salary and demographic variables (race or ethnicity, gender identity, sexuality, disability status, first-generation status, age, number of children, family financial support, whether the student had a paid job in the academic year, and annual income level). However, annual income level was significantly and positively correlated with age (Kendall's Bonferroni adjusted r = .51, τ = 16.97, p < .001) and number of children (r = .35, τ = 10.67, p < .001) and negatively correlated with family support (r = –.31, τ = –9.53, p < .001), so we kept income in the analysis and dropped the other correlated predictors. We also found a significant correlation between income and whether the student had a paid job, such that, relative to higher-income earners, lower-income earners more often had paid jobs during the academic year (Pearson's χ²(5) = 48.79, p < .001), so we also dropped the paid job variable from the regression analysis. We also used GLMs with a negative binomial distribution to test associations between the same demographic variable subset and the amount of pay increase or decrease per month a student would accept to work with their desired study species, gain training in desired skills, work close to home, work at a desired international location, or work with their desired employer. We ran models that included all demographic predictors of interest to account for the effect of intersectional identities (e.g., disabled and transgender) on desired pay. All analyses were conducted in R using built-in base functions and plotted in ggplot2 (version 3.3.2, Wickham 2016) or in Microsoft Excel (Microsoft, Seattle, Washington, United States) unless otherwise stated.
We were unable to conduct nonresponse sampling because of the anonymous sampling methods used. Instead, we estimated nonresponse bias using a wave analysis (Armstrong and Overton 1977) by testing for variation between the first 50 respondents in the first wave of responses against the last 50 respondents from the second wave of responses (i.e., after the second email was sent out).
Job boards
In order to assess the concurrent landscape of pay in ENR, we quantified pay for full-time seasonal or temporary positions posted on the career web pages or job boards of Texas A&M Wildlife and Fisheries Sciences, ECOLOG, the Student Conservation Association, USAJobs, The Wildlife Society, the Ornithology Exchange, the American Fisheries Society, the Conservation Job Board, and The Society for Conservation Biology from 18 March to 8 April 2019 inclusive (when many summer seasonal positions are posted). For each posting, we recorded the compensation (or cost for pay-to-work positions) and whether housing and a work vehicle were provided. We removed cross-postings and postings for which the pay was unspecified or depended on experience. In order to compare ENR pay to our survey data, we removed postings that were not clearly full time, not clearly less than or equal to 6 months in duration, or where a master's of science degree was preferred. Because many postings advertised for multiple of the same position, we recorded the number of positions per posting, and used these numbers in analyses.
We converted the pay or cost into a monthly rate using the average number of hours or weeks worked in a month for a 40 hours per week job. To account for the monetary benefit of housing, we added $300 to the monthly rate when housing was provided. We chose $300 because the average monthly reduction in pay for positions in our job board database that provided housing for reduced pay was approximately $150, which we doubled to be conservative. We then converted this new monthly rate into an hourly rate, and classified each position as pay to work, unpaid, underpaid, or paid. Pay-to-work positions were those in which the participant pays a fee (or is responsible for travel expenses to an international location) to volunteer (for a net below $0 per hour), unpaid positions were strictly volunteer (for a net of $0 per hour), underpaid positions paid below the US federal minimum wage (for a net of $0.01–$7.24 per hour), and paid positions paid the federal minimum wage or more (for a net of at least $7.25 per hour). We also quantified the average cost of international experiences, which were typically pay-to-work positions, and were defined as any terrestrially based position outside of the United States or Canada.
To compare the job board data with the survey results, we created six different wage benchmarks: the average underpaid wage from the job board data, the federal minimum wage, the average needed wage from the survey data, the average paid wage from the job board data, double the federal minimum wage, and the wage needed to retain 90% of all respondent groups. We chose these categories because they represented a range of wages based on what jobs were paying (1 and 4), a federal mandate (2 and 5), student needs (3), and an arbitrary goal (90% of the respondents) that equated to the easily remembered $20 per hour. Double minimum wage was also somewhat arbitrary, but we chose it because it was between benchmarks 4 and 6. We calculated the percentage of the respondents retained in the applicant pool for each category on the bases of their needed monthly salary. We compared all of the respondents who provided a needed monthly salary with nonwhite, cisgender female or noncisgender, and $10,000–$19,999 annually earning respondents because race or ethnicity, gender identity, and annual income were significant predictors in the regression examining needed pay. Finally, we calculated the percentage of job board positions that met each of our six wage benchmarks.
Priorities and barriers for students
Forty-five departments (10%) sent our survey to 11,433 students, and we received responses from 1225 students (11% response rate). Removing data as was described in the methods left 879 responses. We received responses from undergraduate students attending schools in 39 states, with most regions well represented (supplemental figure S1). Nearly half of the respondents were wildlife majors (46%), followed by biology or ecology (15%), environmental science (15%), natural resources (15%), forestry (5%), and education or recreation (1%; supplemental table S3). Thirty-seven percent of the respondents were seniors, followed by juniors (32%), sophomores (18%), and freshmen (13%; supplemental table S4). Representation for bisexual, gay, or lesbian respondents was 19% (14.5% higher than the national average of 4.5%; UCLA Williams Institute 2020). Four percent of the respondents said they had one or more children. Most of the respondents were between the ages of 18 and 24 (85%), followed by 25–31 (10%), 32–38 (3%), 39–45 (1%), 46–52 (0.5%), and 53–59 (0.5%). Family support was slightly skewed; 22% of the respondents said that their family covers 91%–100% of their expenses, 13% of the respondents said their family covers up to 10% of their expenses, and the majority of the respondents were in the 31%–70% range (supplemental figure 2). The demographic majorities (more than 50% of responses) at either end of the family support spectrum mostly matched our dominant categories (white, cisgender female, heterosexual, abled, never married). However, the majority of the respondents who received 0%–10% family support were first generation and had a paid job, whereas the majority of the respondents who received 91%–100% family support were not first generation and did not have a paid job.
The results from the wave analysis indicated that the distribution of 1 of 13 variables (annual income) was significantly different between the first 50 and last 50 respondents (supplemental table S5). Specifically, the mean annual income for the first 50 respondents was significantly lower than the mean annual income of the last 50 respondents (t = –1.71, p = .03).
Barriers to participation in field experiences
The largest proportion of the respondents (43%) agreed or strongly agreed that income was a barrier to them taking an internship, compared to those who neither agreed nor disagreed (23%), or disagreed or strongly disagreed that income was a barrier (34%; supplemental table S6). Eighteen percent of the respondents indicated that other barriers limited their participation in internships, including season or timing of the position, work or school conflicts, lack of transportation, family care conflicts, mental or physical health concerns, poor work conditions or environment, limited qualifications, a lack of housing, a lack of professional development, and other concerns (figure 1). Some barriers were more limiting for certain groups (e.g., cisgender females and noncisgender students represented most of the respondents in several barrier categories) and most underrepresented groups included nearly half of the respondents in each barrier category despite encompassing under 30% of our data set (figure 1, supplemental table S2).
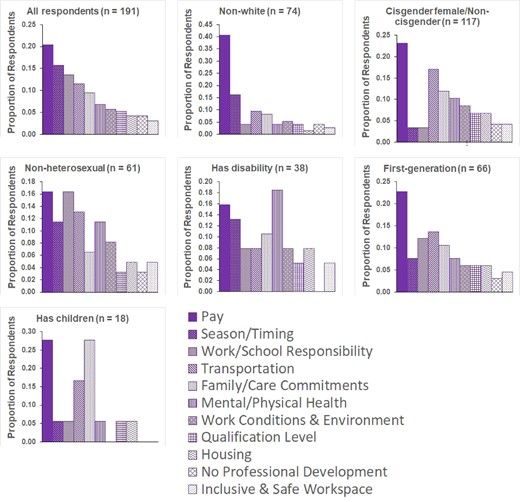
Proportion of the subset of respondents (n = 191 out of N = 879 total responses) that indicated there were other factors that affected or limited their willingness to participate in field internships that we did not ask about. Results are presented for all respondents in this subset and for different underrepresented groups. Categories with less than five responses are not shown, such as location (4), application process (3), citizenship status (3), cultural or religious commitments (3), lack of employee benefits (2), lack of advertising (2), pets (2), language barrier (1), type of work (1), and relationships (1).
Relationships between required pay and demographics
Race or ethnicity, gender identity, and annual income level significantly affected the amount of minimum monthly salary that students required (figure 2, table 1). The racial and ethnic minority students required $369 (24%) more per month than white students (figure 2). The students who identified as cisgender female or noncisgender would accept $210 (14%) less in pay per month than cisgender male students (figure 2). There was a positive correlation between expected internship pay and a student's self-generated annual income.
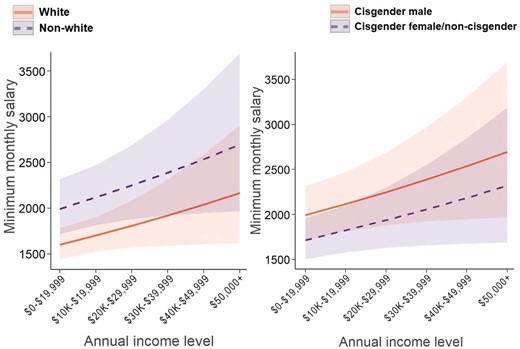
Predicted relationship between the mean required minimum monthly salary for field experiences and student self-generated annual income level as a function of race or ethnicity and gender identity. The error bars represent 95% confidence intervals. Nonwhite includes all respondents who identified as racial or ethnic minorities, and cisgender female or noncisgender includes students that identify as cisgender female, transgender, gender nonconforming, genderfluid, preferred to self-describe, and preferred not to answer.
Results from the analysis of relationships between respondent demographics and required minimum monthly salary, pay decreases or increases by desired species, or taxa, skills, locations, or employers. Estimates are shown for significant (p < 0.05) or marginally significant (p < 0.10), predictors only.
| Pay factor | Demographic factor | β estimate | Standard error | z | p |
|---|---|---|---|---|---|
| Required monthly salary | Intercept | 7.32 | .07 | 108.67 | <.001 |
| Nonwhite | .22 | .06 | 3.42 | <.001 | |
| Cisgender female and noncisgender | –.15 | .06 | –2.59 | .010 | |
| Annual income level | .06 | .03 | 1.99 | .047 | |
| Pay decrease by species or taxa | Intercept | 5.912 | .117 | 5.516 | <.001 |
| Nonheterosexual | –.165 | .092 | –1.802 | .0716 | |
| Has disability | –.193 | .114 | –1.694 | .0903 | |
| Annual income level | .125 | .058 | 2.134 | .0328 | |
| Pay decrease by skills | Intercept | 5.839 | .122 | 47.704 | <.001 |
| Nonwhite | .243 | .132 | 1.840 | .0658 | |
| Pay decrease by location near home | Intercept | 5.899 | .156 | 37.917 | <.001 |
| Annual income level | .156 | .083 | 1.879 | .0602 | |
| Pay decrease by international location | Intercept | 5.915 | .175 | 33.877 | <.001 |
| Has disability | –.512 | .178 | –2.875 | .0040 | |
| First generation | .380 | .163 | 2.326 | .0199 | |
| Pay increase by international location | Intercept | 6.536 | .181 | 36.097 | <.001 |
| Pay decrease by employer | Intercept | 6.058 | .152 | 39.861 | <.001 |
| Has disability | –.378 | .161 | –2.345 | .019 | |
| First generation | .329 | .130 | 2.541 | .0111 |
Pay change by desired study species, skills, location, and employer. Many of the students would take the same pay whether or not the field experience provided work with their desired study species or taxa, skills, employers, or locations (figure 3). However, the respondents were more willing to take pay cuts to work with desired study species or gain training in desired skills than to work with a desired employer, work near home, or work at a desired international location (figure 3). Of the respondents who would accept less pay to work with their desired study species, we found a significant effect of annual income (table 1), such that higher income students were willing to take greater pay decreases to work with their desired study species (figure 4). Of the respondents who would take less pay to gain training in desired skills, we found a marginally significant effect of race or ethnicity only (table 1), such that nonwhite students were willing to take $94 less per month than white students to gain training in desired skills (figure 4). Although fewer respondents were willing to take pay cuts to work near home, internationally, or with their desired employer, these respondents represented approximately one-quarter of the responses in each category (figure 3). Of the respondents who required less pay to work close to home, we found a marginally significant effect of income only (table 1), such that higher-income students were willing to take greater pay decreases to work near home (figure 4). Of the respondents who required less pay to work internationally or to work with a desired employer, we found significant effects of disability and first-generation status (table 1), such that abled students and first-generation students were willing to take larger pay decreases to work internationally or with their desired employer (figure 4). The respondents rarely wanted pay increases to work with desired study species, skills, location, and employers, except 17% wanted more pay to work at their desired international location (figure 3), so we only analyzed pay increases for this case. These students wanted to be paid $690 more per month on average to work internationally, but there was no significant effect of any of the demographic predictors on desired pay increases (table 1).
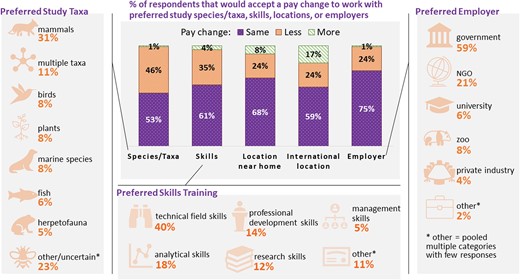
The percentage of respondents who would accept the same or lower pay or would require more pay to participate in field experiences that provide work with preferred study species or taxa, skills, locations, or employers. Also shown are the percentages of respondents who prefer certain study species or taxa, skills, and employers. The preferences were similar (they differed by less than 5%) across demographic groups.
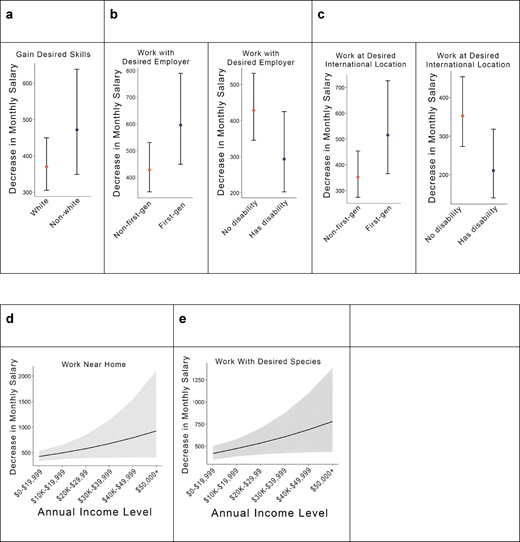
Mean predicted salary decrease that an undergraduate student will accept to participate in a field experience that provides (a) training in desired skills, (b) provides an opportunity to work for a desired employer, (c) to work at a desired international location, (d) to work near home, or (e) to work with a desired study species or taxa. The error bars represent 95% confidence intervals. Only demographic groups (i.e., race or ethnicity, first-generation status, disability, annual income levels) that significantly differed from the average respondent pool for each category are presented. Nonwhite includes all respondents that identified as racial or ethnic minorities.
Desired study species, skills, location, and employer
On average, the respondents prioritized aspects of field experiences in this order: skills, salary, location, species or taxa, employer (supplemental figure S3). The skills category ranked significantly higher than the other categories (t = –8.23, p < .001), whereas salary, location, and species or taxa ranked similarly, and employer ranked significantly lower than the other categories (t = –7.79, p < .001). The respondents prioritized technical skills, analytical skills, professional development skills, and research skills, in that order (figure 3). The respondents nearly equally preferred locations close to important family members (32%), close to the school they currently attended (28%), and other US locations (30%), but rarely preferred international locations (10%; supplemental table S7). Nearly one-third of the respondents said their preferred study species or taxa was mammals, followed by multiple diverse taxa, birds, plants, marine species, teleost fish, herpetofauna, and other groups (figure 3). The majority of the respondents said their desired employer was the government, followed by nongovernmental organizations, universities, zoos, and private companies (figure 3).
Comparing job board results to student needs
The average hourly pay across 849 job board positions was $10.48 ($1,821.16 monthly; supplemental table S8). By our definitions, 620 (73%) positions were paid, 186 (22%) were underpaid, 10 (1%) were volunteer, and 33 (4%) were pay-to-work (figure 5). The average hourly pay was $13.60 ($2,367.00 monthly) for paid jobs, and $4.44 ($770.00 monthly) for underpaid jobs, whereas the average hourly cost was $11.30 ($1,968.00 monthly) for pay-to-work jobs (supplemental table S9, figure 6). Fifty-two percent of positions advertised that housing and a work vehicle were provided (supplemental table S10). We retained positions that required or preferred a bachelor of science degree (BS; n = 147) because they would have been relevant for soon-to-be-graduates, however they paid significantly more per hour than positions that did not require a BS degree (n = 702; $3.59 more; t = –5.78, p < .001; supplemental table S11). The average pay for positions not requiring or preferring a BS degree ($9.86 hourly) is a better estimate for what undergraduates still enrolled might be paid.
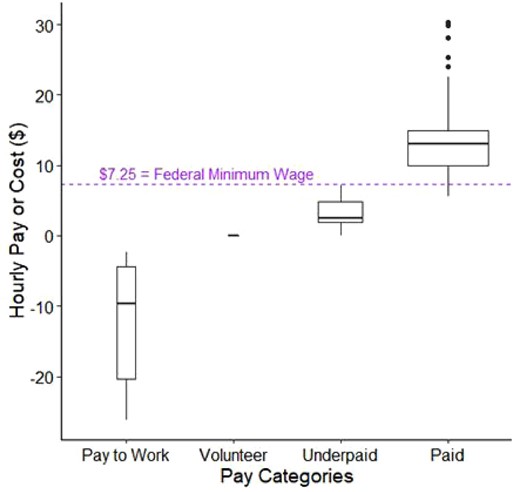
Figure 5. A total of 849 temporary positions posted on ENR resources job boards from 18 March to 8 April 2019 classified by pay or cost category. Twenty-seven percent of the positions fell below the federal minimum wage ($7.25 hourly). The box plot widths reflect the sample size (pay to work, n = 33; volunteer, n = 10; underpaid, n = 186; paid, n = 620), whereas the vertical extent represents the upper and lower quartile of each category.
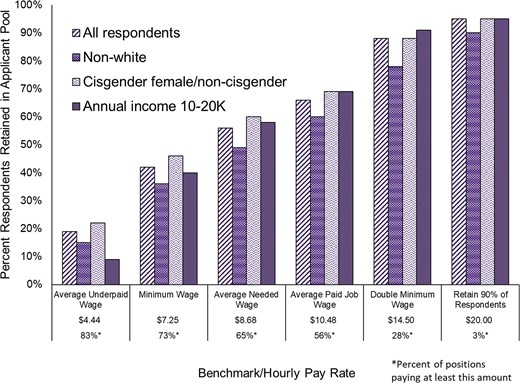
The percentage of respondents retained in the applicant pool at six hourly wage benchmarks. We chose these benchmarks on the basis of data from the job boards (average underpaid wage, average paid job wage), the survey (average wage needed), federal minimum wage (minimum wage, double minimum wage), and retaining at least 90% of every included respondent group. The number below each benchmark indicates the percentage of jobs that paid at least that amount.
The average predicted hourly pay that our respondents required was $8.68. Overall, 19% of the respondents were retained in the applicant pool at $4.44 per hour, which steadily increased to 95% of the respondents at $20.00 per hour (figure 6). At all pay rates, a lower proportion of nonwhite respondents were retained compared with the respondents pooled, but this gap narrowed to 5% at $20.00 per hour, when 90% of the nonwhite respondents were retained (figure 6). The cisgender females and noncisgender respondents had higher retention than the pooled respondents at pay rates up to $14.50, at which point their retention matched that of the respondents pooled. For the respondents earning $10,000–$19,999 annually, only 9% were retained at $4.44 per hour, but the proportion retained was similar to the pooled respondents at higher pay rates. Seventy-three percent of positions paid at least minimum wage ($7.25 per hour), and 65% of positions paid the average wage needed by the respondents ($8.68 per hour). However, only 28% of positions paid double minimum wage ($14.50 per hour), and only 3% paid at least the necessary pay rate ($20.00 per hour) to retain 90% or more of every respondent group (figure 6).
Making field experiences attractive to diverse students
Our nationwide survey of undergraduate students in ENR indicated that attracting a diverse applicant pool to field experiences will require adequate pay and intentional efforts to create supportive environments for students with diverse needs and priorities. We found that income was often a barrier to student participation in field experiences (supplemental table S6), and on average, the respondents required at least $8.68 per hour to accept a field position, which is above federal minimum wage. Pay was especially important for racial and ethnic minority students, who required 24% ($369 per month) higher pay than white students (supplemental table S12, figure 2). Despite pay being a priority for students, many positions posted to ENR job boards in March and April 2019 did not pay the average wage required by the respondents, and 27% of positions paid less than federal minimum wage (figure 5). Many of the respondents, especially racial and ethnic minorities, would not consider jobs that pay below minimum wage (figure 6). Furthermore, only 3% of positions posted to job boards in March and April 2019 paid the amount needed to attract at least 90% of every respondent group (figure 6).
Our findings provide quantitative data that support prior calls to address low-paying ENR field experiences and their impacts on diversity (Whitaker 2003, Fournier and Bond 2015). Our findings that racial and ethnic minorities require higher pay than white students align with results from Taylor (2007), who found that minority students in the biological and environmental sciences had higher pay expectations upon graduation. Similarly, other investigators have found that financial barriers are a key constraint for underrepresented students in the natural resources (Balcarczyk et al. 2015) and that unpaid or pay-to-work field experiences can prohibit participation of racial and ethnic minority students (Beltran et al. 2020). Pay may be particularly important to racial and ethnic minority students because such students often have lower accumulated wealth than white individuals at a similar income level (Keister 2000, Whitaker 2003); therefore, minority students may lack assets to fall back on during financial strain, which limits their capacity to accept low-paying field positions.
Other significant predictors of expected pay included self-generated annual income and gender identity, such that pay was positively associated with annual income, and cisgender males required higher pay than cisgender females and students with noncisgender identities (figure 2). Our finding that cisgender males required higher pay aligns with results from other investigators that similarly found that men expected to earn more than women (Taylor 2007, Gardner 2011, Menon et al. 2012). Such gender-based disparities in pay expectations may arise from a long history of pay inequality for women (Menon et al. 2012) or because women base pay expectations on comparisons to other undercompensated female colleagues (Bokemeier et al. 1987, Phelan 1994). Despite these differences in pay expectations, we echo the calls of others to address gender pay gaps in STEM disciplines (Xu 2015, Else 2018, Holman et al. 2018).
Other investigators have similarly found that students with higher incomes expected to be paid more than their lower-income peers because of overoptimistic pay standards (Webbink and Hartog 2004, Menon et al. 2012). However, we found that income was negatively associated with family support; therefore, students with higher incomes may require more pay during field experiences because they are not well supported by their family and they need to match their regular earnings by some other means. The wave analysis results suggest that the respondents with lower self-generated income may have been more inclined to take the survey, and therefore our findings on the relationship between factors associated with internships and income may be less representative of higher-income earners. The sampling methodology we employed may also have contributed to the wave analysis results, given that we were at the discretion of the administrators with regard to when the email link to the survey was sent out. Therefore, we instead focus our recommendations on other aspects of student identities (e.g., race or ethnicity or gender identity) and not on self-generated income.
Although pay was a top priority, undergraduates seeking field experiences identified multiple other factors as important (e.g., skills training, study location, and study species or taxa), and these factors modified the amount of pay required by some students. In fact, all demographic groups ranked skills training higher than pay (supplemental figure S3), and racial and ethnic minority students were willing to take greater pay decreases on average than white students to gain desired skills (figure 4). Morales and Jacobson (2019) similarly found that minority natural resource students prioritized skills training because they perceived that gaining new skills would enhance job prospects. The majority of students prioritized technical skills (figure 3), which highlights the perceived importance of field experiences in providing hands-on field training beyond the classroom (Busby 2003, Edge 2016). However, students also prioritized nonfield skills (e.g., analytical and research skills; figure 3), which suggests that they may seek field experiences as a pathway to graduate school or other positions that require training beyond field skills (Scholz et al. 2004). Despite study species or taxa being ranked of similar importance to pay and study location, and less important than skills training, more of the respondents indicated they would accept less pay to work with their desired study species than to work at a desired location or gain skills training (figure 3). Nearly one-third of the respondents wanted to work with mammals, which is consistent with other findings (Ellis 2003, Clucas et al. 2008).
The respondents showed equal preference for study locations, except that few preferred international field experiences, which may arise from the high costs of international work (Bunch et al. 2013). Indeed, nearly 20% of our respondents required $690 more per month on average to work at their desired international location, but international field experiences cost $1229 monthly on average, which suggests a disconnect between student expectations and the cost of international field experiences. Our finding that higher-income students were willing to take greater pay decreases to work near home (figure 4) likely reflects responses from students who are willing to lose pay to be close to family members, because income was positively correlated with age and number of children. Students with children often prefer to work from or near home so that they can balance child care, work, and college responsibilities (Peterson 2016). Regardless of income or children, some family cultures may expect college-age students to remain at home, limiting available opportunities to the surrounding area (Balcarczyk et al. 2015).
Our study also identified several important barriers to participation in field experiences beyond pay, including timing conflicts, family care responsibilities, and concerns over unaccommodating or noninclusive working conditions (figure 1). Many of these barriers were especially limiting to cisgender females and noncisgender students. Women with careers often carry more responsibilities outside of work than men with careers, which can limit their participation in career advancement opportunities (Gordon and Whelan-Berry 2004). Furthermore, of the 191 students who responded to our survey question about other barriers to field experience access, there was an overrepresentation of minority groups compared to their representation in the survey overall (figure 1, supplemental table S2). Our finding that minority groups were more likely to report barriers to field experiences aligns with research indicating that field experiences are inaccessible to some minority groups because of unsupportive, unaccommodating, or noninclusive work conditions (Balcarczyk et al. 2015, Hora et al. 2018, Morales et al. 2020).
Our findings are subject to a few important considerations. First, given social, cultural, and economic differences among countries, we advise caution when extrapolating our findings outside of the United States. Second, our results may not reflect opinions from students attending schools in the central United States because of few responses from some states in this region (supplemental figure S1). Third, because we had to collapse identity groups into majority and minority categories (e.g., white and nonwhite) to facilitate our statistical analysis, we may have masked important differences among minority identity groups. For example, Asian students may have higher pay expectations than other racial and ethnic minority students (Taylor 2007). Indeed, our summary statistics indicate that Asian-identified students and Middle Eastern or North African students reported higher pay requirements on average ($2264 per month and $2440 per month, respectively) than other racial and ethnic minority groups (Black or African American, $1818 per month; Hispanic or LatinX, $1617 per month; American Indian or Native American, $1550 per month). However, all racial and ethnic minority groups required higher pay than white-identified students ($1494 per month; supplemental table S2). Furthermore, cisgender females and noncisgender students reported similar pay requirements ($1510 per month and $1593 per month, respectively) that were both well below cisgender males ($1724 per month; supplemental table S2). Therefore, we believe that our statistical analysis of identity groups appropriately reflects the trends in the data. We also recognize that different identity groups within the LGBTQ+ community may have unique experiences with bias, harassment, and discrimination (Yoder and Mattheis 2016) that differentially affect their interest in internships (Bryant and Soria 2015). Indeed, much of the previous insight on barriers to professional development in ENR has been from qualitative interviews (Haynes and Jacobson 2015, Haynes et al. 2015, Balcaryczyk et al. 2015, 2016), which may continue to be useful for better understanding differences across minority groups.
Other considerations include the fact that our study focuses on pay and other desired attributes associated with field experiences. However, important questions remain about the variability in learning opportunities provided by field experiences and the impacts of such experiences on students’ careers and professional networks. Finally, our response rate was below the average response rate for mail-in surveys, but within the 4.7%–21% range common to email or online surveys (Mcdonald and Adam 2003, Kaplowitz et al. 2004, Nulty 2008, Pocewicz et al. 2012, Sinclair et al. 2012). It is well known that Internet survey distributions are often negatively affected by a host of email features (e.g., students forwarding university emails to personal email addresses, and institutional spam filters; Dobrow et al. 2008), which likely reduced the number of students who received the survey link. Furthermore, because we sent our survey to some interdisciplinary departments (e.g., biological sciences), and because students may change majors but not be removed from email lists, our sample frame likely included students who were not intended to participate in the study.
Our results are relevant to ENR employers who want to attract a broad diversity of students. Critically, we found that to attract most students, positions must pay above minimum wage, and attracting racial and ethnic minority students requires even higher pay. Fournier and Bond (2015) outlined strategies to address inadequate pay in field positions, including allocating adequate funds for technicians in grants, greater flexibility by funding agencies to include salaries, increased discussion about the reliance on underpaid labor in ENR professions, and a commitment by ENR professionals to refuse to underpay employees. We also found that students greatly value training in technical field skills and analytical or research skills, but also value working with their desired study species or taxa (especially mammals), and working near school or family. Therefore, field experiences that are designed to train students in skills they will need as future field biologists and researchers, and that offer flexibility in focal species or location, will be particularly attractive to a diverse array of students. Of course, students can also gain field experience through other means (e.g., field courses, field stations, and research experiences for undergraduates; Tydecks et al. 2016, McNulty et al. 2017, Wilson et al. 2018, Beltran et al. 2020). Some of these programs provide financial support (i.e., research experiences for undergraduates), but we encourage program leaders to consider what barriers may still exist to participation (Beltran et al. 2020).
Furthermore, although some barriers to participation in field experiences identified in our study can be addressed with adequate pay and flexibility, our findings suggest that employers will also need to create inclusive and supportive work environments. A recent survey indicated that 85.1% of 88 field programs provided little to no diversity and inclusion training to students or mentors, and over half did not provide access to diverse mentors (O'Connell et al. 2018). Such initiatives to promote inclusivity and create a sense of belonging will need to be coupled with adequate pay and other findings from our study for field experiences to be truly inclusive.
These recommendations parallel other best practices for recruiting and retaining diverse students in STEM disciplines more broadly (Balcarczyk et al. 2015, Fournier and Bond 2015, Mullens 2017) and align with calls to make inclusion a core focus of diversity efforts (Puritty et al. 2017). We recognize that employers will not be able to meet all needs and interests highlighted in the present article, but we suggest that our findings can be used to identify targets within the constraints of each institution that can be modified to better support the needs of diverse students. Increasing access to field experiences can narrow achievement gaps and potentially lead to broader participation of diverse groups in the ENR workforce (Scholz et al. 2004, Mullens 2017, Beltran et al. 2020). Broader participation will likely increase social and financial support for conservation (Lopez and Brown 2011), amplifying the benefits to ENR resource science and practice.
Acknowledgments
The Wildlife Society compiled the list of university and college departments we contacted for the survey. Andrea Kesler distributed the survey to Clemson University Forestry and Environmental Conservation alumni for pretesting. Nathan Mooney and Clemson University Forestry and Environmental Conservation alumni pretested the survey. Departmental contacts at various universities and colleges distributed the survey on our behalf. Anna Siegfried, Andrew Butler, and Allison Hody assisted with survey development and data collection. John Perrine provided feedback on an earlier version of the manuscript, and four anonymous reviewers provided constructive criticism. The Wildlife Society's Ethnic and Gender Diversity Working Group (now named the Inclusion, Diversity, and Equity Awareness Working Group) and the Clemson University Council for Equity and Inclusion each provided $200 to be used to purchase the survey incentive. The Department of Forestry and Environmental Conservation at Clemson University provided financial support to cover open access publication costs.
Author Biographical
Alex J. Jensen, Laura C. Gigliotti, Stephen N. Harris, Courtney J. Marneweck, Mike S. Muthersbaugh, Blaise A. Newman, Shari L. Rodriguez, Elizabeth A. Saldo, Kyle E. Shute, Keifer L. Titus, Amanda L. Williams, Sze Wing Yu, and David S. Jachowski are affiliated with the Department of Forestry and Environmental Conservation at Clemson University, in Clemson, South Carolina, in the United States. Sara P. Bombaci is affiliated with the Department of Fish, Wildlife, and Conservation Biology at Colorado State University, in Fort Collins, Colorado, in the United States. Alex J. Jensen and Sara P. Bombaci are co-lead authors of this article.
