


Abstract
Glaucoma is the most frequent cause of irreversible blindness worldwide. There is no cure, but early detection and treatment can slow the progression and prevent loss of vision. It has been suggested that artificial intelligence (AI) has potential application for detection and management of glaucoma.
This literature review is based on articles published in peer-reviewed journals.
There have been significant advances in both AI and imaging techniques that are able to identify the early signs of glaucomatous damage. Machine and deep learning algorithms show capabilities equivalent to human experts, if not superior.
Concerns that the increased reliance on AI may lead to deskilling of clinicians.
AI has potential to be used in virtual review clinics, telemedicine and as a training tool for junior doctors. Unsupervised AI techniques offer the potential of uncovering currently unrecognized patterns of disease. If this promise is fulfilled, AI may then be of use in challenging cases or where a second opinion is desirable.
There is a need to determine the external validity of deep learning algorithms and to better understand how the ‘black box’ paradigm reaches results.
Background
Glaucoma is the most frequent cause of irreversible blindness worldwide.1,2 It is currently regarded as a group of diseases that share characteristic features of an excavated optic neuropathy and visual field (VF) defects2 which indicate damage at the level of the lamina cribrosa in the optic nerve head. Glaucoma is largely asymptomatic until the advanced stages of the disease when considerable irreversible damage has taken place.2 Although there is no cure, it is important to identify individuals with glaucoma at high risk of progression to ensure early diagnosis and prompt treatment to minimize visual loss. In order to maximize the benefit from scarce resources, it is also important to differentiate individuals at high risk of glaucomatous progression from those that will not progress to significant visual loss in their lifetime.3
There are two mechanistic categories of glaucoma, namely open-angle glaucoma and angle-closure glaucoma. Glaucoma can further be categorized by whether it is primary (usually idiopathic), or secondary.4,5 While there is no universally accepted classification scheme for glaucoma, one of the most cited classification schemes is that of Foster et al.6, who in 2002 offered a cross-sectional classification scheme for diagnosing glaucoma in population-based prevalence surveys, with cases diagnosed on the basis of both structural and functional evidence of glaucomatous optic neuropathy. Structural changes refer to optic nerve damage and retinal nerve fibre layer (RNFL) defects, whereas functional changes refer to VF defects. This scheme has established a clear, evidence-based standard that many others have subsequently used, and one that has been integrated into the UK’s National Institute of Health Care Excellence (NICE) guidance.3
Advances in ophthalmic imaging in recent years have helped to improve detection and monitoring of glaucomatous progression.7 Optical coherence tomography (OCT) imaging was first introduced in 1991 and is now the ‘industry standard’ technique for retinal and optic nerve head imaging. Substantial, rapid improvements have since been made in image acquisition, spanning time domain-OCT (TD-OCT) to spectral domain-OCT (SD-OCT) and finally swept source-OCT (SS-OCT), with faster scans and higher axial resolution achieved with the latter. Current images allow the identification of discreet cellular layers in the retina. Such rich images offer new opportunities to identify novel signs of disease, to improve detection of early-stage disease, but also present challenges to humans in the extraction and interpretation of the relevant data.
Imaging techniques and artificial intelligence
In recent years, there have been significant advances in ophthalmic imaging techniques that allow us to identify the signs of glaucomatous damage and quantitatively monitor structural changes as the disease progresses.7 The trade-off is the demand on time for increasingly complex image interpretation. Automation of image analysis would help mitigate this.
Artificial intelligence (AI) holds great promise to revolutionize highly image-driven areas of medicine, such as ophthalmology and radiology. Despite recent successful testing of AI for detection and management of retinal disease,8 doing the same for glaucoma remains technically very challenging because of the need to interpret a combination of structural and functional features of the disease. AI refers to ‘a machine imitating the way humans think and behave’9. Machine learning, a subfield of AI as illustrated in Figure 1,10 learns and recognizes specific features or lesions in images.9 Deep learning, a subfield of machine learning, uses a deep neural network to classify images based on global labelling on the images and ‘end-to-end’ learning without a need to differentiate the defined features.9,11 Machine learning classifiers (MLCs) are the computer algorithms that process input data, such as fundus photographic images, OCT images or VFs, and generate output data to classify or grade the input data.12 MLCs may be supervised or unsupervised. In supervised learning, the input data are assigned a label or ‘ground truth’ by human involvement and as a result the algorithm is guided towards the ‘correct’ output.13 In contrast, unsupervised learning is where raw input data are processed by the algorithm and divided into groups, which may or may not match the existing clinical knowledge. The term ‘black box’ is used in reference to deep learning algorithms given that the criteria used to make the diagnosis are unknown.14,15 Increasingly, recent studies are using hybrid methods, combining both machine and deep learning algorithms, as seen in Tables 1–3. It is possible that unsupervised learning may reveal information previously unknown to the expert clinician.13
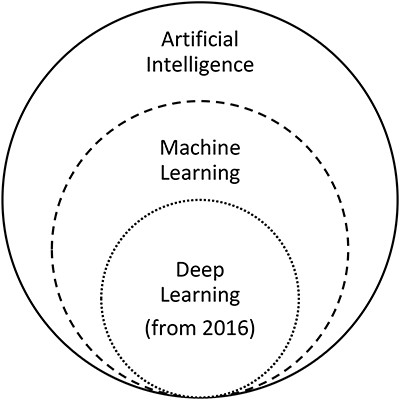
The relationship between artificial intelligence, machine learning and deep learning, adapted from Ting et al.10
Summary of structural key studies
| Author | Year | No. of images/eyes | Imaging modalities | AI method/algorithm | Sensitivity | Specificity | Accuracy | AUC | |
|---|---|---|---|---|---|---|---|---|---|
| Machine learning | Bowd et al.16 | 2002 | 108 glaucomatous; 189 healthy eyes | Confocal scanning laser ophthalmoscopy of the optic disc | Machine learning: SVM linear, SVM Gaussian, MLP, LDF | 0.78–0.81 | All at 0.90 specificity | - | 0.906–0.96 |
| Huang et al.17 | 2005 | 89 glaucomatous; 100 healthy eyes | Stratus-OCT (RNFL thickness and optic nerve head analysis) | Machine learning: LDA, MD, ANN, LDA with PCA, MD with PCA, ANN with PCA | 50.6–98.8 | All at 0.90 specificity | MD 97.66% | 0.821–0.991 | |
| Burgansky-Eliash et al.18 | 2005 | 47 glaucomatous; 42 healthy eyes | Stratus-OCT | Machine learning: SVM(8), LDA(8), GLM(4), SVM, LDA, RPART(8), RPART, Rim area, Mean NFL, Mean macula | 0.468–0.925 | All at 0.95 specificity | 74.2–96.6% | 0.839–0.969 | |
| Huang et al.19 | 2007 | 64 glaucomatous, 71 healthy eyes | Stratus-OCT | Machine learning: automatic labelling with a self-organizing map and decision-tree methods | 0.73 | 0.92 | 83% | - | |
| Barella et al.20 | 2013 | 57 glaucomatous; 46 healthy | SD-OCT | Machine learning: RAN, NB, RBF, MLP, ADA, ENS, BAG, SVMG, SVML, CTREE | 22.5–63.1 | All at 0.90 specificity | - | 0.733–0.877 | |
| Oh et al.21 | 2015 | 386 (257 training; 129 testing) | Colour fundus photographs | Machine and deep learning ANN: Model 1, 2, 3, 4 and 5 | 0.522–0.826 | 0.789–0.859 | 72.3–84% | 0.635–0.890 | |
| Chen et al.22 | 2015 | 99 training; 551 testing followed by 650 training; 1676 testing | Colour fundus photographs | Deep learning CNN: ORIGA dataset, SCES dataset | - | - | - | 0.831 followed by 0.887 | |
| Deep learning | Li et al.23 | 2016 | 585 training, 65 testing | Colour fundus photographs | Deep learning: AlexNet, GoogleNet, VGG-16, VGG-19 | - | - | - | 0.7187–0.8384 |
| Kim et al. (a)24 | 2017 | 1080 (680 training, 200 validation, 200 testing) | Colour fundus photographs | Deep learning: high resolution CNN | - | - | 87.9% | - | |
| Deep learning | Ting et al.25 | 2017 | 125 189 training; 71 896 testing | Retinal images | Deep learning: CNN | 0.964 | 0.872 | - | 0.942 |
| Omodaka et al.26 | 2017 | 114 training; 49 testing | SS-OCT | Machine learning: Neural network | - | - | 87.8% | - | |
| Cerentini et al.27 | 2017 | HRF 45 fundus images, RIM-ONE r1 158 images, RIM-ONE r2 425 images, RIM-ONE r3 159 images | Colour fundus photographs | Deep learning: HRF, RIM-ONE r1, RIM-ONE r2, RIM-ONE r3, HRF + RIM-ONE r1 + RIM-ONE r2 + RIM-ONE r3 | - | - | 86.2–94.2% | - | |
| Raghavendra et al.28 | 2018 | 1426 (837 glaucomatous, 589 healthy) | Colour fundus photographs | Deep learning: CNN | 0.980 | 0.983 | 98.13% | - | |
| Li et al. (a)29 | 2018 | 48 116 images | Colour fundus photographs | Deep learning: CNN | 0.956 | 0.920 | - | 0.986 | |
| Shibata et al.30 | 2018 | Training: 1364 glaucomatous; 1768 normal Testing: 60 glaucomatous; 50 normal | Colour fundus photographs | Deep learning: Deep ResNet versus Ophthalmology residents | - | - | - | 0.965 (versus 0.726–0.912) | |
| Ahn et al.31 | 2018 | 467 advanced glaucoma; 289 early glaucoma; 786 healthy | Colour fundus photographs | Deep learning, Machine learning: Simple logistic classification model and CNN, Transfer-learned GoogleNet Inception v3 | - | - | 77.2–87.9% | 0.93–0.94 | |
| An et al.32 | 2019 | 208 glaucomatous, 149 healthy eyes | Colour fundus photographs, SD-OCT | Machine learning and deep learning CNN | - | - | - | 0.942–0.963 | |
| Asaoka et al.33 | 2019 | 4316 images (1371 glaucomatous, 193 normal eyes) | SD-OCT | Deep learning: Deep learning Transform model | 86.6% | 0.90 | - | 0.937 | |
| Lee et al.34 | 2019 | 100 glaucomatous, 100 healthy | Red-free fundus photography | Deep learning: Deep learning classifier | 0.929 | 0.844 | - | 0.939 | |
| Deep learning | MacCormick et al.35 | 2019 | ORIGA: 605 (501 glaucomatous, 149 healthy), RIM-ONE: 159 (39 glaucomatous, 35 glaucoma suspect, 85 healthy) | Colour fundus photographs | Deep learning: Spatial model | - | - | - | Internal validation: 0.996, External validation: 0.910 |
| Medeiros et al.36 | 2019 | 32 820 pairs of optic disc photographs and SD-OCT RNFL scans from 2312 eyes | SD-OCT: optic disc photographs | Deep learning: CNN | - | - | - | 0.944 | |
| Phan et al.37 | 2019 | 3312 images (369 glaucomatous, 256 glaucoma suspects, 2687 healthy) | Fundus photographs | Deep learning (DCNNs): VGG19, ResNet152, DenseNet201 | - | - | - | 0.995–0.999 | |
| Thompson et al.38 | 2019 | 9282 pairs of optic disc photographs, SD-OCT optic nerve scans form 490 patients | Optic disc photographs, SD-OCT | Deep learning: CNN ResNet | - | - | - | 0.945 | |
| Ran et al.39 | 2019 | Total 6921 SD-OCT: ((4877: 60% training, 20% testing, 20% primary validation) (2044 for external validation)) | SD-OCT | Deep learning: 3D deep-learning system—Primary validation—External validation | 0.89 0.78–0.9 | 0.96 0.79–0.86 | 91% 80–86% | 0.969 0.893–0.897 |
Key: ADA = Ada Boost M1, ANN = artificial neural network, AUC = area under the curve, BAG = bagging, CNN = convolutional neural network, CTREE = classification tree, DCNNs = Deep convolutional neural networks, ENS = ensemble selection, GLM(4) = generalized linear model using 4 parameters, HRF = high resolution backgrounds, LDA = linear discriminant analysis, LDA(8) = linear discriminant analysis using only 8 parameters, LDF = linear discriminant functions, MD = Mahalanobis distance, MLP = multi-layer perceptron, NB = Naïve-Bayes, NFL = nerve fibre layer, OCT = optical coherence tomography, PCA = principal component analysis, RAN = random forest, RBF = radial basis function, ResNet = Residual Learning for Image Recognition, RNFL = retinal nerve fibre layer, RPART = recursive partitioning and regression tree, RPART(8) = recursive partitioning and regression tree using only 8 parameters, SD-OCT = spectral domain OCT, SS-OCT = swept source OCT, SAP = standard automated perimetry, SVM = support vector machines, SVM(8) = support vector machine using only 8 parameters, SVMG = support vector machine Gaussian, SVML = support vector machine linear.
Summary of functional key studies
| Author | Year | No. of images/eyes | Imaging modalities | AI method/algorithm | Sensitivity | Specificity | Accuracy | AUC/Other | |
|---|---|---|---|---|---|---|---|---|---|
| Machine learning | Goldbaum et al.40 | 1994 | 60 glaucomatous, 60 healthy eyes | VFs | Machine learning: Back propagation learning method | 0.65 (versus 0.59 for glaucoma experts) | 0.74 for ML network (versus 0.71 for glaucoma experts) | 67% (comparable to glaucoma experts) | - |
| Goldbaum et al.41 | 2002 | 156 glaucomatous, 189 healthy eyes | SAP | Machine learning: STATPAC Global Indices and statistical classifiers, Machine Classifiers | 0.61–0.67 | 0.76–0.79 | - | 0.884–0.922 | |
| Goldbaum et al.42 | 2009 | 939 glaucomatous, 1146 healthy | HVFs | Machine learning: VIM | 0.89–0.955 | 95% | - | - | |
| Deep learning | Asaoko et al.43 | 2016 | 171 glaucomatous, 108 healthy visual fields | SAP VFs | Deep learning: Deep FNN Machine learning: RF, Gradient boosting, support vector machine, NN | - | - | - | − 0.926 |
| Yousefi et al.44 | 2016 | 1117 glaucomatous, 859 healthy eyes | SAP VFs | Machine learning: GEM, VIM | 0.899–0.930 | 0.938–0.97 | - | 0.81–0.86 | |
| Li et al. (b)45 | 2018 | 4012 images (3713 training, 300 testing) | HVFs 30–2 and 24–2 | Deep learning: Deep CNN Machine learning: SVM, RF, KNN | 0.932 | 0.826 | 59.1–87.6% | 0.966 | |
| Wang et al.46 | 2018 | 44 503 eyes (26 130 subjects) | VFs | Machine and deep learning | - | - | 87.7% | 0.77 |
Key: AA = Archetypal analysis, CNN = convolutional neural network, FNN = feed-forward neural network (FNN), GEM = Gaussian mixture model with expectation maximization, HVFs = Humphrey Visual Fields, KNN = k nearest neighbour, ML = Machine learning, NN = neural network, RF = random forest, RNFL = retinal nerve fibre layer, SAP = standard automated perimetry, SVM = support vector machine, VF = Visual field, VIM = Variational Bayesian − independent component analysis − mixture model.
Summary of combined structural and functional key studies
| Author | Year | No. of images/eyes | Imaging modalities | AI method/algorithm | Sensitivity | Specificity | Accuracy | AUC | |
|---|---|---|---|---|---|---|---|---|---|
| Machine learning | Silva et al.47 | 2013 | 62 glaucomatous; 48 healthy | SAP VFs, SD-OCT-RNFL thickness | Machine learning: BAG, NB, MLP, RBF, RAN, ENS, CTREE, ADA, SVML, SVMG | 0.8225–0.9516 | 0.5645–0.8387 | - | 0.777–0.932 |
| Yousefi et al.48 | 2014 | 107 glaucomatous, 73 healthy eyes | Colour fundus photographs, SAP VFs, SD-OCT – RNFL thickness | Machine learning: Bayesian Net, Lazy K Star, Meta Classification—Regression, Meta Ensemble Selection, Alternating Decision Tree, RF Tree, Classification and Regression Tree | 0.56–0.73 | 0.90 | - | 0.82–0.88 | |
| Deep learning | Kim et al. (b)49 | 2017 | 499 (399 training; 100 testing) | SAP VFs, SD-OCT—RNFL thickness | Machine and deep learning: RF, C5.0, SVM, KNN | 0.967–0.983 | 0.95–0.975 | 97–98% | 0.967–0.979 |
| Muhammad et al.50 | 2017 | 102 (57 glaucoma; 45 glaucoma suspect) | SS-OCT, SAP-VFs | Hybrid deep learning: HDLM, RNFL probability map, OCT quadrant analysis, VF | - | - | 63.7–93.1% | - | |
| Christopher et al.51 | 2018 | 235 (179 glaucomatous; 56 healthy) | SAP VFs, SS-OCT | Machine learning: RNFL PCA, Mean cpRNFLt, SAP MD, FDT MD | - | - | - | 0.83–0.95 | |
| Masumoto et al.52 | 2018 | 982 glaucomatous; 417 healthy | Ultrawide fundus photographs, AP VFs | Deep learning: Normal vs all glaucoma, early, moderate, severe | 0.775– 0.909 | 0.753–0.958 | - | 0.830– 0.934 |
Key: ADA = Ada Boost M1, AUC = area under the curve, BAG = bagging, CTREE = classification tree, ENS = ensemble selection, FDT = frequency doubling technology, HDLM = hybrid deep learning model, KNN = k-nearest neighbour, MD = mean deviation, MLP = multi-layer perceptron, NB = Naïve-Bayes, OCT = optical coherence tomography, PCA = principal component analysis, RAN = random forest, RBF = radial basis function, RF = random forest, RNFL = retinal nerve fibre layer, SAP = standard automated perimetry, SD-OCT = spectral domain OCT, SS-OCT = swept source OCT, SVM = support vector machines, SVMG = support vector machine Gaussian, SVML = support vector machine linear, VF = visual fields.
AI and glaucoma
The application of AI in the detection, diagnosis and management of glaucoma includes both machine (before 2016) and deep and/or hybrid learning (from 2016). We examine tools for identification of structural (Table 1) and functional signs (Table 2) of glaucoma, and the combination of the two (Table 3), based on Foster et al.’s6 classification of glaucoma (i.e. a ‘supervised’ model). Structural evidence comprises fundus photographs and OCT-based images, whereas the functional studies address VFs. The studies in Tables 1–3 compare glaucomatous patients with healthy individuals, with algorithms being trained and then tested in a validation phase.
Sensitivity, specificity and the area under the receiver-operating characteristic curve (AUC) are reported as single values and/or the range achieved, depending on the information published for each study. The AUC describes how well the AI method differentiates between two diagnostic groups (disease vs. healthy) or two assessors (AI vs. human). Using a perfect test, the curve will pass through the upper left corner (100% sensitivity and 100% specificity)53 and have an AUC value of 1.0. The closer the AUC result is to 1.0, the higher the diagnostic performance, relative to ground truth.
All studies reviewed have reported AUC values ≥ 0.80, suggesting that AI and deep learning have significant potential in the detection and monitoring of glaucoma. Subjects in these AI studies have however mostly been selected from glaucoma clinics and not the general population and may thus be excluding patients with early undetected glaucomatous disease. Studies that compared the performance of machine learning algorithms to human experts reported consistent, if not superior, results for deep learning. Shibata et al.30, for example, found that the diagnostic performance of their deep learning algorithm was significantly higher than for ophthalmology trainees with AUCs of 0.965 and 0.726–0.912, respectively. Similarly, Goldbaum et al.40, Goldbaum et al.41 and Kim et al.24 compared the performance of machine learning algorithms to glaucoma experts and found that, despite variation in the diagnostic accuracy between ophthalmologists, the algorithms were comparable, if not superior.
Although measures such as sensitivity, specificity and AUC are commonly used in evaluating the potential benefit of machine, deep and hybrid learning, Shah et al.54 have recently highlighted the limitations thereof, given that none of these measures directly address whether AI improves actual patient care. They suggest that a rethink is necessary in terms of how the potential benefit of AI, particularly with regards to patient care, is measured.54 Also, given the improvements in the quality and precision of imaging techniques over the years, the AUC values for one study may not necessarily be comparable to another. Yousefi et al.48, Oh et al.21, Chen et al.22 and Li et al.23 used fundus photography, whereas Burgansky-Eliash et al.18, Haung et al.19, Barella et al.20 and Asaoka et al.33 used TD-OCT. Ran et al.39 used SD-OCT images and found that their 3D deep learning system performed well in the detection of glaucomatous optic neuropathy in both primary and external validations. The studies of Omodaka et al.26, Muhammad et al.50 and Christopher et al.51 used SS-OCT images, which, with greater resolution, may be likely to detect subtle changes.
The studies in Tables 1–3 also show variation in the size of the cohorts used, with some using small cohorts (<100). Burgansky-Eliash et al.’s18 study, for example, included 47 glaucomatous and 42 healthy eyes and Barella et al.20 included 57 glaucomatous and 46 healthy eyes which is likely to introduce bias. These cohort sizes contrast sharply against studies such as that of Wang et al.46 where 44 503 eyes were used.
Another important limitation of the AI studies is the external validity of the deep learning algorithms with regards to real-world populations. Many researchers have trained their algorithms on relatively homogenous datasets25,59 and directly from glaucoma clinics, increasing the risk of Berkson’s bias. The algorithms are most accurate when applied to images or data from a very similar population as that used in the training stage. AI will be less accurate when applied to a population with a different age, racial or socio-demographic makeup.14
Despite the above limitations, it has been postulated that unsupervised deep learning may provide new insights into disease mechanisms.55,58,59 This is of particular interest for prediction of glaucomatous progression (e.g. from suspected to established glaucoma, or from early to late visual loss) as there remains a large element of diagnostic uncertainty. It is possible that the ‘black box’ paradigm could offer new insights. In 2018, Poplin et al.55 published a study that illustrated the potential to identify previously unrecognized features in ophthalmic images. They reported that their deep learning algorithm was able to predict cardiovascular risk factors that were previously unknown to be present or quantifiable in retinal images, including age (with a mean absolute error within 3.26 years) and sex (AUC 0.97), something that humans cannot do. In the same year, Kazemian et al.56 also published a paper describing the first clinical decision-making tool that is able to generate a personalized prediction of an individual’s glaucoma disease trajectory at different target IOPs, using VF and tonometric data. Previous applications of deep learning in glaucoma have been limited to classification rather than forecasting. However, in a recent study, Wen et al. (2018)57 found that deep learning networks, using real-world datasets, not only had the ability to recognize and classify patterns of glaucomatous VF loss but also generate predictions for future VFs up to 5.5 years, from a single VF with a correlation of 0.92 between the mean deviation of predicted and actual future Humphry Visual Fields (HVF). Further research, including prospective longitudinal studies, is needed to substantiate this preliminary finding. It is hoped that deep learning programmes may reveal unrecognized features in retinal images that will enhance our detection, diagnosis, monitoring and management of glaucoma, and also improve the cost effectiveness in healthcare systems.
Unsupervised deep learning methods may produce results that challenge current practice. For example, ophthalmologists grade the severity of retinal disease based on agreed guidelines. Deep learning computational processes do not adhere to set guidelines but instead are developed by the computer through pattern recognition through thousands of training images such as the trials of Ting et al.25, Li et al.29 and Medeiros et al.36, which used data inputs in excess of 32 000 images. Although deep learning algorithms have proven to be highly sensitive and specific, it is possible that computers may incorporate non-retinal related features such as artefact,59 poor pupillary dilation or the presence of a media opacity into their analyses, which may possibly confound the results.14 Some concern has been raised by physicians and patients that the ‘black box’ paradigm may leave us in the dark as to how the algorithm has reached its results,58 i.e. the algorithms identify and extract relevant features independently and learn from these until an optimal performance is achieved. Further work by human investigators will be necessary to clarify new patterns detected using this method in order to gain a fuller understanding, acceptance and implementation into routine clinical practice.60 In order to translate AI clinically, the scope and breadth of its use alongside current assessment needs to be considered. Some patients may also perceive the use of personalized health data as an invasion of privacy. The challenge therefore is for clinicians to act as the interpreter between AI and the patient.
Unlike the best human clinicians, current AI programs are unable to take a holistic approach to patient care (i.e. consider all ophthalmic diseases or medical conditions, as well as patient treatment preferences) or consider other external contributing factors to management such as social and psychological aspects.61 Some have raised concern that increased reliance on automated image analysis may lead to deskilling of clinicians,61 which may hinder future clinicians’ ability to make decisions based on clinical signs.61 It can however be argued that deep learning could be a valuable training tool for junior doctors and an adjunct for more challenging cases where there is diagnostic uncertainty or where a second opinion is desirable. Deep learning may also help reduce human error14, thereby raising consistency across medical professionals. Over-reliance on technology may potentially be harmful at times if/when technology fails, and ‘output’ is accepted without question. There are clear medico-legal implications in this scenario.62 As AI enters medical practice, physicians will need to know and understand how the law will assign liability for injuries that arise from interaction between algorithms and practitioners.62
Deep learning programmes require large datasets for training and testing of the algorithm. However, infinitely increasing the size of the dataset used may not necessarily improve the diagnostic performance of the algorithm and instead may increase the risk of false connections forming.10 As highlighted above, it is possible that the algorithms are incorporating non-retinal related features.14,59 It also does not necessarily follow that the addition of a large input of healthy participant data will improve the diagnostic performance.10 There is also the added complexity of multiple ocular pathologies coexisting. Clear guidance for the optimal number of cases needed for training is needed.10 Future work is also needed to optimize the ability of algorithms to differentiate glaucomatous optic neuropathy from both healthy eyes and those with other ocular comorbidities such as age-related macular degeneration, diabetic retinopathy, hypertensive retinopathy, optic disc drusen and swollen optic nerve heads in addition to also monitoring the progression of the disease. The performance and external validity of AI will depend on a myriad of features in the training dataset.10
AI and deep learning techniques offer a tantalizing promise of more precise and earlier detection of sight-threatening disease. This would focus the attention of both patient and ophthalmologist on the importance of compliance with treatment and maintaining follow up14. Earlier detection and more intensive, personally targeted treatment of glaucoma may help slow or arrest the disease progression and allow patients to maintain their independence, their career and driving licence for longer. On a national scale, this may provide a more cost effective14 approach as fewer people will be reaching more advanced stages of the disease, thereby minimizing the care costs and lost tax revenue. If those at high risk can be reliably identified, low risk individuals could avoid unnecessary ‘medicalization’.
An additional, empowering concept is a marriage of AI with telemedicine,10 in which the telecommunications allow for remote diagnosis and treatment of patients, particularly in rural areas. This combination offers enormous healthcare benefits on a global scale, in particular to poorer, non-industrialized countries. However, although AI holds great promise, it is unlikely that it will replace human interpretation entirely but rather serve as an adjunct in the diagnosis and management of glaucoma patients. AI will cause a revolution in healthcare, and transform the relationship between doctor and patient, and require the medical profession to embrace new ways of working, and the need to acquire new skills.
Conclusion
Glaucoma is the most frequent cause of irreversible blindness worldwide. There is currently no cure, but early detection and more intensive treatment of glaucoma can slow progression and help prevent loss of vision. Significant advances in ophthalmic imaging in recent years present both opportunities from more detailed images, and challenges from the demand for sophisticated image interpretation. There is also a need to reduce medicalization of the large number of people who will not lose vision in their lifetime, and thereby reduce the burden on healthcare services and budgets, while improving quality of life. AI tools for image analysis could help achieve all of these goals.
AI has sparked considerable global interest in recent years. Developing machine algorithms that can emulate human intelligence, analyze images and reach diagnostic end points holds great power for the field of medicine. The current literature review shows promise for the use of AI in automating glaucoma detection and more sophisticated monitoring of glaucoma. There are a number of limitations that still need to be addressed before AI can be integrated into clinical practice. Despite these limitations, AI has the potential to revolutionize the future management of glaucoma in adults.
