


Abstract
An on-going debate surrounds the relationship between specific language impairment and developmental dyslexia, in particular with respect to their phonological abilities. Are these distinct disorders? To what extent do they overlap? Which cognitive and linguistic profiles correspond to specific language impairment, dyslexia and comorbid cases? At least three different models have been proposed: the severity model, the additional deficit model and the component model. We address this issue by comparing children with specific language impairment only, those with dyslexia-only, those with specific language impairment and dyslexia and those with no impairment, using a broad test battery of language skills. We find that specific language impairment and dyslexia do not always co-occur, and that some children with specific language impairment do not have a phonological deficit. Using factor analysis, we find that language abilities across the four groups of children have at least three independent sources of variance: one for non-phonological language skills and two for distinct sets of phonological abilities (which we term phonological skills versus phonological representations). Furthermore, children with specific language impairment and dyslexia show partly distinct profiles of phonological deficit along these two dimensions. We conclude that a multiple-component model of language abilities best explains the relationship between specific language impairment and dyslexia and the different profiles of impairment that are observed.
Introduction
Specific language impairment (SLI) and developmental dyslexia (henceforth, dyslexia) are developmental disorders of communication that affect a sizeable proportion (∼7–10%) of the school-aged population (Tomblin et al., 1997; Snowling, 2000). SLI manifests itself as a difficulty in acquiring language despite otherwise normal intellectual functioning, normal hearing and an adequate learning environment (Leonard, 1998). Children with SLI have deficits in syntax, morphology, phonology and the lexicon, although the precise characteristics of these deficits differ cross-linguistically (Leonard, 1998). In English-speaking children, grammatical deficits are characteristic of SLI. These manifest as a deficit in tense marking that results in the omission of the past tense ‘-ed’, third person singular ‘-s’, ‘be’ and ‘do’ (Loeb and Leonard, 1991; Rice and Wexler, 1996; Oetting and Horohov, 1997; van der Lely and Ullman, 2001); a deficit in thematic role assignment (who does what to whom in sentences) resulting in problems understanding and producing reversible passive or embedded sentences, or assigning reference to him or himself (Bishop, 2003; van der Lely, 2005); and a deficit in ‘wh-’ questions (Fonteneau and van der Lely, 2008). A second characteristic of SLI is poor performance on non-word repetition tasks, which is interpreted as reflecting deficits in phonology and in verbal short-term memory (Gathercole and Baddeley, 1990; van der Lely and Howard, 1993; Montgomery, 1995; Gallon et al., 2007).
Dyslexia is a difficulty in learning to read alongside similar exclusionary criteria as SLI (Snowling, 2000). There is widespread agreement that children with dyslexia have phonological impairments. Indeed, dyslexic children are poor at phonological awareness tasks such as phoneme manipulation (Bradley and Bryant, 1978, 1983; Joanisse et al., 2000; Catts et al., 2005), and have poor verbal short-term memory as measured by tasks such as digit span and non-word repetition (Snowling, 2000; Szenkovits and Ramus, 2005). They are also slow at rapid automatized naming tasks, which index speed of access to familiar lexical items and their phonological representations (Denckla and Rudel, 1976; Wolf and Bowers, 1999).
There is substantial heterogeneity in both groups (Leonard, 1998; Joanisse et al., 2000; Bailey et al., 2004). Furthermore, many children diagnosed with SLI are also dyslexic, and vice versa (McArthur et al., 2000; Bishop and Snowling, 2004; Catts et al., 2005).
Phonological deficits play a prominent role in theories of both dyslexia and SLI. Within the literature on dyslexia, there is widespread agreement that phonological deficits are the direct cause of the reading impairment, at least for a majority of dyslexic children (Vellutino, 1979; Frith, 1985; Snowling, 2000). Even alternative theories acknowledge a phonological deficit as a crucial mediator between other factors and reading impairment (Tallal, 1980; Nicolson et al., 2001; Stein, 2001). With respect to SLI, at least two prominent theories rely on phonological deficits: either as a mediator between disrupted auditory processing and broader language impairment (Tallal and Piercy, 1973; Tallal, 2003), or in the form of a verbal short-term memory deficit affecting morphosyntactic processing and lexical learning (Gathercole and Baddeley, 1990). Alternatively, some theories of dyslexia (Ahissar, 2007; Vidyasagar and Pammer, 2010) and of SLI (van der Lely, 2005) do not feature a phonological deficit as a necessary ingredient of these disorders. The question of the prevalence, nature and causal role of phonological deficits is therefore of high theoretical importance for both dyslexia and SLI, and their overlap (Messaoud-Galusi and Marshall, 2010; van der Lely and Marshall, 2010).
The fact that children with both SLI and dyslexia show phonological deficits raises an intriguing question. If a phonological deficit causes reading impairment in dyslexia, and if the same causes produce the same effects in SLI, then children with SLI should also have reading impairments and should qualify for a diagnosis of dyslexia. But, are all children with SLI also dyslexic? There are reasons to believe that this is not the case, and that SLI may occur in the absence of dyslexia (Catts et al., 2005; Kelso et al., 2007; Bishop et al., 2009). This should lead one to conclude either that not all children with SLI have a phonological deficit, or that children with SLI and dyslexia have partly different types of phonological deficits (Pennington and Bishop, 2009). Indeed, there is some evidence that children with SLI who are not dyslexic tend to have at least milder phonological deficits, if any (Catts et al., 2005; Kelso et al., 2007; Bishop et al., 2009). To our knowledge, only one published study more specifically compared the profiles of phonological deficit between SLI and dyslexia, and suggested that rapid automatized naming was weaker in children with dyslexia than in children without (Bishop et al., 2009). However, that study included a relatively sparse battery of phonological tests at 9 years of age, with phonological awareness tests particularly lacking. Thus, there is a clear need to further explore and systematically compare the nature of phonological deficits in both dyslexia and SLI.
In this article, we consider three models of the relationship between phonological deficits, SLI and dyslexia. We use the classification from Catts et al. (2005), and illustrate them in Fig. 1 using the two-dimensional framework of Bishop and Snowling (2004).
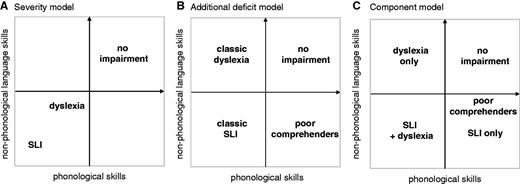
Three models of the relationship between SLI and dyslexia, according to performance along non-phonological and phonological language skills. (A) Severity model, (B) additional deficit model and (C) component model.
According to some authors, the same speech processing and phonological deficits that cause language deficits in SLI also cause reading deficits in dyslexia. Thus, the difference between the two disorders is one of degree—the phonological deficit is more severe in SLI than it is in dyslexia (Kamhi and Catts, 1986; Tallal, 2003). For the purposes of this article, we call this the ‘severity model’ (Fig. 1A).
Another view is that SLI and dyslexia are qualitatively different, and that SLI is a multifactorial disorder. For example, Bishop and Snowling (2004) propose that a phonological deficit is the cause of dyslexia, and that children with SLI have this phonological deficit plus an additional deficit that causes their language impairment. We term this the ‘additional deficit model’ (Fig. 1B). The additional deficit model is similar to the severity model in that it hypothesizes a common underlying phonological deficit in dyslexia and SLI, but is different in that SLI is seen as qualitatively different to dyslexia, not just a severe form of it.
A third possible view is that dyslexia and SLI are entirely distinct disorders, each with its own cause. The fact that they co-occur more frequently than would be expected if they were independent is acknowledged, but is attributed to comorbidity at the aetiological level (Catts et al., 2005). This category includes more modular models of dyslexia and SLI, according to which each component of the language system may be, to some extent, selectively disrupted (Ramus, 2004; van der Lely, 2005). According to these models, phonological deficits are not necessarily found in SLI, and if they are, they are not necessarily the same as those in dyslexia. Furthermore, like the additional deficit model, phonological deficits are not thought to be necessarily causally related to syntactic and morphological deficits. For the purpose of this article, we term this class of models the ‘component model’ (Fig. 1C).
The present study is based on a population of children with either dyslexia, SLI, dyslexia and SLI, or neither. We administered each child with a large battery of tests including psychometric tests, tests of phonology, syntax, morphosyntax, vocabulary and prosody. In light of the questions raised above, we have included a particularly large and diverse array of phonological tests. Earlier analyses of some of the data reported here have been previously published (Marshall and van der Lely, 2009; Marshall et al., 2009, 2011). Here, our main analytical approach is to perform a factor analysis of all children’s performance in all the tests, and to compare the results with the predictions of each model. More specifically, we ask: (i) Do all children with SLI meet diagnostic criteria for dyslexia? Or do some children with SLI-only exist? (ii) How many independent sources of variance of language abilities underlie the differences between SLI, dyslexia and control children? (iii) Do they match with the two dimensions proposed by Bishop and Snowling (2004) (non-phonological language skills and phonological skills, respectively)? (iv) How do the different categories of children situate themselves along the different dimensions? and (v) Do children with SLI and children with dyslexia show the same pattern of phonological deficits?
We now specify the predictions of the three models as follows: the ‘severity model’ predicts that children with SLI always have dyslexia, and therefore that children with SLI-only do not exist. It also predicts that the factor analysis should yield a single factor (or, if more, that the additional factors will be irrelevant to distinguishing the different groups of children). Moreover, it predicts that children with SLI, children with dyslexia and control children can be differentiated by their performance along this single dimension. Finally, children with SLI will have phonological deficits of the same nature as dyslexic children, although more severe.
The ‘additional deficit model’ predicts that children with ‘classic’ SLI always have dyslexia, and therefore that children with SLI-only do not exist. It also predicts that the factor analysis should yield at least two factors, and that the first two factors should identify with non-phonological language skills and phonological skills. It predicts that children with SLI and dyslexia can be differentiated along the two dimensions as shown in Fig. 1B. Finally, it predicts that both clinical groups have similar phonological deficits, but makes no claims as to whether these are more severe among children with SLI.
The ‘component model’ predicts that SLI and dyslexia are partly independent, so that some children with SLI have dyslexia, and some do not (SLI-only). It also predicts that the factor analysis should yield at least two factors. If two dimensions match those of Bishop and Snowling’s (2004) two-dimensional model, children with SLI and dyslexia, SLI-only, dyslexia-only and control children are expected to differentiate themselves as shown in Fig. 1C. In particular, this model predicts that children with SLI-only will not necessarily have phonological deficits, and that if they do, these will not necessarily be of the same nature as those of dyslexic children.
Note that poor comprehenders are shown in Fig. 1 for the sake of completeness, but are not included in this study and will therefore not be taken into account for the test of the three models.
Materials and methods
Test battery
Details of the tests used for non-verbal cognition, literacy, language (not including phonology) and phonology are provided in Box 1.
Non-verbal cognition
Raven’s Standard Progressive Matrices (Raven, 1998).
British Ability Scales 2, block design subtest (Elliott, 1996).
Literacy
Wechsler Objective Reading Dimensions, all three subtests (Wechsler, 1990): reading, a test of single word reading (phonologically regular and irregular words); spelling, a test of single word spelling (phonologically regular and irregular words); reading comprehension, a test of sentence/short paragraph reading and comprehension.
Phonological Assessment Battery, non-word reading subtest (Frederickson et al., 1997).
Language (except phonology)
Test for the Reception of Grammar 2 (Bishop, 2003), a test of sentence comprehension.
British Picture Vocabulary Scales 2 (Dunn et al., 1997), a test of single word comprehension.
Clinical Evaluation of Language Fundamentals 3, sentence repetition subtest (Semel et al., 1995), a test of sentence production.
Test of Word-Finding 2 (German, 2000), a test of single word production.
Verb Agreement and Tense Test (van der Lely, 2000), a morphosyntactic and syntactic elicitation test of third person agreement and past tense marking on regular and irregular verbs.
Test of Active and Passive Sentences (van der Lely, 1996), a syntactic test of reversible active and passive sentence comprehension.
Advanced Syntactic Test of Pronominal Reference (van der Lely, 1997), a yes/no picture judgement task tapping syntactic knowledge of sentential co-reference of reflexive and pronouns (e.g. himself, him). This test yields two separate scores: a reflexive d’ (sensitivity to reflexive mismatch) and a syntactic d’ (sensitivity to syntactic mismatch).
Phonology
Phonological Assessment Battery (Frederickson et al., 1997), three subtests: Rhymes and Spoonerisms, measuring phonological awareness; and Digit naming, measuring rapid automatized naming.
Wechsler Intelligence Scales for Children 3, forwards and backwards digit span subtest, measuring verbal short-term and working memory (Wechsler, 1992).
Profiling Elements of Prosodic Systems–Child version (Peppé and McCann, 2003), six subtests: chunking input, chunking output, focus input, focus output, prosody input and prosody output. These tests measure prosodic and melodic perception and production, and their use for linguistic disambiguation.
Non-word repetition—a new experimental task consisting of 40 items with CVCVC structure (CV: consonant vowel), half with stress on the first syllable and half with stress on the second. This test was meant to test the integrity of segmental phonological representations without loading excessively on verbal short-term memory.
Non-word discrimination—a new experimental task with ABX format, where the child had to judge whether non-word X matched A or B, and where all non-words were of CVCVC structure and A and B differed by just a single phoneme (64 trials). A and B were uttered by a male voice, whereas X was uttered by a female voice, to ensure that the task was performed on the basis of abstract phonological (rather than acoustic) differences. This test was meant to test the integrity of segmental phonological representations, without involving overt output.
Picture–word matching—a new experimental task where the child saw pairs of pictures whose names had (C)V(C) structure and differed by just one phoneme (48 trials). The child heard one of those words, and then had to choose which picture matched the word (see Marshall et al., 2011 for further details).
Articulation—a new experimental task whereby the child was asked to name 38 pictures the labels of which were words with early ages of acquisition and simple syllable structure. Phonemes correctly pronounced were scored.
Ood–oot classification—a new experimental task of speech categorization, cast within the framework of an ABX task. The task for the child was to decide whether non-word X was the same as non-word A (always ‘ood’) or B (always ‘oot’). A and B were uttered by a male voice, whereas X was uttered by a female voice, to ensure that the task was performed on the basis of phonological (rather than acoustic) differences. X was on a continuum from ‘ood’ to ‘oot’ that varied both the length of the vowel before the consonant (in 5-ms intervals) and the frequency of the second formant. The continuum was sampled using an adaptive procedure (Baker and Rosen, 2001). The categorization function was derived from all trials in a particular test, and the slope was estimated by logistic regression. This test was meant to assess the categorical perception of voicing, in a form most relevant for the perception of tense marking.
Treatment of variables
All variables derived from national norms were converted into Z-scores [mean (standard deviation, SD): 0 (1)]. For all the other variables, to remove age- and non-verbal IQ-related variance, raw scores were regressed along age and non-verbal IQ (composite measure of Raven’s Standard Progressive Matrices and British Ability Scales 2), and the residuals were then converted into Z-scores relative to the control group.
Participants
We selected children aged 8–12 years for the SLI and dyslexic groups and aged 5–12 years for the typically developing control group. Ethical approval was obtained from the UCL/UCLH ethics research committee, and informed written consent was obtained for each child. All children had to achieve a minimum standard score of 80 on each of the two tests of non-verbal cognition, and an average combined score of at least 85 (i.e. better than 1 SD below the mean). All control children had to achieve a standard score of ≥85 on every standardized language and literacy task to be included in the group, and have no history of a speech or language delay or any other special educational need. For children with SLI and dyslexia, the following criteria were applied.
A formal diagnosis of SLI but no additional diagnosis of attention deficit and hyperactivity disorder, autistic spectrum disorder or dyspraxia, attendance at a special school/unit for children with SLI and a standard score of ≤78 (i.e. seventh percentile, Z-score of −1.5) on one or more of the following language tests: Test for the Reception of Grammar 2, British Picture Vocabulary Scales 2, Clinical Evaluation of Language Fundamentals 3–sentence repetition and Test of Word-Finding 2.
A formal diagnosis of dyslexia but no additional diagnosis of attention deficit and hyperactivity disorder, autistic spectrum disorder or dyspraxia, attendance at a special school/unit for children with dyslexia (with the exception of one child, who is in mainstream school) and a standard score of ≤78 on the single word reading subtest of the Wechsler Objective Reading Dimensions.
We initially recruited children referred as having either SLI or dyslexia (or both), and then we applied both sets of diagnostic criteria to each individual. Many, but not all, children fulfilled both sets of criteria with regards to standardized test scores, although they may have had a diagnosis of just one. Children who fulfilled our criteria for both SLI and dyslexia were allocated to the ‘SLI + dyslexia' group.
Based on the results of the standardized tests, we selected 129 children to take part in the study: 30 with SLI and dyslexia, 13 with SLI-only, 21 with dyslexia-only and 65 control children. The broad age range of control children was such that they covered the large range of language abilities of clinical children, with one group matched on age and another group of younger children matched on various language and literacy measures, as detailed in Marshall et al. (2011). Because all the variables considered are standardized with respect to age, the two control groups are treated as one for the purpose of the present analyses.
Table 1 provides details of each participant group on non-verbal cognition, standardized language and literacy tests. Table 2 shows each group’s performance on the phonological and syntax/morphosyntax tasks.
Results of each group of participants on diagnostic variables
| Variables | SLI with dyslexia (n = 30) | SLI-only (n = 13) | Dyslexia-only (n = 21) | Controls (n = 65) |
|---|---|---|---|---|
| Mean (SD) | Mean (SD) | Mean (SD) | Mean (SD) | |
| Age | 11.22a (1.17) | 11.04a (1.55) | 10.82a (1.20) | 8.93b (2.02) |
| Non-verbal IQ | 92.67a (5.45) | 98.21a,b (8.82) | 103.07b,c (10.45) | 109.53c (12.02) |
| Word reading | −2.05a (0.45) | −0.42b (0.84) | −1.79c (0.32) | 1.08d (0.82) |
| Non-word reading | −1.03a (0.56) | −0.13b (0.57) | −0.44a (0.60) | 0.87c (0.64) |
| Word spelling | −1.93a (0.41) | −0.52b (0.52) | −1.67a (0.52) | 0.80c (0.83) |
| Reading comprehension | −2.34a (1.26) | −1.19b (0.68) | −1.78a,b (0.69) | 0.90c (0.85) |
| BPVS vocabulary | −1.22a (0.77) | −0.73a (0.80) | 0.08b (0.64) | 0.56c (0.65) |
| Test of word finding | −2.22a (0.62) | −1.43b (0.75) | −0.28c (0.72) | 0.36d (0.77) |
| TROG sentence comprehension | −1.57a (0.92) | −0.87b (0.82) | 0.03c (0.69) | 0.52c (0.69) |
| CELF sentence repetition | −2.18a (0.24) | −2.03a (0.40) | −0.43b (0.75) | 0.34c (0.69) |
All variables in Z-scores, except age (years) and IQ (standard IQ units).
Means carrying the same superscript (a, b, c, d) are not significantly different at the P = 0.05 level after Bonferroni correction.
BPVS = British Picture Vocabulary Scales 2; CELF = Clinical Evaluation of Language Fundamentals 3; TROG = Test for the Reception of Grammar 2.
Results of each group of participants on additional language tests
| Variables | SLI with dyslexia | SLI-only | Dyslexia-only | Controls |
|---|---|---|---|---|
| Mean (SD) | Mean (SD) | Mean (SD) | Mean (SD) | |
| Test of active/passive sentences | −1.39a (1.26) | −1.36a (1.26) | 0.06b (0.58) | 0.06b (0.87) |
| Verb agreement and tense test | −3.90a (2.02) | −2.65b (1.73) | −0.63c (0.80) | 0.01c (0.77) |
| ASTOP reflexive d’ | −1.09a (1.09) | −0.50a,b (1.18) | −0.06b (0.81) | 0.00b (0.98) |
| ASTOP syntactic d’ | −1.97a (1.04) | −0.76b (1.42) | −0.33b (0.94) | 0.00b (0.98) |
| PHAB Rhyme | −1.54a (0.52) | −0.24b (0.63) | −0.80b (1.07) | 0.63c (0.57) |
| PHAB Spoonerisms | −1.18a (0.53) | −0.34b (0.77) | −0.62b (0.57) | 0.82c (0.62) |
| PHAB rapid digit naming | −1.08a (0.70) | −0.48a (0.87) | −0.88a (0.89) | 0.58b (0.88) |
| Digit span | −2.00a (0.59) | −1.72a (0.88) | −1.53a (0.55) | 0.00b (0.94) |
| Non-word repetition | −5.40a (5.52) | −2.73b (3.08) | −0.99b,c (2.00) | 0.00c (0.87) |
| ABX non-word discrimination | −2.32a (1.15) | −1.34b (0.96) | −1.18b (1.20) | 0.00c (0.83) |
| Picture–word matching | −0.39a (0.47) | −0.23a,b (0.35) | −0.02b (0.27) | 0.00b (0.46) |
| Articulation | −1.11a (1.84) | −1.05a,b (1.78) | −0.44a,b (0.84) | 0.00b (0.98) |
| Ood–oot categorization | −0.80a (0.43) | −0.83a (0.37) | −0.61a (0.65) | 0.00b (0.98) |
| PEPSC chunking input | −1.02a (1.11) | −0.87a (0.77) | −1.03a (0.73) | 0.00b (0.98) |
| PEPSC chunking output | −0.86a (1.15) | −0.36a,b (0.79) | −0.22a,b (0.91) | 0.00b (0.98) |
| PEPSC focus input | −1.05a (0.79) | −1.18a (0.90) | −1.30a (1.05) | 0.00b (0.98) |
| PEPSC focus output | −1.41a (1.58) | −1.49a (1.54) | −0.56a,b (1.12) | 0.00b (0.98) |
| PEPSC prosody input | −0.98a (1.75) | 0.19a,b (0.49) | −0.57a,b (1.79) | 0.00b (0.98) |
| PEPSC prosody output | −0.84a (1.58) | 0.32b (0.88) | −0.87a (1.44) | 0.00b (0.98) |
All variables in Z-scores, relative to national norms for the Phonological Assessment Battery, and to the control group for all other tests.
Means carrying the same superscript (a, b, c) are not significantly different at the P = 0.05 level after Bonferroni correction.
ASTOP = Advanced Syntactic Test of Pronominal Reference; PEPSC = Profiling Elements of Prosodic Systems–Child version; PHAB = Phonological Assessment Battery.
Results
Principal component analysis
The data set for factor analysis included 23 language variables and 121 participants with data for all variables (the eight youngest children were excluded because they were not administered the main phonological skills tests). Thus, the participant-to-variable ratio is >5, meeting usual standards for factor analysis (Hatcher, 1994; Bryant and Yarnold, 1995). We ran a principal components analysis followed by a Varimax rotation on this data set. Extracted communalities were high (>0.5 for all but two variables; Supplementary Table 1), showing that most variables shared a substantial amount of variance.
Five factors had eigenvalues >1. Examination of the scree plot did not provide obvious reasons to alter the number of factors. Supplementary Table 2 shows the initial component matrix, and Table 3 shows the rotated component matrix. To highlight the factor structure, the highest loading per variable is set in bold.
Rotated component matrix
| Variables | Non-phonological language skills | Phonological skills | Phonological representations | Prosody perception | Melodic skills |
|---|---|---|---|---|---|
| BPVS vocabulary | 0.722 | 0.340 | 0.326 | 0.125 | 0.115 |
| Test of word finding | 0.645 | 0.451 | 0.344 | 0.206 | 0.065 |
| TROG sentence comprehension | 0.718 | 0.305 | 0.283 | 0.264 | 0.128 |
| CELF sentence repetition | 0.603 | 0.485 | 0.244 | 0.294 | −0.009 |
| Test of active/passive sentences | 0.823 | 0.172 | 0.030 | 0.024 | 0.056 |
| Verb agreement and tense test | 0.687 | 0.406 | 0.412 | 0.171 | 0.129 |
| ASTOP reflexive d’ | 0.640 | 0.030 | −0.009 | 0.227 | 0.478 |
| ASTOP syntactic d’ | 0.680 | 0.247 | 0.109 | 0.190 | 0.439 |
| PHAB Rhyme | 0.395 | 0.628 | 0.301 | 0.171 | 0.115 |
| PHAB Spoonerisms | 0.265 | 0.755 | 0.265 | 0.307 | 0.139 |
| PHAB rapid digit naming | 0.105 | 0.747 | 0.178 | 0.303 | 0.169 |
| Digit span | 0.439 | 0.513 | 0.226 | 0.265 | 0.114 |
| Non-word repetition | 0.307 | 0.295 | 0.763 | −0.031 | 0.207 |
| ABX non-word discrimination | 0.456 | 0.443 | 0.464 | 0.267 | 0.255 |
| Picture–word matching | 0.468 | −0.089 | 0.469 | 0.193 | 0.221 |
| Articulation | 0.136 | 0.179 | 0.811 | −0.013 | −0.092 |
| Ood–oot categorization | 0.132 | 0.397 | 0.233 | 0.273 | 0.178 |
| PEPSC chunking input | 0.266 | 0.190 | −0.042 | 0.808 | −0.060 |
| PEPSC chunking output | 0.405 | 0.168 | 0.234 | 0.057 | −0.199 |
| PEPSC focus input | 0.123 | 0.265 | 0.052 | 0.772 | 0.224 |
| PEPSC focus output | 0.438 | 0.642 | −0.203 | −0.229 | 0.108 |
| PEPSC prosody input | 0.021 | 0.218 | 0.349 | −0.068 | 0.650 |
| PEPSC prosody output | 0.166 | 0.159 | −0.098 | 0.159 | 0.820 |
The highest loading per variable is highlighted in bold.
ASTOP = Advanced Syntactic Test of Pronominal Reference; BPVS = British Picture Vocabulary Scales 2; CELF = Clinical Evaluation of Language Fundamentals 3; PEPSC = Profiling Elements of Prosodic Systems–Child version; PHAB = Phonological Assessment Battery; TROG = Test for the Reception of Grammar 2.
Factor loadings after Varimax rotation yield relatively straightforward interpretations for at least the first three factors.
Factor 1 shows a clear pattern of high loadings on all tests tapping lexical, morphological and/or syntactic skills, and was therefore named ‘non-phonological language skills’. It explains 23% of the variance.
Factor 2 shows high loadings on phonological awareness, rapid naming and verbal short-term memory tasks, and was therefore named ‘phonological skills’. The only other high loading of Factor 2 is on the Profiling Elements of Prosodic Systems–Child version focus output test, which involves control of prosody in speech production, but is not classically recognized as a phonological skill in the same sense as the other four variables. Ood–oot categorization has its highest load on Factor 2 as well, although the value is low, suggesting that it plays a rather minor role within this data set. Factor 2 explains an additional 16.5% of the variance.
Factor 3 loads most highly on four tasks involving the accurate production or discrimination of simple words or non-words, and was therefore named ‘phonological representations’. The interpretation of this second phonological factor will be further addressed in the ‘Discussion’ section. It explains an additional 12% of the variance.
Factor 4 loads on two Profiling Elements of Prosodic Systems–Child version tasks: chunking input and focus input, both involving the perception of prosodic cues for syntactic or semantic disambiguation, that is, the higher levels of the phonological hierarchy of prosodic utterance and prosodic phrase. Factor 4 was therefore tentatively named ‘prosody perception’. It explains an additional 9% of the variance.
Finally, Factor 5 loads on the two Profiling Elements of Prosodic Systems–Child version prosody (input and output) tasks, which involve the discrimination and repetition of prosodic pitch contours. Factor 5 was renamed ‘melodic skills’ because only melodic, not linguistic, aspects of prosody play a role in these two tasks. It explains an additional 8.5% of the variance.
The five factors explain together 69% of the variance.
The present analysis suggests, in agreement with Bishop and Snowling (2004), that non-phonological and phonological language skills are the two main sources of variance in language abilities among SLI, dyslexia and control children. In addition, performance in a separate set of phonological tasks provides a third distinct source of variance. Finally, prosodic and melodic skills may represent two additional sources of variance.
Given that prosodic and melodic skills are not our main interest here, and that the introduction of six Profiling Elements of Prosodic Systems–Child version variables might disproportionately distort the factor analysis, we reran the same principal components analysis restricted to the 17 language tasks, excluding Profiling Elements of Prosodic Systems–Child version tasks. Although the loadings obtained differed to some extent (as one would expect), our main result remained. We obtained three distinct factors representing non-phonological languages skills, phonological skills and phonological representations accounting for 28.3%, 26.4% and 15.3% of variance, respectively. This result, therefore, seems robust to the addition or removal of less relevant variables. In the remainder of the article, we exclude the six Profiling Elements of Prosodic Systems–Child version tasks.
Furthermore, we also tested different approaches to factor analysis, including oblique (oblimin) rotations, as well as principal axis factorization, and in all cases, the main result remained, i.e. there were three linguistic factors, two of which were for distinct sets of phonological tasks.
Theory-driven components
The exploratory factor analysis was used to reveal the main sources of variance underlying our data. However, we can see two main reasons to refrain from analysing directly the resulting factors. Firstly, the Varimax rotation produces orthogonal factors, the interpretation of which is easiest, but it is unrealistic to assume that different types of language skills do not correlate. We already know that they do. Although this could, to some extent, be fixed by using an oblique rotation procedure, the second issue is that factors extracted by factor analysis bear many small loadings on variables that are irrelevant to the theoretical interpretation of the factors, but that may nevertheless have an impact on the results. Therefore, the data-driven approach having revealed three clearly interpretable sources of linguistic variance, we now find it preferable to redefine those factors in a more theory-driven manner (thus forming components) for the purpose of further analysis.
We computed three components as average Z-scores of the following variables (from the 17 tasks excluding Profiling Elements of Prosodic Systems–Child version), renormalized according to the mean and standard deviation of the control subjects.
1. Non-phonological language skills: British Picture Vocabulary Scales 2–vocabulary, Test of word finding 2, Test for the Reception of Grammar 2–sentence comprehension, Clinical Evaluation of Language Fundamentals 3–sentence repetition, Test of active/passive sentences, Verb agreement and tense test, Advanced Syntactic Test of Pronominal Reference–reflexive d’ and Advanced Syntactic Test of Pronominal Reference–syntactic d’.
2. Phonological skills: Phonological Assessment Battery–Rhyme, Phonological Assessment Battery–Spoonerisms, Phonological Assessment Battery–rapid digit naming, Digit span.
3. Phonological representations: Non-word repetition, ABX non-word discrimination, Picture–word matching, Articulation, Ood–oot categorization.
To test whether these newly defined components still support the distinction between two phonological dimensions, we used confirmatory factor analysis to compare two models. Model 1 is the three-component model indicated above. Model 2 is a two-component model, with the first component identical to that of Model 1, and the second component composed of all phonological tasks. A χ2 test yielded values of 336.4 (df = 118) for Model 1 and 303.8 (df = 116) for Model 2. Crucially, a χ2 difference test (Schermelleh-Engel et al., 2003) to directly compare the fit of the two models with the data yields a value of 32.6 (df = 2), showing that the three-component model fits the data significantly better than the two-component model (P < 0.0001).
Table 4 and Fig. 2 present means and standard errors of each component for each group. For each component, we ran an ANOVA, with ‘Group’ as independent variable, and we explored group differences using a post hoc analysis with a Bonferroni correction. There was a highly significant group effect on all three components [F(3,128) > 32, P < 0.001)]. For non-phonological language skills, all groups significantly differed from each other (P < 0.03). For phonological skills, all group differences were significant (P ≤ 0.005) except the comparison between the SLI-only and dyslexia-only groups (P = 0.88). For phonological representations, all group differences were significant (P ≤ 0.05) except the comparison between the SLI-only and dyslexia-only groups (P = 0.49) and between the SLI-only and SLI + dyslexia groups (P = 0.097).
Summary of theory-driven components for each group
| Component | SLI with dyslexia | SLI-only | Dyslexia-only | Controls |
|---|---|---|---|---|
| Mean (SD) | Mean (SD) | Mean (SD) | Mean (SD) | |
| Non-phonological language skills | −4.44a (1.60) | −3.11b (1.45) | −0.86c (0.91) | 0.00d (1.00) |
| Phonological skills | −3.44a (0.71) | −2.08b (1.03) | −2.55b (0.81) | 0.00c (1.00) |
| Phonological representations | −4.30a (3.42) | −2.65a,b (2.53) | −1.39b (1.39) | 0.00c (1.00) |
All variables in Z-scores.
Means carrying the same superscript are not significantly different at the P = 0.05 level after Bonferroni correction.
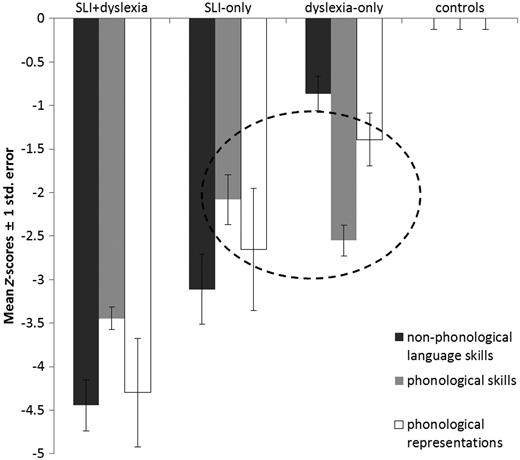
Mean and standard error of theory-driven components for each group. The circle highlights an interaction of interest between group and factor.
Interestingly, although the SLI-only and dyslexia-only groups did not significantly differ on either phonological component, the figure reveals a different pattern of performance (highlighted by the circle in Fig. 2). Whereas the SLI-only group shows similar performances in the two components (with a non-significant trend in the direction of better performance in phonological skills), the dyslexia-only group clearly fare better on the phonological representation component [as confirmed by a paired-samples t-test: t(20) = 4.99, P < 0.001]. These contrasting profiles are further confirmed by a significant Group × Component interaction [F(1,32) = 10.5, P = 0.003] in a repeated-measures ANOVA restricted to the two groups and the two components of interest. This, therefore, suggests that the specific profile of phonological deficits may differ, to some extent, between children with dyslexia and those with SLI.
Individual classification according to the three components
Figure 3 reproduces the 2D space of Bishop and Snowling (2004) and Fig. 1B, with the four quadrants defined by deviance thresholds set a priori at −1.5 SD below the control mean. The distribution of children from the four groups across this space suggests the following observations:
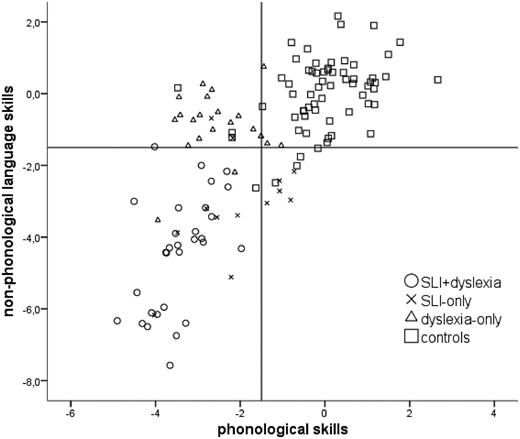
Distribution of individual children according to their phonological skills and non-phonological language skills. Lines correspond to a −1.5-SD threshold.
1. Phonological and non-phonological language skills, although forming independent components, are globally correlated (R = 0.74, P < 0.001), as is expected from previously available evidence.
2. By construction, most control children (57 out of 65) populate the upper right quadrant, representing normal language skills.
3. The majority of children with dyslexia-only (16 out of 21) populate the upper left quadrant, representing poor phonological skills alongside normal non-phonological language skills. Only three fail to show a deficit in phonological skills (at the −1.5-SD threshold), and two show deficits in non-phonological language skills. However, most (18 out of 21) are still below the average of the control group in non-phonological language skills.
4. The majority of children with SLI, with or without dyslexia (35 out of 43), populate the lower left quadrant. Only three fail to show a non-phonological language deficit, and five fail to show a phonological skills deficit.
5. Whereas all children with SLI with dyslexia have a deficit in phonological skills, some children with SLI-only (5 out of 13) do not.
6. The lower right quadrant is largely empty (four control subjects and five children with SLI-only).
Because the non-phonological language skills component includes variables that were used as diagnostic criteria for children with SLI (British Picture Vocabulary Scales 2, Test for the Reception of Grammar 2, Test of Word-Finding 2 and Clinical Evaluation of Language Fundamentals 3), one may worry that the aforementioned observations are circular with diagnostic criteria. For this reason, we computed a more restricted non-phonological language skills component based only on those language tests that were not used for diagnosis (Test of Active and Passive Sentences, Verb Agreement and Tense Test, Advanced Syntactic Test of Pronominal Reference–reflexive d' and Advanced Syntactic Test of Pronominal Reference–syntactic d’). We termed it ‘grammatical ability’, as these tests tap primarily morphology and syntax, not lexical skills. The corresponding 2D space is shown in Supplementary Fig. 1. The picture is essentially the same as Fig. 3, except that a few more children with SLI are in the normal range for grammatical ability (8 instead of 3 out of 43), and that dyslexic children perform better on grammatical ability than on the non-phonological language skills component. These differences presumably reflect the importance of lexical skills for the diagnosis of a minority of children with SLI, and for the slightly below-average performance of dyslexic children in non-phonological language skills. However, they do not challenge any of the observations above. Note that similar worries do not apply to the other two components, as they do not include any variable used for the diagnosis of either SLI or dyslexia.
Figure 4 shows the 2D space formed by phonological skills and phonological representations, with the four quadrants defined by deviance thresholds set a priori at −1.5 SD below the control mean. The distribution of children from the four groups across this space suggests the following observations:
![Distribution of individual children according to their phonological skills and phonological representations [two outliers with SLI and dyslexia (SLI + dyslexia) are out of the range of this graph along the y-axis]. Lines correspond to a −1.5-SD threshold.](https://oup.silverchair-cdn.com/oup/backfile/Content_public/Journal/brain/136/2/10.1093_brain_aws356/3/m_aws356f4p.jpeg?Expires=1716312536&Signature=tRJrEV76gz8enRH8Gmm~UhMiLD7ljSzenIcyo7ULoQ86F1s~01d1Sa8oaccIgC2b6OOhk8jxiXgYKLBi-hFRAzHAfEsDuRfPVe3lHeJpVYgD6y5PcE3E6fDZVSM-SIjGpH8W4SFoCy7erugjeWHNVwxSLgGK8Wot~ePtzIeiW~nzYJuBsSS9P~FlhKVvvr~GnwvVffA5j4ppTK3yVM5n1Gv5nKcLPGSmUBkZUshrGQTzvAemegKQ8TzKB8uGI-gSijx4Z9Q5D7R2kiM6Vyr14b9BmtpxxPl9hiRFD1lfItINguiY6i7h8bLVdIvDjU-akB9H9BPIHpv0CItwyTZv-g__&Key-Pair-Id=APKAIE5G5CRDK6RD3PGA)
Distribution of individual children according to their phonological skills and phonological representations [two outliers with SLI and dyslexia (SLI + dyslexia) are out of the range of this graph along the y-axis]. Lines correspond to a −1.5-SD threshold.
1. Phonological skills and representations, although forming independent components, are globally correlated (R = 0.66, P < 0.001).
2. By construction, most control children (58 out of 65) populate the upper right quadrant, representing normal phonology.
3. Whereas most children with dyslexia-only show poor phonological skills, only a minority (7 out of 21) show a deficit in phonological representations.
4. The majority of children with SLI, with or without dyslexia (35 out of 43), populate the lower left quadrant, representing both poor phonological skills and representations.
5. Whereas all children with SLI and dyslexia have a deficit in phonological skills, and all but one have a deficit in phonological representations, some children with SLI-only have no deficit in phonological skills (5 out of 13), and some have no deficit in phonological representations (5 out of 13). Three have neither deficit.
6. The lower right quadrant is largely empty (three control subjects and two children with SLI-only).
Discussion
In this study, we recruited a group of children diagnosed with SLI, dyslexia or both, and a group of control children, some matched in chronological age, some matched in language abilities and some matched in literacy abilities. We have, furthermore, administered to all the children a comprehensive battery of psychometric, oral and written language tests. Some of these tests were used to re-ascertain diagnoses of dyslexia and SLI using formal research criteria. The other tests have been added to obtain a more complete picture of these children’s language skills, relative to the control group.
Overlap between specific language impairment and dyslexia
The first result of this study is to confirm that whenever one recruits children on the basis of a previous diagnosis of either dyslexia or SLI, many of the children qualify for the other diagnosis as well. This overlap between SLI and dyslexia has long been recognized (Stark et al., 1988; McArthur et al., 2000; Conti-Ramsden et al., 2001). It is high in the present study (∼50% of the entire clinical population), much more so than in Catts et al. (2005). However, the present study was not based on a representative population sample, but on a clinically referred sample, so it is not suited to estimate the true overlap between the two disorders, and it is certainly biased towards an overestimation of the overlap. Nevertheless, even with such a bias, we have also found a significant number of children with either pure dyslexia or pure SLI. Thus, in agreement with the conclusions of Bishop and Snowling (2004) and Catts et al. (2005), we found evidence that SLI and dyslexia are two distinct disorders that are frequently comorbid.
Partial independence of phonological and non-phonological language skills
The second result of this study is that when examining (through factor analysis) the sources of variance of a broad range of linguistic skills across groups of control, dyslexic and SLI children, two main sources stand out (and explain ∼40% of the variance): non-phonological language skills on the one hand and phonological skills on the other. Non-phonological language skills encompass performance in tests of syntax, morphology and vocabulary, both receptive and productive. Phonological skills include phonological awareness, verbal working memory and rapid naming, i.e. the phonological skills known to be relevant to reading acquisition and to be impaired in dyslexia. The existence and the partial independence of these two dimensions had been assumed by Bishop and Snowling (2004) when presenting their 2D model, but we are not aware that it had previously received direct empirical support.
Distinct sources of phonological performance
The third and perhaps less straightforward result of this study is that a third independent source of variance of linguistic skills can be identified (and explains an additional 12% of variance). It encompasses tests of speech categorization, discrimination, articulation and repetition of simple and short (two-syllable) pseudo-words. Because these tests attempt to tap more directly the precision of phonological representation, we have termed it the phonological representation component.
The distinction between phonological skills and phonological representations requires further justification. Phonological skills are things that one can do with one’s phonological representations, but that require some additional skill: awareness and meta-cognitive skills, short-term or working memory, rapid and serial retrieval. It turns out that all these skills have been directly related to reading skills in developmental dyslexia (Wagner and Torgesen, 1987). In contrast, tasks that fall under the ‘phonological representations’ umbrella are tasks that attempt to tap and reflect the format of phonological representations more directly (at the level of specific phonetic features), with additional cognitive skills being minimally involved. Of course, we are aware that it is impossible to directly tap phonological representations without involving other levels of representation and various cognitive processes; we will come back to this issue further below. But, at least these tasks involve less complex and explicit skills than the phonological skills tasks. Furthermore, it has been argued that children with developmental dyslexia have relatively normal performance on tasks tapping more directly phonological representations. Indeed Ramus and Szenkovits (2008) reviewed a series of studies attempting to tap dyslexic individuals’ phonological representations or phonological grammar, using tasks involving minimal meta-cognitive or working memory skills. All those studies reported normal performance in dyslexia. This led them to conjecture that the phonological deficit may not lie in the representations themselves, but rather in some cognitive skills that apply to them in certain tasks, such as conscious access, short-term and working memory and speeded access. This hypothesis has received further support from a number of subsequent experimental studies (Hazan et al., 2009; Marshall et al., 2009, 2011; Soroli et al., 2010; Inoue et al., 2011; Berent et al., 2012; Mundy and Carroll, 2012; Ramus and Ahissar, 2012).
Thus, the distinction had already been argued from a theoretical point of view and on the basis of the typical pattern of performance of dyslexic children. It may also be linked with Hickok and Poeppel’s (2007) distinction between ventral and dorsal routes for speech processing, although at this stage, this is little more than an analogy. We find it quite remarkable that a purely data-driven factor analysis does indeed identify two separate sources of variance among phonological tests, and that these two sources can be readily identified with phonological skills and representations, respectively. We take this result as an empirical confirmation of the validity of the theoretical distinction.
To summarize, our results suggest that phonology is not just one single construct; rather, it has several components (at least two). Furthermore, some aspects of phonology (phonological representations) may be important for the development of oral language, whereas other aspects (phonological skills) seem more important for the development of written language.
Cognitive profiles typical of each clinical group
Children with SLI-only are characterized by deficits (below −1.5 SD) in non-phonological language skills. This is of course largely a consequence of the definition of SLI. They tend to also show deficits in phonological skills, although it is notable that a certain proportion (here 5 out of 13) do not. Obviously, the low numbers in this group do not allow us to assess the generality of this observation. At any rate, even those children who do not show a frank deficit in phonological skills score below average. Children with SLI-only also tend to show deficits in phonological representations, although again the picture is mixed, with 5 out of 13 seeming unimpaired, but scoring below average. The fact that children with SLI-only show, as a group, phonological deficits is consistent with the literature on SLI (Bishop et al., 1996). On the other hand, the fact that not all of them do is also consistent with the previous literature (Catts et al., 2005; Kelso et al., 2007; Ebbels et al., 2012) and larger population studies. In a population study of >700 children, Gardner et al. (2006) found that of those children who were impaired in grammar and/or phonology, one-third were impaired in both, one-third in grammar only and one-third in phonology only. Thus, the mixed picture that we have observed in this small group would seem representative of the diversity of phonological abilities in SLI.
Children with dyslexia-only are characterized by deficits in phonological skills, confirming most previous studies of dyslexia. They are not impaired in non-phonological language skills, although they overwhelmingly score below average, which is again consistent with previous literature on language abilities in dyslexia (Rispens and Been, 2007; de Bree and Kerkhoff, 2010; Robertson and Joanisse, 2010). The comparison between Fig. 3 and Supplementary Fig. 1 further suggests that dyslexic children are below average only in vocabulary, not in grammatical abilities. This may be a consequence of the fact that reading plays a large role in later vocabulary acquisition. Only one-third of the children with dyslexia-only show a phonological representation deficit, which is consistent with the mixed results of the literature concerning speech and more generally auditory perception on dyslexia (Rosen, 2003), and with previous estimates of the prevalence of such deficits (Ramus, 2003). It is also consistent with Ramus and Szenkovits’ (2008) claim that dyslexic individuals’ phonological deficit is restricted mostly to tasks involving additional cognitive skills, and that the evidence for degraded phonological representations is scarce (Ramus and Ahissar, 2012).
The interaction between group and phonological components further suggests that SLI-only and dyslexia-only children show different profiles of phonological deficit; whereas children with SLI-only are equally impaired on phonological skills and representations, children with dyslexia-only are significantly more impaired on phonological skills than representations, again supporting the view that dyslexic children’s deficit lies in cognitive skills applied to phonological representations, more than in the representations themselves. Such a conclusion does not seem to apply to children with SLI-only.
Children with comorbid SLI and dyslexia are characterized by deficits in the three linguistic dimensions studied, and these deficits are typically more severe than those of either SLI-only or dyslexia-only children. These multiply impaired cases might be considered less informative to test hypotheses about distinct cognitive dimensions. However, careful linguistically informed experimental designs can reveal the relative autonomy yet cumulative contribution of each component to overall linguistic functioning, and indeed distinctions within components of relatively impaired and spared function (van der Lely and Marshall, 2011).
Finally, because the present study did not aim to address poor reading comprehension, the only poor comprehenders who may have been included are those who also met diagnostic criteria for SLI and/or dyslexia. However, we did not include any ‘poor comprehender–only’, so we cannot address this category directly. Bishop and Snowling’s (2004) expectation that they would populate the lower right quadrant simply seems compatible with our data.
Potential limitations
One may wonder to what extent the fact that the different groups fall broadly where they are expected in Bishop and Snowling’s (2004) 2D space simply results from our inclusion and diagnostic criteria. Perhaps, groups are where they are simply because they were selected to do so. This has to be true to some extent, as Bishop and Snowling’s (2004) model was meant to be descriptive as much as explanatory. However, our findings are not entirely trivial either. First, note that none of the tests included in the phonological skills and representations components was used for diagnostic purposes. Only the non-phonological language skills component included some tests (British Picture Vocabulary Scales 2, Test for the Reception of Grammar 2, Clinical Evaluation of Language Fundamentals 3 and Test of Word-Finding 2) that were also used for diagnosis. Removing these variables from the component did not significantly change any of our observations (Supplementary Fig. 1). Hence, there may be a degree of circularity in the sense that children selected to have language impairments show language impairments, but at least this holds across entirely distinct sets of tests. Furthermore, our more interesting observations on the two phonological dimensions are not circular with any diagnostic criteria. Some may be expected from previous literature, such as that dyslexic children have poor phonological skills; however, these children were selected based on literacy, not phonological skills.
One important caveat is that the results of our factor analysis are partly dependent on the specific population that we have investigated, with specific numbers of participants in each group. Different proportions between the groups might potentially alter the sources of variance that can be detected. As an example, a clinical population including only comorbid SLI + dyslexia cases would not have the same potential to uncover the different sources of variance (Messaoud-Galusi and Marshall, 2010). It is also possible that a similar exploration based on a representative population sample might yield different results. Indeed, it may be that across the normal range, a single factor explains most of the variance in language abilities (as suggested by Hayiou-Thomas et al., 2006; Dale et al., 2010). Things may be different in dyslexia and in SLI, but if they represent no more than 5 or 10% of the population tested, they would weigh little in the factor analysis. Our hypothesis is that disorders offer a potential to observe more dissociations between cognitive components, and therefore more sources of variance, than normal variation does. Therefore, we expect that our results should be replicable at least within populations that are sufficiently ‘enriched’ with children with dyslexia-only, SLI-only and SLI with dyslexia. Whether they can be replicated in a representative population sample remains to be seen, but should not be taken as a test of our conclusions.
Another, similar caveat is that our results obviously depend on the specific tests that were included in our battery, and entered into the factor analysis. For one thing, the fourth and fifth factors could never have been found, had we not included six different subtests of prosodic and melodic abilities in our battery. More importantly, if we had not included a sufficiently broad range of phonological tests, some with high cognitive demands, some less so, we could not have obtained one of our main results, i.e. the finding of two distinct sources of variance in phonological abilities. Future studies will be able to replicate this result only to the extent that they meet that criterion.
Although we have found it relatively easy to recognize the two factors as tapping phonological skills and phonological representations, respectively, we should emphasize that we are not convinced that these two sets of tasks optimally tap either construct. The problem is that phonological skills and representations cannot be entirely dissociated by any task. Any task tapping phonological skills necessarily involves phonological representations as well, such that degraded phonological representations would deteriorate performance in any phonological skill. Conversely, short of brain imaging methods under passive listening conditions, there is no way a task can directly tap phonological representations without involving at least some cognitive skills (e.g. understanding instructions, focusing attention, short-term memory, meta-perceptual skills, learning the mapping between responses and keys, etc; see discussion in Ramus and Ahissar, 2012). From this point of view, none of the tasks that we have used can be said to purely tap either phonological skills or representations, so there has to be a certain degree of carry-over from one construct to the other, leading to increased correlations between the two components, and to blurring of the dissociations that could potentially be observed. Thus, finding evidence for two distinct phonological dimensions and partly different profiles between SLI and dyslexia despite these issues would seem to indicate that the distinction must be robust.
These considerations may help to understand an apparent puzzle: how can some children with SLI-only display a clear deficit in phonological skills, yet not meet the diagnostic criteria for dyslexia? Can a deficit in these phonological skills not engender difficulties in reading acquisition? One possibility of course lies in the diversity of cognitive profiles, and in the possibility that some children with a deficit in phonological skills use compensatory mechanisms and brain plasticity to overcome reading difficulties. However, if this were the only explanation, this would occur in children without SLI as well, so we should expect a similar proportion of children with a deficit in phonological skills among the control group as in the SLI-only group. However, this is not what we observe (Fig. 3), and this cannot be attributed to a selection bias against phonological deficits in the control group (phonological tasks were not used at all in selection criteria). Our hypothesis is that the children with SLI-only who perform poorly on phonological skills tasks may do so for different reasons than dyslexic children, in particular because of poor phonological representations. This may indeed explain 7 of the 8 children with SLI-only and poor phonological skills (Fig. 4). Thus, poor phonological representations may lead some children with SLI to perform poorly in the standard phonological skills tasks, even though these specific phonological skills are not impaired, and will therefore not lead to a specific reading impairment.
Finally, the absence of a standard non-word repetition task may be seen as a weakness of the present study. Indeed, our non-word repetition task involved only simple bisyllabic non-words, whereas studies of SLI and dyslexia typically use more phonologically complex material (including consonant clusters) and increase the short-term memory load to four or five syllables (e.g. Gathercole and Baddeley, 1996). Using such tasks, it has usually been found that SLI and dyslexic children perform quite poorly, to the extent that it has been argued that non-word repetition is a good phenotypic marker of SLI (Bishop et al., 1996, but see Ebbels et al., 2012). However, the reason why complex non-word repetition is such a reliable marker is that there are many different ways to perform poorly: poor auditory perception, degraded phonological representations, poor verbal short-term memory and poor articulatory skills (Ramus, 2001). Thus, most children with SLI are likely to perform poorly on one account or another. As a consequence, poor performance is difficult to interpret. From our perspective, complex non-word repetition taps both phonological skills and representations. We, therefore, predict that if the present study were to be replicated with the addition of complex non-word repetition, this variable should load on both factors, and would, if anything, blur the picture. We propose that the reason why complex non-word repetition is such a reliable clinical task also makes it less theoretically interesting, i.e. less useful for the purpose of making fine distinctions in the phonological domain and for the purpose of obtaining precise phenotyping and subtyping. We suggest that future studies of SLI and dyslexia would benefit from using a much broader range of phonological tasks, varying cognitive and representational demands.
What is the best model of the relationship between specific language impairment and dyslexia?
The severity model (Fig. 1A) is intrinsically limited by its unidimensional nature, as has been pointed out previously (Bishop and Snowling, 2004; Catts et al., 2005). It thus fails on two accounts: (i) it predicts that SLI always co-occurs with dyslexia, i.e. that SLI-only does not exist, whereas we and others have found clear evidence that it does; and (ii) it predicts that the linguistic abilities of dyslexic and SLI children vary along a single dimension, whereas we have found evidence for at least three independent dimensions.
The additional deficit model (Fig. 1B) has two main limitations: (i) by assuming that SLI results from a double deficit, one of which is the same as for dyslexia, it suggests that SLI always co-occurs with dyslexia, and therefore that SLI-only does not exist; and (ii) it predicts that the phonological abilities of dyslexic and SLI children vary along a single dimension, whereas we have found evidence for at least two independent dimensions. To be fair, Bishop and Snowling (2004) were aware of both limitations and proposed the additional deficit model as an acknowledged oversimplification. They further indicated that:
‘One goal for future research will be to unpack the concepts of phonological and nonphonological language impairment to investigate the component skills contributing to these dimensions. For example, when considering what is meant by phonological deficit researchers can distinguish between underspecified phonological representations, difficulty in segmentation, rapid decay of representations, and problems in learning and automatizing mappings between phonology and orthography’ (p. 879).
The present study can be seen as a first step in that direction.
The component model (Fig. 1C) fares better in the sense that it explicitly predicts the existence of children with SLI-only. One thing that this model did not predict, however, was the high proportion of children with SLI-only with poor phonological skills. Indeed, the assumption was that to the extent that these children do not show a reading impairment, they should not have the underlying deficit in phonological skills. Whether this assumption is correct remains uncertain. In the previous section, we proposed a possible explanation of this result by a carry-over effect of poor phonological representations.
Although the version we presented in the ‘Introduction’ section was cast in Bishop and Snowling’s (2004) 2D mould, the component model is intrinsically open to additional dimensions, potentially as many as there are cognitive subcomponents in the human language system. Thus, the finding of a third dimension for phonological representations, although not explicitly predicted, can easily be accommodated into the model. We, therefore, propose that the currently available data are best explained by a component model including the three dimensions that emerged from our factor analysis, and illustrated in Fig. 5A and B.
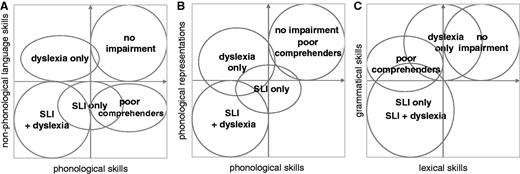
Models of SLI and dyslexia in three and in four dimensions. (A) The two-dimensions proposed by Bishop and Snowling (2004). (B) The two phonological dimensions evidenced in the present study. (C) A hypothetical split of the non-phonological dimension into two distinct ones: lexical and grammatical skills.
In Fig. 5A and B, two points deserve an explanation. First, the small overlap of dyslexia-only with the normal range of phonological skills is meant to reflect the fact that not all dyslexic children may have a phonological deficit, but instead a deficit that is perhaps visual or visual–attentional (e.g. Bosse et al., 2007). Second, the spread of SLI-only across both normal and poor phonological skills is meant to reflect our present findings, despite the fact that we are not sure whether these children have a true deficit in phonological skills or not. Theoretically, if one had a way of assessing phonological skills independently of phonological representations, the SLI-only group would be predicted to have largely spared phonological skills.
Are there reasons to believe that future studies should be able to find more dimensions of linguistic abilities relevant to SLI, dyslexia and poor comprehension? We would like to suggest that a fourth dimension might be useful for some purposes. Indeed the non-phonological language component encompasses a broad and diverse array of language skills, including syntax, morphology and semantics, both in reception and in production. We hypothesize that although all components of language are, to some extent, interdependent, grammatical and lexical skills are most likely to be dissociable. This is supported by comparing Fig. 3 and Supplementary Fig. 1, which suggests that dyslexic children score below average in lexical, but not grammatical skills. Taking poor comprehenders into account further reinforces this view; indeed, Bishop and Snowling (2004) suggested that their main impairment resides in lexical/semantic skills (although it cannot be excluded that some of them have relatively weak grammatical ability too). Thus, we predict that a future study with a similar design as the present one, including a sufficiently large proportion of dyslexic and poor-comprehending children, would be in a good position to observe two distinct sources of variance for grammatical and for lexical skills, respectively. This would result in a 4D model, which is illustrated in Fig. 5B and C.
Finally, our results have some implications with respect to the main causal theories of dyslexia and SLI. First, they are compatible with the phonological deficit theory of dyslexia, at least in the sense that a phonological deficit is a crucial feature of most children with dyslexia. The present data are not suited to directly address the issue whether the phonological deficit is primary or secondary, nor whether it causes the reading impairment. Second, our results are at odds with theories of SLI that attribute the cause of oral language impairments exclusively to phonological deficits (whether or not there are underlying auditory deficits). Indeed, we have found that although phonological deficits are frequent in SLI, they are not always present, and therefore not necessary for higher-level linguistic impairments to occur.
Conclusion
In summary, this study has found that children with SLI do not always have a phonological deficit, and do not always have a reading impairment. Even though SLI and dyslexia are frequently comorbid, pure SLI exists, as well as pure dyslexia. It may, therefore, be useful to systematically distinguish pure cases of either disorder from comorbid cases in future studies to better understand what is characteristic of each disorder. Language abilities assessed across groups of children with SLI, with dyslexia and control children have at least three independent sources of variance, one for non-phonological languages skills and two for distinct sets of phonological abilities (phonological skills versus representations). SLI and dyslexic children show partly different profiles of phonological deficit along these two dimensions. Finally, a multiple-component model of language abilities best explains the relationships between the different dimensions and between SLI and dyslexia.
Funding
This work and C.R.M. were supported by an ESRC (RES-000-23-0575) awarded to H.K.J.v.d.L. in collaboration with F.R. and by a Wellcome Trust University Award (063713 to H.K.J.v.d.L.). Research was conducted in the Centre for Developmental Language Disorders and Cognitive Neuroscience, London.
Supplementary material
Supplementary material is available at Brain online.
Acknowledgements
The authors would like to acknowledge Mike Coleman for help with computer programming; Steve Nevard, Bronwen Evans and Hugh Rabagliati for help with recording the stimuli; the assistance of Anastasia Archonti, Hillit Dayan and Angela Pozzuto in testing participants; and the help of Hugo Peyre with confirmatory factor analysis. The authors are most grateful to all the children who participated, as well as their schools and their parents. Author contributions: H.K.J.v.d.L., F.R. and C.R.M. designed the overall study and its implementation throughout. S.R. helped design and provided materials for the auditory tasks. C.R.M. collected the data. F.R. and C.R.M. analysed the data. F.R., C.R.M. and H.K.J.v.d.L. wrote the paper.

