


Abstract
Deep brain stimulation of the subthalamic nucleus is an effective treatment for Parkinson’s disease symptoms. The therapeutic benefits of deep brain stimulation are frequency-dependent, but the underlying physiological mechanisms remain unclear. To advance deep brain stimulation therapy an understanding of fundamental mechanisms is critical. The objectives of this study were to (i) compare the frequency-dependent effects on cell firing in subthalamic nucleus and substantia nigra pars reticulata; (ii) quantify frequency-dependent effects on short-term plasticity in substantia nigra pars reticulata; and (iii) investigate effects of continuous long-train high frequency stimulation (comparable to conventional deep brain stimulation) on synaptic plasticity. Two closely spaced (600 µm) microelectrodes were advanced into the subthalamic nucleus (n = 27) and substantia nigra pars reticulata (n = 14) of 22 patients undergoing deep brain stimulation surgery for Parkinson’s disease. Cell firing and evoked field potentials were recorded with one microelectrode during stimulation trains from the adjacent microelectrode across a range of frequencies (1–100 Hz, 100 µA, 0.3 ms, 50–60 pulses). Subthalamic firing attenuated with ≥20 Hz (P < 0.01) stimulation (silenced at 100 Hz), while substantia nigra pars reticulata decreased with ≥3 Hz (P < 0.05) (silenced at 50 Hz). Substantia nigra pars reticulata also exhibited a more prominent increase in transient silent period following stimulation. Patients with longer silent periods after 100 Hz stimulation in the subthalamic nucleus tended to have better clinical outcome after deep brain stimulation. At ≥30 Hz the first evoked field potential of the stimulation train in substantia nigra pars reticulata was potentiated (P < 0.05); however, the average amplitude of the subsequent potentials was rapidly attenuated (P < 0.01). This is suggestive of synaptic facilitation followed by rapid depression. Paired pulse ratios calculated at the beginning of the train revealed that 20 Hz (P < 0.05) was the minimum frequency required to induce synaptic depression. Lastly, the average amplitude of evoked field potentials during 1 Hz pulses showed significant inhibitory synaptic potentiation after long-train high frequency stimulation (P < 0.001) and these increases were coupled with increased durations of neuronal inhibition (P < 0.01). The subthalamic nucleus exhibited a higher frequency threshold for stimulation-induced inhibition than the substantia nigra pars reticulata likely due to differing ratios of GABA:glutamate terminals on the soma and/or the nature of their GABAergic inputs (pallidal versus striatal). We suggest that enhancement of inhibitory synaptic plasticity, and frequency-dependent potentiation and depression are putative mechanisms of deep brain stimulation. Furthermore, we foresee that future closed-loop deep brain stimulation systems (with more frequent off stimulation periods) may benefit from inhibitory synaptic potentiation that occurs after high frequency stimulation.
Introduction
Parkinson’s disease is a hypokinetic movement disorder characterized by a loss of dopaminergic projections from the substantia nigra pars compacta (SNc) to the input of the basal ganglia: striatum. The prevailing model of Parkinson’s disease suggests that the downstream effect of this dopaminergic denervation is a loss of inhibitory tone on the subthalamic nucleus (STN), due to excessive inhibition of neurons in the globus pallidus externus (GPe) by the overactive striatal indirect pathway neurons. The loss of inhibition subsequently leads to hyperactivity of the STN (Albin et al., 1989; DeLong, 1990) which, in turn, contributes to increased neuronal firing of inhibitory basal ganglia outputs: the globus pallidus internus (GPi) and substantia nigra pars reticulata (SNr). This is accompanied by disrupted firing patterns and increased synchronization, and these changes are ultimately believed to be the cause of Parkinson’s disease symptoms (Albin et al., 1989; DeLong, 1990; Levy et al., 2002; Brown, 2003). It is believed that decreasing the hyperactivity of the STN should alleviate Parkinson’s disease motor symptoms. However, recent optogenetic findings in mice have challenged the canonical model (that the direct and indirect pathways are selectively active), suggesting that these pathways may be concurrently active (during movements) or inactive (at rest) (Cui et al., 2013). The lack of consensus (Kravitz et al., 2010) suggests that further research is required to better understand the neurocircuitry and treatment of Parkinson’s disease.
Nevertheless, deep brain stimulation (DBS) has been widely adapted as a conventional treatment method of Parkinson’s disease. DBS delivers continuous high frequency stimulation (HFS; ∼130 Hz) to target structures through chronic indwelling electrodes (Benabid et al., 1987; Starr et al., 1998; Perlmutter and Mink, 2006; Wichmann and DeLong, 2006). DBS of the STN mimics the effect of beneficial lesions (Bergman et al., 1990; Aziz et al., 1991; Heywood and Gill, 1997) or inactivation by injections of muscimol (GABA agonist) and lidocaine, suggesting that DBS may inhibit STN activity (Wichmann et al., 1994; Levy et al., 2001). Thus, STN-DBS has proven to be remarkably efficacious as a symptomatic treatment modality for Parkinson’s disease (Benabid et al., 1994; Limousin et al., 1995; Kumar et al., 1998; Kleiner-Fisman et al., 2006; Perlmutter and Mink, 2006). Also, there have been recent promising reports on the efficacy of SNr-DBS for gait (Chastan et al., 2009; Weiss et al., 2011b, 2013), and combined STN-/SNr-DBS for improvements in freezing of gait (Weiss et al., 2011a), although little is known about the effects of electrical stimulation on responses of neurons and synaptic events in the SNr in humans. Furthermore, despite the known frequency-dependence of STN-DBS on therapeutic outcome (Moro et al., 2002; Timmermann et al., 2004), the effects of different stimulation frequencies on neurophysiology within STN and SNr are yet to be elucidated (di Biase and Fasano, 2016). The objectives of this study were to (i) compare the effects of stimulation over a range of frequencies on cell firing in STN and SNr; (ii) quantify the frequency-dependent effects on short-term plasticity (facilitation and depression) in SNr; and (iii) investigate the effects of continuous, long-train HFS (100 Hz, 0.3 ms, 10 s) on short-term plasticity.
Studies from our group have shown that focal microstimulation leads to inhibition of neuronal firing and it has been suggested that GABA release at afferent terminals may be involved in the mechanism of action (Dostrovsky et al., 2000; Wu et al., 2001; Filali et al., 2004; Lafreniere-Roula et al., 2010; Liu et al., 2012). Other studies have suggested that DBS may work by exciting efferent fibre outputs, as well as fibres of passage (Hashimoto et al., 2003; Bar-Gad et al., 2004; Johnson and McIntyre 2008; Xu et al., 2008), and/or by activating the cortex through antidromic firing of the cortico-STN hyperdirect pathway (Gradinaru et al., 2009; Kuriakose et al., 2010; Walker et al., 2012). The downstream excitatory effects may lead to a more regular pattern of firing from STN efferent fibres, which would reduce and/or replace the irregular, pathological neuronal activity (Benazzouz and Hallett, 1999; Garcia et al., 2005; Kringelbach et al., 2007).
In addition to the disturbed firing patterns within the circuitry, corticostriatal slice work has suggested that abnormal involuntary movements, such as dyskinesias, are the result of alterations in synaptic plasticity (Picconi et al., 2003, 2008; Calabresi et al., 2016). These studies have shown that long term potentiation in the corticostriatal synapse can be induced with HFS, and reversed with low frequency stimulation in healthy adult Wistar rats. A study from our group (Prescott et al., 2009) demonstrated that synaptic plasticity in the SNr is enhanced with l-DOPA treatment after four short trains of HFS, implicating a lack of plasticity in the pathophysiology of Parkinson’s disease. In the current study we investigated the effects of continuous, long-train HFS (comparable to conventional DBS) on short- and long-term synaptic plasticity in the SNr in the absence of exogenous dopamine in patients with Parkinson’s disease.
Methods and materials
Patients
STN and SNr recording sites were investigated during microelectrode-guided placement of DBS electrodes in a total of 22 patients with Parkinson’s disease, after overnight withdrawal of medication. For all patients we also determined the motor subscore from Part III of the Unified Parkinson’s Disease Rating Scale (mUPDRS) in 12 h OFF drug state with DBS on and off to assess degree of symptomatic improvement with DBS. All of the conducted experiments conformed to the guidelines set by the Tri-Council Policy on Ethical Conduct for Research Involving Humans and were approved by the University Health Network Research Ethics Board. Furthermore, all of the patients in this study provided written, informed consent prior to taking part in the study.
Microelectrode recording procedure
Techniques used for electrophysiological identification of the STN during stereotactic and functional neurosurgery have been previously published (Hutchison et al., 1998). Briefly, stereotactic coordinates of the anterior commissure and posterior commissure were determined using MRI (Signa, 3 T) and used to estimate the location of the STN based on the 12.0 mm sagittal section of the Schaltenbrand and Wahren’s (1977) standard atlas (Fig. 1A). Direct visualization of the target and the trajectory of approach was carried out with commercial planning software on T1-T2 fused images (Stealth Workstation, Medtronic). Two microelectrodes were advanced in the dorsoventral direction beginning 10 mm above the planned target. Recordings from both electrodes typically began with activity from reticular thalamic cells (slow bursting firing pattern). After a section of no activity, entry into the STN was confirmed based on cell firing rates of ∼20–40 Hz, irregular firing patterns with periods of beta activity, and responsiveness to movements (Hutchison et al., 1998). After 4–6 mm advancement, decreases in spike incidence signified exit from the ventral border of the STN and entry into the SNr was characterized by fast (80–100 Hz), regular firing patterns. The tentative target for the lowest contact of the DBS macroeletrode was at the ventral border of the STN.
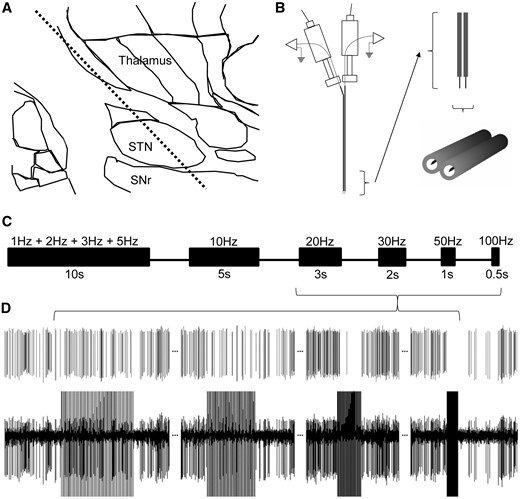
Experimental recording location, stimulation protocol, and an example of a neuronal recording in human STN. (A) A representative microelectrode track of the STN and SNr, in which recordings and experimental protocols were executed. (B) Our custom dual-microelectrode recording assembly with ∼600 µm mediolateral spacing. Upon locating a well isolated spike on one electrode, the adjacent microelectrode was used to deliver stimulation. (C) Timeline of the stimulation protocol for frequency-dependent studies of neuronal firing, silent period, and short-term plasticity. All stimulation protocols used 100 µA and 0.3 ms biphasic pulse widths. Note that only one block of 10 s is shown for 1, 2, 3, and 5 Hz stimulation trains. In fact, each of these stimulation trains was delivered for 10 s. Intervals between stimulation trains were ∼5–10 s. (D) A template matched spike (top trace) from a raw recording (bottom trace) obtained in the STN of showing inhibition of neuronal firing during 20, 30, 50, and 100 Hz stimulation trains, and a prolonged silent period after 100 Hz.
Data acquisition
Two independently driven microelectrodes (25 μm tip lengths, 600 μm apart, 0.2–0.4 MΩ impedances, at 12.5 kHz), which share a common ground on a stainless-steel intracranial guidetube were used for recordings and microstimulation (Fig. 1B). The open filter recordings (5–3000 Hz) were amplified 5000 times using two Guideline System GS3000 amplifiers (Axon Instruments), digitized using a CED 1401 data acquisition system (Cambridge Electronic Design), and monitored using Spike2 software (Cambridge Electronic Design). Microstimulation was done using an isolated constant-current stimulator (Neuro-Amp1A, Axon Instruments) with symmetric, 0.3-ms biphasic pulses (cathodal followed by anodal).
Stimulation protocols
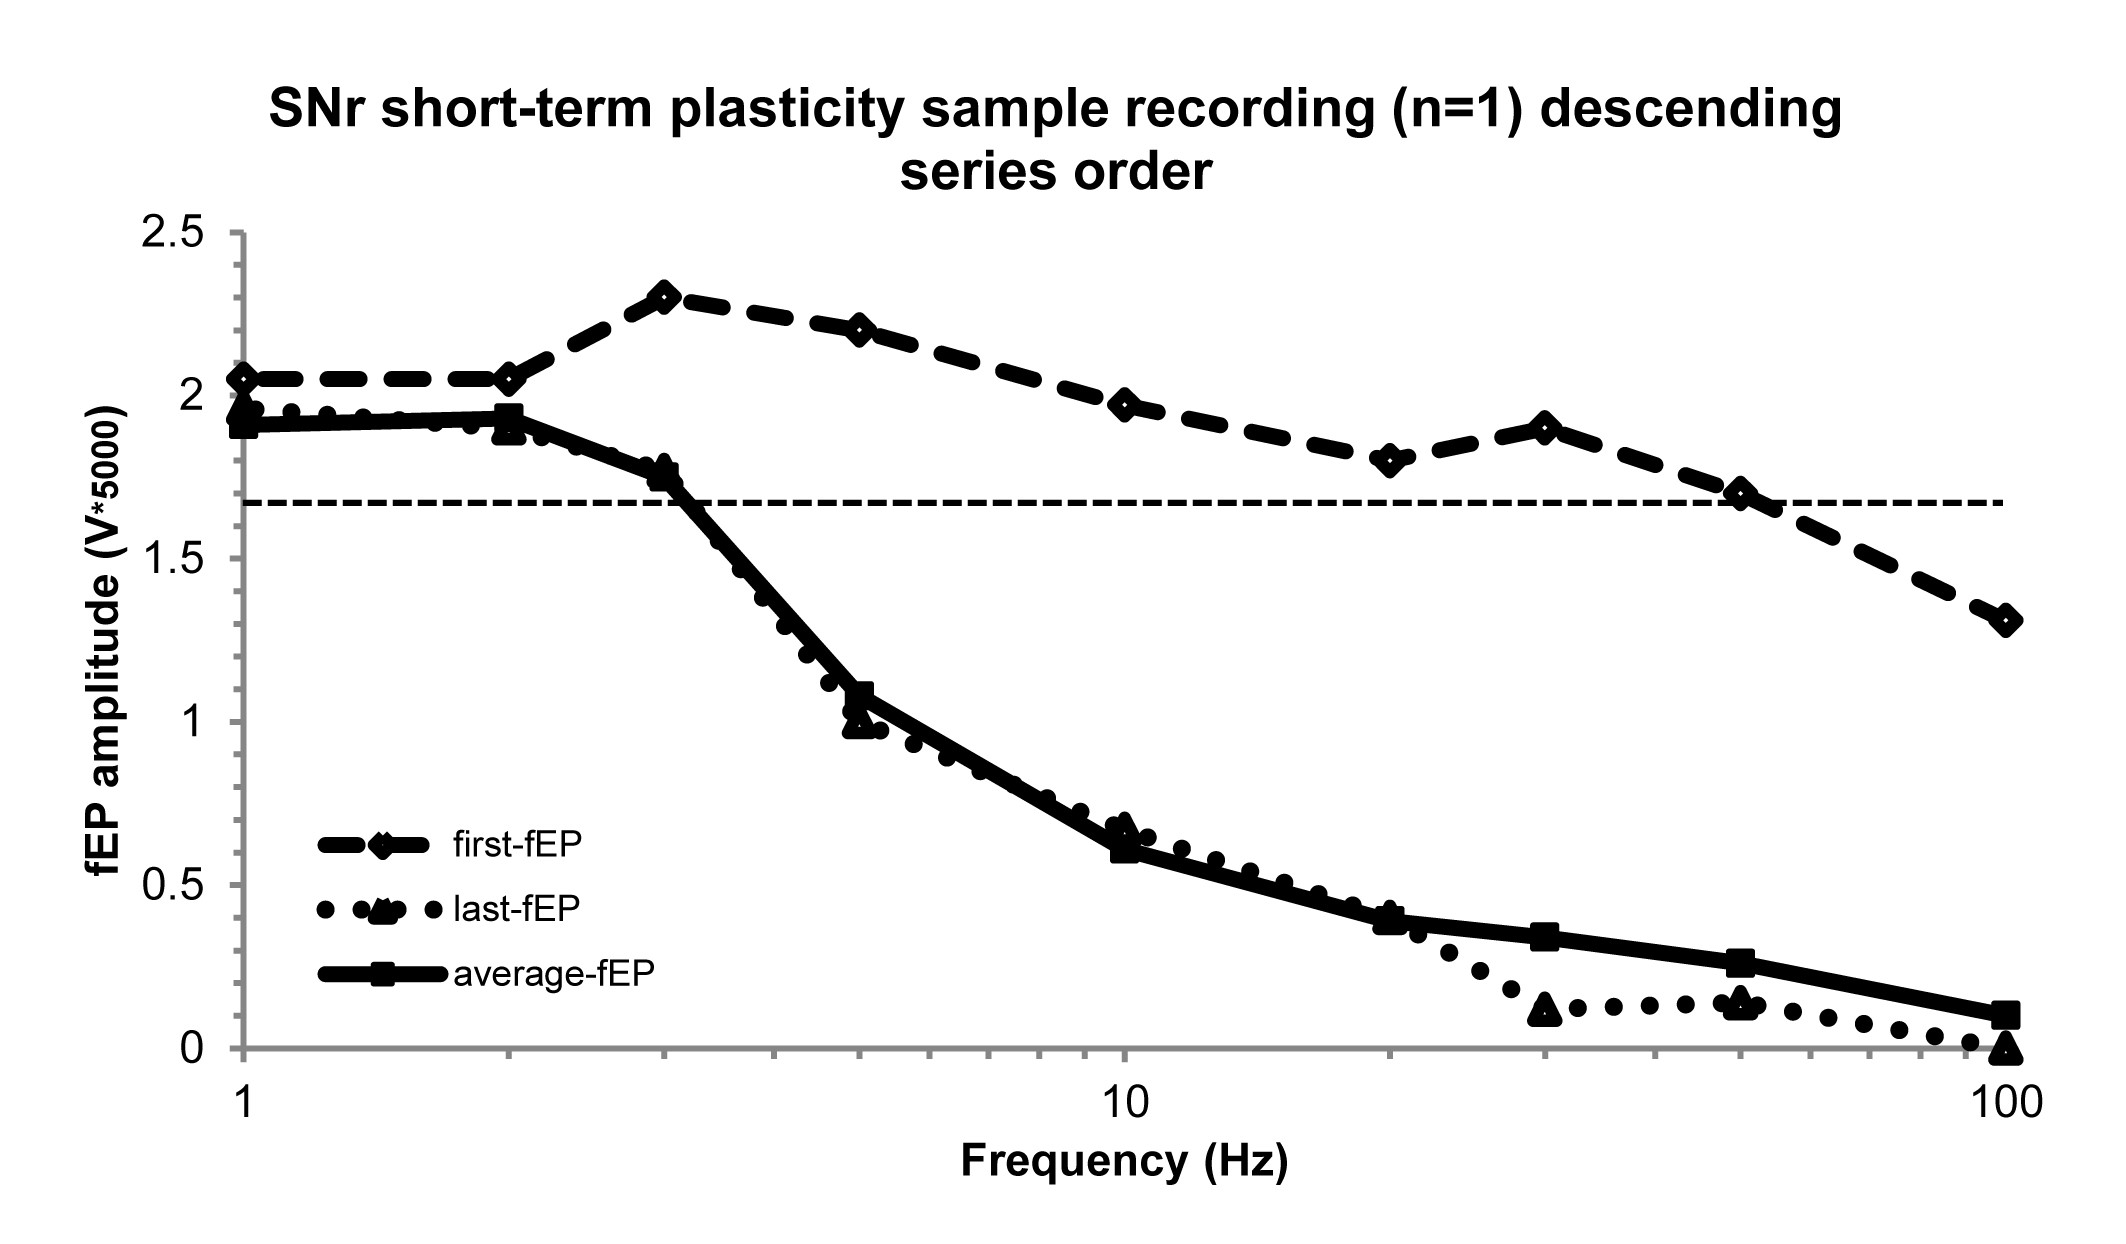
Upon locating a well-isolated single unit (spike) within the STN or SNr, data were collected for a 20–30 s off stimulation baseline firing rate measurement with one microelectrode. The adjacent microelectrode (600 μm away in the mediolateral direction) was used to deliver stimulation trains. For investigating frequency-dependent responses of neuronal firing (inhibition during the stimulation train) and silent periods (the time between the last stimulus pulse in the stimulation train to the time of occurrence of the first spike) in both STN (recording sites, n = 27; number of patients, np = 16) and SNr (n = 14; np = 9) neurons, we delivered stimulation trains separated by 5–10 s at increasing frequencies (1, 2, 3, 5, 10, 20, 30, 50, and 100 Hz, 100µA, 0.3 ms biphasic pulse width, for a total of 10, 20, and 30 pulses per train for the first three stimulation frequencies respectively, and 50–60 pulses per train for the remainder; Fig. 1C). All stimulation was done at 100 µA and 0.3 ms biphasic pulse width. The same SNr recording sites (n = 14; np = 9) were used for investigating the frequency-dependent effects on short-term plasticity in SNr. We chose the ascending series for the stimulation protocol to avoid hysteresis of the evoked field potential (fEP) potentiation induced by higher frequency stimulation trains (Liu et al., 2012). We have shown that 20, 30, 50, or 100 Hz stimulation are capable of potentiating the fEP, thus, if the stimulation frequencies were randomized and the series began with any of those frequencies, plasticity would be induced from the beginning, and would obscure our objective of determining the frequency threshold. To further justify privileging the ascending series, we performed a descending series (i.e. starting at 100 Hz) in the SNr with a separate patient (Supplementary Fig. 1), and as predicted, it considerably obscured the incremental, frequency-dependent increases in the first-fEP amplitude (hysteresis).
To investigate the effect of fEP potentiation on neuronal inhibition at SNr recording sites further, a separate protocol was used in a subset of patients (n = 12, np = 8): HFS-induced synaptic plasticity. Upon locating a well-isolated spike, 1 Hz stimulation (100 µA, 10 s) ‘test pulses’ were delivered to measure the baseline amplitude of the fEP, followed by ‘long-train’ HFS (100 Hz, 100 µA, 0.3 ms, 10 s), followed by another set of post-HFS test pulses. Inhibitory synaptic plasticity was quantified using fEP peak amplitudes, and the duration of neuronal inhibition after each stimulation pulse.
Offline analysis of neuronal activity
Data were not included for analyses if the monitored unit was lost or dropped below a 2:1 signal-to-noise ratio before completion of the stimulation protocol (two units were lost during the HFS-induced synaptic plasticity protocol). For measurement of firing rates, stimulus artefacts were removed from the signal starting at the onset of the stimulation pulse, to its end. The removed area was substituted with an equivalent period of neural data immediately prior to the stimulus artefact. Single units were discriminated using the wavemark template matching tool in Spike2. Since each STN and SNr cell had a unique baseline firing rate, the firing rates throughout the stimulation trains were normalized and represented as a percentage value of a randomly selected 10 s prestimulation baseline. The silent period was measured offline in Spike2 as the duration in time from the last stimulation pulse in the train, to the return of the first spike. Amplitudes of the fEP were measured as peak voltage deflections from the prestimulus baseline. For the frequency-dependent fEP amplitudes during the stimulation train (Fig. 5A), the average, first, and last fEP amplitude were normalized with respect to the ‘baseline’ fEP amplitude measured during the 1 Hz stimulation train. Furthermore, paired pulse ratios were measured using the first two fEPs in each stimulus train, where the interstimulus interval was taken as the inverse of the stimulation frequency. Lastly, for the HFS-induced inhibitory synaptic plasticity protocol, the post-HFS potentiation was quantified as the average fEP peak amplitude percentage increase, as well as the associated percentage increase in silent period following each stimulation test-pulse.
Statistical analysis
Stimulation frequency-dependent effects on neuronal firing rate and silent period at increasing frequencies were analysed using split-plot ANOVA (repeated measures ANOVA with between subject factor) to compare STN (n = 27) and SNr (n = 14) recording sites. Additionally, one-way repeated measures ANOVA were used to analyse the overall stimulation frequency-dependent effects on each nucleus individually with respect to ‘baseline’. For silent periods, the baseline was taken as the silent period measurement following the 1 Hz stimulation train. To analyse the stimulation frequency-dependent effects on the average fEP during stimulation trains at SNr recording sites (n = 14), one-way ANOVA was used. Two-way repeated measures ANOVA with within subject factor was used to compare the amplitude of the first and last fEP during stimulation trains. One-way ANOVA was used to analyse each of those measurements individually. One-way ANOVA was additionally used to analyse the paired pulse ratios. Significant results on the ANOVA tests were followed up with post hoc multiple comparisons with a Bonferroni correction. Finally, for the HFS-induced synaptic potentiation protocol at SNr recordings sites (n = 12), t-tests were used to analyse the post-HFS fEP amplitude and average silent period increases during 1 Hz test-pulses.
Results
Distinct frequency-dependent effects on firing rate of subthalamic nucleus and SNr neurons
Figure 2A demonstrates that in both STN (n = 27) and SNr (n = 14) neurons, the firing rate decreased as the stimulation frequency was increased. Repeated measures ANOVA post hoc pairwise comparison t-tests for STN [F(9,234) = 51.866, mean squared error (MSE) = 2.805, P < 0.001] revealed that the firing rate significantly decreased from baseline at a stimulation frequency of 20 Hz (P < 0.01), and even further at frequencies above 20 Hz (P < 0.001). For SNr [F(9,117) = 145.428, MSE = 2.302, P < 0.001], the firing rates decreased from baseline already at 3 Hz (P < 0.05), 5 Hz (P < 0.01), and at all frequencies above 5 Hz (P < 0.001). In STN, neuronal firing rates were silenced at 100 Hz, while in SNr they were silenced at 50 Hz. Analyses revealed a significant main effect of the nucleus [F(1,39) = 603.092, MSE = 139.874, P < 0.001] and frequency [F(9,351) = 110.386, MSE = 4.562, P < 0.001]. Moreover, the interaction of frequency and nucleus was significant [F(9,351) = 9.317, MSE = 0.385, P < 0.001], suggesting that stimulation frequency induced dissimilar responses in the firing rate between the two anatomical structures, with SNr exhibiting a more sensitive response. The STN log stimulus response function was a negative hyperbolic curve, whereas the SNr was sigmoid.
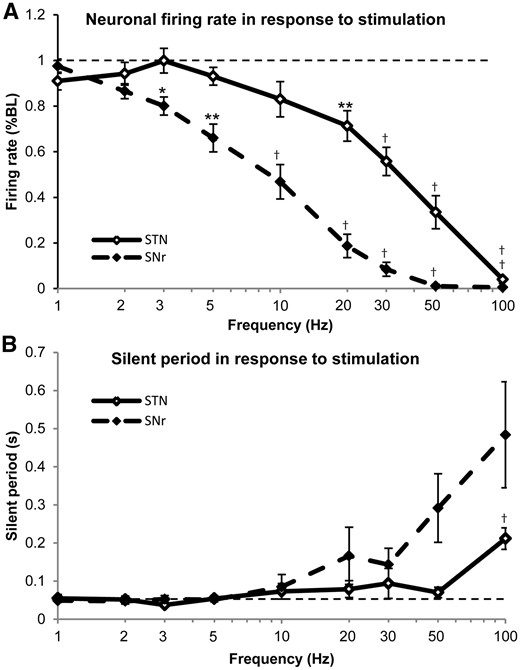
Frequency-dependent responses of average firing rates and silent periods of STN and SNr neurons. (A) The firing rates decreased as the stimulation frequency was increased in both STN and SNr neurons. SNr neurons appeared to have stronger inhibitory response to stimulation frequency and were silenced at 50 Hz in most cases, while STN neurons were only silenced with 100 Hz stimulation. STN neuronal firing rates differed significantly from pre-stimulation baseline (dashed line) at 20 Hz or greater, while SNr neurons began to differ from baseline at 3 Hz. (B) The silent period is the time between the last pulse of a stimulation train and the return of the first spike after cessation of stimulation. In both STN and SNr neurons, the silent period was not modulated with lower frequencies of stimulation. At frequencies of 20 Hz and greater, the silent period began to increase, having a seemingly larger response in SNr neurons, however, with a higher variability. With 100 Hz stimulation, the silent period increased to 211.6 ± 28.23 ms in STN (baseline: 54.85 ± 9.910 ms), and 483.8 ± 138.8 ms (baseline: 48.75 ± 4.450 ms) in SNr. *P < 0.05, **P < 0.01, †P < 0.001.
Frequency-dependent effects on post-stimulation silent period of subthalamic nucleus and SNr neurons
Figure 2B shows that the average time of the transient silent period following stimulation trains at different frequencies in STN (n = 27) and SNr (n = 14) neurons was only prolonged after high frequencies. After the 100 Hz stimulation train, the silent period (mean ± standard error) in STN was 211.6 ± 28.23 ms (baseline: 54.85 ± 9.910 ms), and 483.8 ± 138.8 ms (baseline: 48.75 ± 4.450 ms) in SNr. Repeated measures ANOVA post hoc pairwise comparison t-tests for STN [F(8,200) = 7.346, MSE = 0.074, P < 0.001] indicated that the silent period only prolonged significantly from baseline after 100 Hz (P < 0.001) stimulation. However, for SNr, despite a significant main effect of frequency [F(8,200) = 7.346, MSE = 0.074, P < 0.001] and a greater increase in the mean value, the post hoc t-test results showed a non-significant difference from baseline at all frequencies, presumably due to higher variability in values at higher frequencies (as suggested by larger standard errors for frequencies >10 Hz). Regardless, our analyses revealed a significant main effect of nucleus [F(1,38) = 4.449, MSE = 0.426, P < 0.05], frequency [F(8,304) = 19.537, MSE = .356, P < 0.001], and the interaction of these two factors [F(9,22) = 5.303, MSE = 0.361, P < 0.01].
High frequency stimulation-induced synaptic plasticity in the SNr: effects on single neurons
In the SNr, single pulse stimulation (and higher frequency stimulation trains) produced robust, positive-going, short latency ‘evoked field potentials’ (fEPs) immediately after each stimulation pulse (STN recording sites very rarely exhibited this response and therefore the analysis of STN was limited to firing rates). Figure 3A shows a sample raw microelectrode recording of the firing of an individual SNr neuron and the fEP immediately following a single 1 Hz test pulse, before and after potentiation with HFS (100 Hz, 100 µA, 0.3 ms, 10 s). At all (n = 12) recording sites, HFS produced a very robust response. The average amplitude of the fEP, and the average time delay in return of firing of the spike during 1 Hz test pulses (100 µA, 0.3 ms, 10 s) increased after HFS. The post-HFS fEP amplitude increased by a factor of 1.72 (P < 0.001), while the time delay between the stimulation pulse and first spike increased by 1.88 (P < 0.01) (Fig. 3B). The silent period increased from 46.45 ± 4.650 ms to 89.79 ± 21.11 ms (mean ± standard error; P < 0.05; Fig. 4). All 12 recording sites in SNr showed the same, highly reproducible effect on fEP amplitude and inhibition of firing.
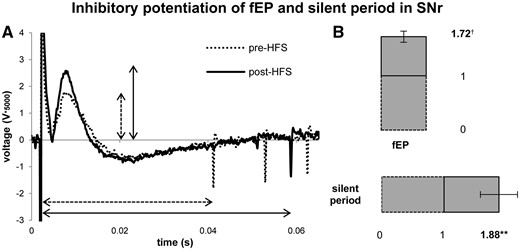
HFS-induced inhibitory synaptic plasticity at SNr recording sites. Stimulation with 1 Hz (100 µA, 0.3 ms, 10 s) test pulses revealed an inhibitory fEP. (A) A raw trace (5000× gain) of the fEP peak amplitude and transient inhibition of neuronal firing during a single pre-, and a single post-HFS test pulse. (B) After HFS (100 Hz, 100 µA, 0.3 ms, 10 s), both the fEP and the transient silent period were increased significantly. The fEP increased by an average factor of 1.72 (P < 0.001), while the silent period increased by factor of 1.88 (P < 0.01) from baseline. **P < 0.01, †P < 0.001.
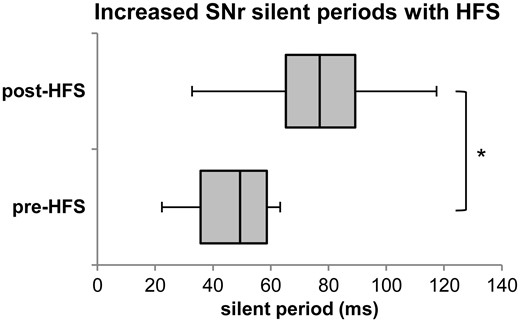
HFS-induced increase in SNr silent period during 1-Hz test pulses. The figure shows the 10th and 90th percentiles, first and third quartiles, and median of the silent period during 1 Hz test pulses pre- and post-HFS. The mean silent period increased from 46.45 ± 4.65 ms (mean ± standard error) to 89.79 ± 21.11 ms after HFS. *P < 0.05.
Frequency-dependent effects on evoked field potential amplitude in SNr neurons: short term plasticity
When stimulating at ≥30 Hz, the fEP demonstrated an initial increase in amplitude (a potentiation caused by the previous stimulation train), followed by a rapid attenuation (depression) throughout the rest of the train (Fig. 5A). Figure 5B shows that the average-fEP closely followed the curve of the amplitude of the last-fEP. Post hoc pairwise t-tests showed that the average amplitude of the fEP throughout the stimulation train was significantly attenuated at 30 Hz (P < 0.05) and frequencies above 30 Hz (P < 0.001) (Fig. 5B), and while the amplitude of the last fEP also showed significant attenuation at ≥30 Hz (P < 0.001), the amplitude of the first fEP was potentiated at 30 Hz (P < 0.01), 50 Hz (P < 0.05), and 100 Hz (P < 0.01). Furthermore, the potentiation and depression of the first and last fEPs, respectively appeared to have ceiling/floor effects at 50 Hz. There were significant main effects of frequency on the average fEP [F(8,96) = 48.989, MSE = 1.360, P < 0.001], and on both the first fEP [F(8,96) = 14.314, MSE = 0.730, P < 0.001] and last fEP [F(8,96) = 40.973, MSE = 1.796, P < 0.001] within stimulation trains, as well as a significant main effect of fEP timing (first/last) [F(1,96) = 131.761, MSE = 13.786, P < 0.001], and a significant interaction of the fEP timing and stimulation frequency [F(8,96) = 64.112, MSE = 2.369, P < 0.001].
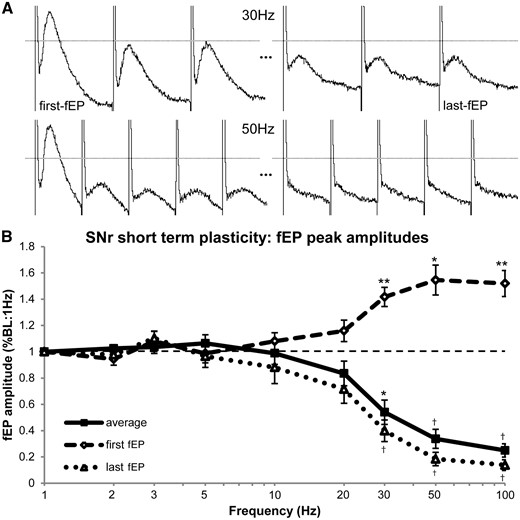
Frequency-dependent responses (short-term plasticity) of the average, first and last fEP during stimulation trains at SNr recording sites. (A) Sample raw traces from the same patient showing the first three and last three post-stimulus fEPs induced during a 30 Hz stimulation train and the first and last five fEPs induced during a 50 Hz stimulation train. The dashed line represents the ‘baseline’ fEP amplitude during the 1 Hz stimulation train, which remained constant. (B) Frequency-dependent responses in first, last, and average fEP amplitudes during stimulation trains. As the frequency of stimulation was increased, there was a rapid attenuation of the amplitude of the average fEP. However, the first-fEP within each train became potentiated as the stimulation frequency increased. The inhibitory potentiation (facilitation) effect was induced by the stimulus delivered by the previous stimulation train. As the facilitation increased, the synaptic depression effect correspondingly increased as well, demonstrated conjointly by the attenuation of average and last-fEP amplitudes. These phenomena are believed to be, in part, modulated by depletion of releasable stores of GABA within presynaptic terminals. *P < 0.05, **P < 0.01, †P < 0.001.
Furthermore, the paired pulse ratio curve (Fig. 6) shows that there was significant attenuation of the synaptic response at interstimulus intervals of 50 (P < 0.05), 33 (P < 0.001), 20 (P < 0.001), and 10 ms (P < 0.001), indicating that 20 Hz was the minimum stimulation frequency required to induce paired pulse depression. There was a significant main effect of interstimulus interval [F(9,108) = 108.51, MSE = 1.781, P < 0.001].
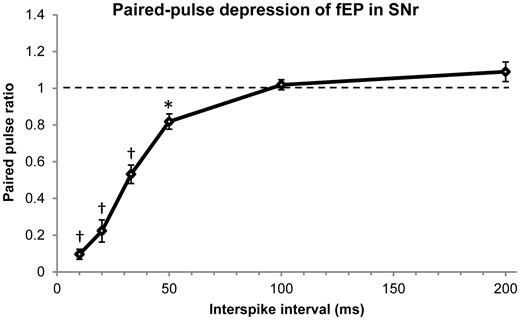
Paired pulse depression of the fEP in SNr. The data were obtained by measuring the paired pulse ratio between the first two pulses in each of the stimulation trains delivered. The interstimulus interval is the inverse of the stimulation frequency. The paired pulse ratio significantly differed from baseline at interstimulus intervals of 50, 33, 20, and 10 ms. This tells us that 20 Hz stimulation (50 ms interstimulus interval) was the minimum frequency required to induce a depression of the synaptic response. Data for intervals >200 ms were not significant and excluded from the figure. *P < 0.05, †P < 0.001.
Clinical correlations
To determine the clinical significance of the findings we correlated the silent period of STN neurons after 100 Hz stimulation to the degree of improvement in patient’s mUPDRS scores after DBS (Fig. 7A) and found a trend for longer inhibition to be associated with better clinical improvement (R2 = 0.20, P = 0.08). We also compared the frequency at which the firing rate in STN was reduced by 50%, (‘50% inhibitory frequency’, IF50) for each patient, to the degree of improvement in patient’s mUPDRS scores with DBS (Fig. 7B). Patients that had lower IF50 values in STN (i.e. more sensitive to stimulation frequency) did not have a statistically significant greater clinical improvement from DBS (R2 = 0.15, P = 0.13), although the probability of this correlation suggests that a larger sample size may indeed show this. Furthermore, we failed to find any correlation between the baseline firing of STN neurons and the clinical improvement after DBS (R2 = 0.02, P = 0.61), or pre-DBS mUPDRS scores (R2 = 0.01, P = 0.71).
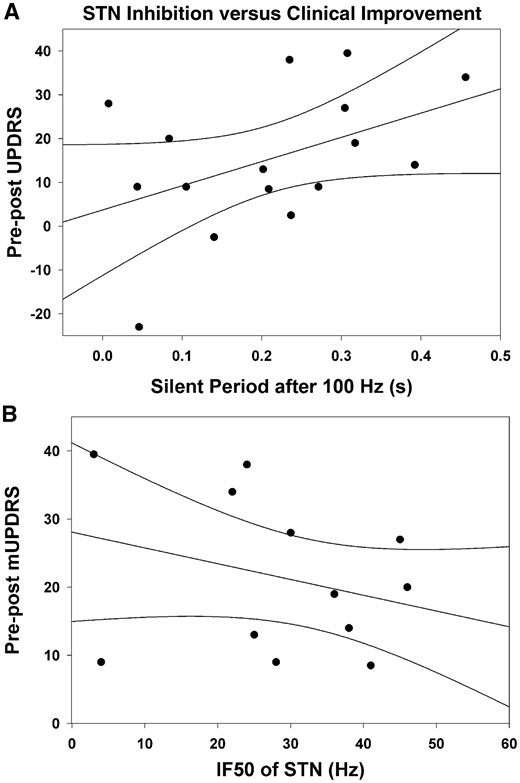
Clinical correlations with inhibition of neuronal activity in STN. The difference in pre-post OFF drug mUPDRS subscores (depicting clinical improvement) was correlated with the silent period after the 100 Hz stimulation train (A), and the frequency at which the firing rate in STN was reduced by 50% (IF50) (B) for each patient. (A) We found a trend for patients with longer STN silent period values after 100 Hz stimulation to be those that obtained greater clinical improvement from DBS (R2 = 0.20, P = 0.08). (B) Those with lower IF50 values (i.e. more sensitive to stimulation frequency) were not significantly associated with better clinical improvement with DBS (R2 = 0.15, P = 0.13).
Discussion
One of the most controversial aspects of DBS that is yet to be elucidated is the mechanism of action of electrical stimulation and its effects on the physiology/pathophysiology of the target structures (Kringelbach et al., 2010). It is unlikely that DBS works by one single mechanism, and our study suggests that at least three mechanisms are involved:
Inhibition of activity of target neurons: electrical stimulation led to release of neurotransmitters from the presynaptic terminals of afferent projections, which cause hyperpolarization of neuronal cell bodies due to the high prevalence of GABAergic terminals in STN and SNr.
Inhibitory synaptic potentiation occurs after HFS: we found that the amplitude of the inhibitory fEP and the associated duration of neuronal inhibition were increased after continuous HFS (during which synaptic depletion occurs).
Continuous HFS causes synaptic depletion: this phenomenon can occur because HFS does not allow the synapse enough time to recover after release of its ‘releasable stores’ of neurotransmitter, or HFS could be decreasing presynaptic Ca2+ conductance and inhibiting further release of neurotransmitters (one such cause of that could be activation of presynaptic GABAB receptors).
Although we do not discount the possibility of other important mechanisms, such as effects on voltage-gated channels (Wilson and Bevan, 2011), activation of efferent projections, or other (Lozano and Lipsman, 2013), this study was able to provide evidence supporting the aforementioned mechanisms. The justifications for these mechanisms and their implications are discussed below.
Inhibition of activity of deep brain stimulation target neurons
The STN and SNr receive projections from a number of sources, both inhibitory (GABAergic) and excitatory (glutamatergic). The STN receives excitatory input from the cortex, and inhibitory input from the GPe. In turn, the STN sends excitatory projections to the SNr (and GPi). While the SNr receives some inhibitory afferents from the GPe, the primary contributor of inhibitory GABAergic projections are the medium spiny neurons of the striatum (Smith and Bolam, 1989; Parent and Hazrati, 1995a, b; Bolam et al., 2000). Although both the STN and SNr have a mix of inhibitory and excitatory synaptic terminals, in both nuclei GABAergic terminals represent the majority of boutons on the somata, however, the relative distributions differ. GABAergic terminals on the somata account for 60% of the total number of boutons in the STN, while in the SNr they account for nearly 90% (Rinvik and Otterson, 1993; Parent and Hazrati, 1995b). Under the assumption that electrical stimulation leads to excitation of presynaptic terminals on the somata (Ribak et al., 1979, 1981; Dostrovsky et al., 2000; Wu et al., 2001; Filali et al., 2004; Galvan et al., 2006; Lafreniere-Roula et al., 2010), and since GABAergic afferents comprise the majority of these terminals, this could explain why STN and SNr neuronal firing rates were both attenuated as the stimulation frequency was increased (Fig. 2A), since GABA release leads to hyperpolarization of the postsynaptic membrane. Furthermore, the higher prevalence of GABA synapses in SNr likely explains why SNr neurons exhibited a greater inhibitory response to electrical stimulation than STN neurons.
Baufreton et al. (2005) have shown that one function of the inhibitory input to STN from GPe is to enable increased excitatory postsynaptic potential (EPSP) spike coupling so that during stimulation-induced inhibition, STN firing becomes phase locked and therefore more regular and actually enhances Na+ channel de-inactivation. This may allow the STN to follow beta activity coming from the motor cortex along the hyperdirect pathway. Indeed, we found STN silent periods (after 1–50 Hz stimulations) to be in the order of 50–60 ms, which corresponds to a spike return frequency of 15–20 Hz, falling in the beta band range. However, at 100 Hz stimulation (which we know with conventional DBS to be therapeutically beneficial), the silent period becomes significantly prolonged and is no longer permissive of transmission in the beta range.
Our analyses showed that at higher stimulation frequencies, the post-stimulation silent periods increased substantially (Fig. 2B). This effect may be a putative mechanism for therapeutic benefit of HFS. While temporal summation of GABAA-mediated (∼50 ms) inhibitory postsynaptic potentials (IPSPs) may account for the inhibitory effect observed during stimulation trains at lower frequencies, it is less likely to explain the prolonged (>100 ms) inhibition observed after the stimulation train at higher frequencies (Dostrovsky et al., 2000; Lafreniere-Roula et al., 2010). The longer duration inhibition following stimulation at higher frequencies (≥50 Hz) could be due to activation of metabotropic GABAB receptors, which produce longer lasting inhibition. In animal studies, GABAB receptors have been implicated in GABAergic striatonigral, pallidonigral, and pallidosubthalamic transmission (Chan et al., 1998; Charara et al., 2000; Smith et al., 2001; Boyes and Bolam, 2003; Galvan et al., 2005; Hallworth and Bevan, 2005; Kaneda and Kita, 2005). Furthermore, rat brain slice preparations have shown that HFS was necessary to elicit GABAB-mediated responses in STN (slow IPSPs), while single pulses elicited GABAA-mediated responses only (Hallworth and Bevan, 2005; Kaneda and Kita 2005; Kita et al., 2006).
Our findings suggest that the frequency-dependent inhibitory effects of electrical stimulation are more complex than simple temporal summation of inhibitory responses, and that HFS may be eliciting the action of presynaptic GABAB receptors leading to prolonged inhibition. Presynaptic GABAB receptors decrease Ca2+ conductance on autoreceptors of GABA releasing terminals, and on heteroreceptors in neighbouring terminals, including glutamatergic ones (Dutar and Nicoll, 1988; Mintz and Bean, 1993; Dolphin, 2003; Bettler et al., 2004). Synaptic transmission is highly dependent on presynaptic Ca2+ conductance, so this action would cause inhibition of further release of neurotransmitters. In support of this claim, physiological, electrophysiological and neurochemical studies have suggested that GABAB receptors mainly participate presynaptically while the role of postsynaptic GABAB receptors in SNr cells is minimal (Floran et al., 1988; Rick and Lacey, 1994; Chan and Yung, 1999).
Inhibitory synaptic potentiation occurs after high frequency stimulation
Despite the presence of GABAergic afferents in both STN and SNr, we only observed stimulation-induced fEPs in the SNr (Fig. 3A). This is also possibly attributable to the more balanced representation of glutamatergic (40%) to GABAergic (60%) synapses present on the somata of STN neurons. Studies have suggested that the glutamatergic response overlaps with the GABAergic effects, which could explain how in the STN, the glutamatergic response from cortical afferents may be shunting the GABAergic response and thus, not inducing an fEP (Rodriguez-Moreno et al., 1997; Kaneda and Kita, 2005). Since it is not possible to block GABAergic responses in humans, for obvious reasons, our discussion of the fEP and its implications will be henceforth limited to SNr neurons.
Based on the aforementioned observations, we believe our stimulation protocol is primarily activating inhibitory GABAergic projections in SNr, either from the striatum or the GPe. This is consistent with the observation that all of our extracellular fEP measurements are positive (Fig. 3A), indicating an intracellular hyperpolarization (such as a GABAA-mediated Cl− influx). Previous animal studies have demonstrated the inhibitory nature of a caudate-evoked GABAergic positive field in the SNr (Precht and Yoshida, 1971; Yoshida and Precht, 1971). The studies demonstrated that the time course of an intracellular IPSP was equivalent to the extracellular positive field, and that the field could be blocked in its entirety by picrotoxin (GABA antagonist). In our study, complete inhibition of SNr firing was observed during the time course of the fEP, suggesting that the stimulation-evoked positive field is associated with a hyperpolarizing event, likely local GABA release. Furthermore, we have shown that the amplitude of the stimulation-evoked fEP is directly associated with prolonged inhibition of neuronal firing and that both responses are conjointly enhanced after HFS (Fig. 3). We have demonstrated enhancement of inhibitory synaptic plasticity by observing that both the peak amplitude of the fEP, and the associated inhibition of neuronal firing increased by an average factor of 1.72 (P < 0.001), and 1.88 (P < 0.01), respectively, following HFS (100 Hz, 100 µA, 0.3 ms, 10 s). The proportionality between the responses further supports the hypothesis that stimulation is evoking an inhibitory, GABA-related phenomenon.
Although potentiation after HFS may not be a current putative mechanism of DBS, since continuous DBS is always on, this knowledge can be used to justify the purported increased efficacy of the novel applications of DBS (adaptive or closed-loop systems; Little et al., 2013), which have frequent off stimulation periods, and thus frequent enhancement of the efficacy of inhibitory synapses.
Continuous high frequency stimulation causes synaptic depletion
We also investigated the dynamics of the fEP by measuring the amplitude of the fEP after each pulse during the stimulation train at different frequencies (Fig. 5). By observing the behaviour of the average-fEP amplitude, it would appear that the fEP was simply being attenuated with increasing frequency, indicating a depletion of the GABAergic response. However, looking at the amplitude of the first and last fEP within each train uncovered a more complex behaviour. While the last fEP within each train was being attenuated much like the average fEP, the first fEP was contrarily being potentiated (synaptic facilitation). This implies that there was a rapid attenuation of successive fEPs (refractory depression) throughout the stimulation train after the initial potentiated fEP (Fig. 5A). This initial potentiation was the consequence of the electrical stimulation from the previous stimulation train (prior effect of 20 Hz stimulation train produced a potentiated first fEP during the 30 Hz train). Thus, the gradual increase in first fEP amplitude demonstrates a frequency-dependent potentiation, which began after the 20 Hz train, with an apparent ceiling effect occurring at 50 Hz stimulation. The rapid attenuation of the successive fEPs after the first was a result of synaptic depression (fatigue) presumably due to vesicle depletion from presynaptic terminals induced by HFS (≥30 Hz). Furthermore, the paired pulse ratio curve (Fig. 6) demonstrates that 20 Hz (50 ms interstimulus interval) is the minimum stimulation frequency required to induce depression of the synaptic response (significant attenuation of consecutive fEPs). Hippocampal slice preparations have shown that GABAergic IPSPs are ‘labile’ and attenuate after repetitive stimulation due to a reduction of driving force (McCarren and Alger, 1985; Huguenard and Alger, 1986), and a decrease in synaptic release (Thompson and Gahwiler, 1989). It is believed that synaptic depression is caused by depletion of a limited store of releasable transmitter by repetitive stimulation, which is not instantaneously replenished (Zucker, 1989). Thus, our results are able to discern the time course of GABA vesicle recovery. Synaptic depression begins at ∼20–30 Hz stimulation, this implies that the minimum time required for transmitter reuptake is between 100 and 200 ms, since stimulation frequencies between 5 and 10 Hz failed to induce synaptic fatigue. Furthermore, the gradual decrease in last fEP amplitude demonstrates a frequency-dependent synaptic depression, with an apparent floor effect occurring at 50 Hz stimulation.
Synaptic depression can be classified as a transient decrease in synaptic strength; this is hypothesized to occur by way of vesicle depletion and/or decreased presynaptic Ca2+ influx (Zucker and Regher, 2002; Fioravante and Regehr, 2011). When a stimulus releases a large fraction of the readily releasable pool of neurotransmitter vesicles, subsequent stimuli delivered before replenishment will release fewer vesicles. Modelling studies have predicted that depression will increase when the initial release probability and the frequency of activation are increased (Dittman et al., 2000; Zucker and Regher, 2002; Rizzoli and Betz, 2005; Fioravante and Regehr, 2011). Even small decreases in Ca2+ influx can lead to significant presynaptic plasticity due to neurotransmitter release having a strong dependence on Ca2+ (Neher and Sakaba, 2008). One possible mechanism of altering Ca2+ entry into the presynaptic terminal, as discussed above, is activation of presynaptic GABAB receptors, which would prevent further transmitter release. Several studies have implicated that high-frequency presynaptic activity leads to an accumulation of residual Ca2+, and that this phenomenon is involved in various forms of short-term plasticity including facilitation (Katz and Miledi, 1968; Zucker and Stockbridge, 1983; Kamiya and Zucker, 1994; Atluri and Regehr, 1996), post-tetanic potentiation (Delaney et al., 1989), and recovery from presynaptic depression (Dittman and Regehr, 1998; Stevens and Wesseling, 1998; Wang and Kaczmarek, 1998). These studies are consistent with our findings; facilitation of the fEP (increase in the amplitude of the first-fEP) occurred at the stimulation frequency that also induced synaptic depression (where the successive fEP amplitudes were attenuated). From Fig. 5B, we can clearly see that the first and last fEP have a close inverse proportionality. The synapses increasingly enhanced their initial response (facilitation), coupled with increasing refractory depression. Furthermore, when increasing the stimulation frequency failed to induce further facilitation of the first fEP (ceiling effect), synaptic depression appeared to level off accordingly (floor effect). Higher frequencies of stimulation would be required to test this hypothesis further.
These results provide further evidence that inhibitory synaptic plasticity is enhanced after HFS, and that the effect appears to be frequency-dependent. These findings support the hypothesis that HFS induces non-specific synaptic depletion, and this is likely a putative therapeutic mechanism of action of DBS (Rosenbaum et al., 2014). Although we are unable to provide explicit evidence of glutamatergic synaptic depletion, we hypothesize that HFS also depresses these synapses. This hypothesis may be evidenced by the fact that neuronal firing continued to be increasingly inhibited (Figs 1 and 2) despite an increasing depletion of GABAergic synapses (Fig. 5).
Functional implications
According to the canonical rate model, higher firing rates in STN are thought to give rise to worse motor symptoms in Parkinson’s disease (Delong, 1990). But, both in our study and as reported by Chesselet et al. (1996), we did not find any relationship between the baseline firing rate of STN neurons and symptom severity or clinical improvement with DBS. However, our findings did suggest that the easier it was to suppress the firing of STN neurons, and the longer they were inhibited for after clinically relevant HFS (100 Hz), the better the clinical improvement was for patients after STN DBS therapy. Presently, the ideal stimulation parameters for SNr DBS are unknown; however, our study suggests that the SNr can be inhibited using lower frequencies than the STN. This supports the notion that the optimal contacts for 60 Hz stimulation for axial symptoms (including balance and gait disturbances) in Parkinson’s disease are situated more ventrally than those for 130 Hz (Khoo et al., 2014). Furthermore, our SNr findings with respect to inhibitory plasticity (and this finding’s implications for novel DBS technologies) may be applicable to GPi (Liu et al., 2012), a conventional DBS target for Parkinson’s disease and cervical dystonia.
Limitations
A limitation of the current study, compared to animal studies, was the inability to use pharmacological interventions to help elucidate the specific molecular mechanisms. Additionally, we were limited to applying only short duration stimulation trains compared to that of days (or longer) in clinical applications. It is also important to consider the fact that a DBS macroelectrode would stimulate a much larger population of neurons than a microelectrode, with a current density that is capable of spreading up to 2 mm from the centre of a contact (Wu et al., 2001; Erez et al., 2009), although previous studies have shown that STN neuronal firing is inhibited with a DBS macroelectrode as well (Filali et al., 2004; Toleikis et al., 2012). Considering this and the fact that DBS also excites efferent axons, it is highly likely that STN-DBS produces a high-frequency activation of subthalamo-nigral axons as well. However, in the case of clinically beneficially stimulation frequencies (∼130 Hz), if the axon is following the frequency, the downstream synapses may also be subject to neurotransmitter depletion, although this was not directly investigated here. With respect to the glutamatergic subthalamo-nigral projections, these only account for ∼10% of the terminals located on SNr neurons. Thus, a potential therapeutic mechanism of STN DBS could be a ‘selective’ downregulation of downstream structures. Indeed, studies in non-human primates have shown that globus pallidus neuronal firing is not entrained to high frequency STN DBS (Agnesi et al., 2015; Zimnik et al., 2015), and may act as an ‘information filter’ downstream, by blocking the resting pathological firing characteristics in Parkinson’s disease, but allowing transmission of task-related information (Zimnik et al., 2015), which presumably involves other pathways (i.e. the direct pathway). It would be valuable to further study these downstream effects of electrical stimulation in humans (subthalamo-nigral projections).
Conclusions
The findings of this study indicate that stimulation likely induces presynaptic neurotransmitter release, which regulates the level of signal transmission, as well as various forms of synaptic plasticity. These phenomena were differentially modulated in STN and SNr, likely due to the higher prevalence of GABAergic terminals on SNr somata, although both structures contain primarily GABAergic synapses. A direct result of presynaptic transmitter release was frequency-dependent inhibition of activity of the target neurons. However, by looking at the silent period after the cessation of stimulation, it is clear that the mechanism of DBS is not a simple temporal summation of inhibitory responses, implying that HFS modulates the behaviour of synaptic transmission. We further showed that stimulation induces synaptic potentiation after HFS, but during HFS, there is a rapid synaptic depletion, which is likely a putative therapeutic mechanism of DBS. The purported increased efficacy of novel applications of DBS technology (adaptive or closed loop systems; Little et al., 2013) may be benefiting from potentiation of inhibitory responses that occurs after HFS because of more frequent off stimulation periods.
Acknowledgements
We thank Diellor Basha, Shane Ellis, and Ikram Khan for assistance in data collection, Alejandro Valencia for providing the clinical data, the functional neurosurgical fellows (Vihbor Krishna, Francesco Sammartino, Nathan Rowland, Duemani Reddy, Faried Hamzei-Sichani) who assisted in the operations, the Editor and Reviewers for their valuable comments, and the patients who participated in this study.
Funding
This work was supported in part by Canadian Institute of Health Research Grant MOP 98006, Natural Sciences and Engineering Research Council: Discovery Grant RGPIN-2016-06358, Dean Connor and Maris Uffelmann Donation, and Dystonia Medical Research Foundation.
Conflict of interest
S.K.K., M.H., A.M.L., A.F., and W.D.H. have received honoraria, travel funds, and/or grant support from Medtronic, A.F. received research grants, speaker and consultant honoraria from Boston Scientific, Inc. M.R.P. is a shareholder in MyndTec Inc. and an advisor to Myant Inc. A.M.L. is a co-founder of Functional Neuromodulation Ltd.
Supplementary material
Supplementary material is available at Brain online.
Abbreviations
- DBS
deep brain stimulation
- fEP
evoked field potential
- GPe
globus pallidus external segment
- GPi
globus pallidus internal segment
- HFS
high frequency stimulation
- IF50
50% inhibitory frequency
- IPSP
inhibitory postsynaptic potential
- SNr
substantia nigra pars reticulata
- STN
subthalamic nucleus

