


Abstract
Subthalamic deep brain stimulation (STN-DBS) for Parkinson’s disease treats motor symptoms and improves quality of life, but can be complicated by adverse neuropsychiatric side-effects, including impulsivity. Several clinically important questions remain unclear: can ‘at-risk’ patients be identified prior to DBS; do neuropsychiatric symptoms relate to the distribution of the stimulation field; and which brain networks are responsible for the evolution of these symptoms? Using a comprehensive neuropsychiatric battery and a virtual casino to assess impulsive behaviour in a naturalistic fashion, 55 patients with Parkinson’s disease (19 females, mean age 62, mean Hoehn and Yahr stage 2.6) were assessed prior to STN-DBS and 3 months postoperatively. Reward evaluation and response inhibition networks were reconstructed with probabilistic tractography using the participant-specific subthalamic volume of activated tissue as a seed. We found that greater connectivity of the stimulation site with these frontostriatal networks was related to greater postoperative impulsiveness and disinhibition as assessed by the neuropsychiatric instruments. Larger bet sizes in the virtual casino postoperatively were associated with greater connectivity of the stimulation site with right and left orbitofrontal cortex, right ventromedial prefrontal cortex and left ventral striatum. For all assessments, the baseline connectivity of reward evaluation and response inhibition networks prior to STN-DBS was not associated with postoperative impulsivity; rather, these relationships were only observed when the stimulation field was incorporated. This suggests that the site and distribution of stimulation is a more important determinant of postoperative neuropsychiatric outcomes than preoperative brain structure and that stimulation acts to mediate impulsivity through differential recruitment of frontostriatal networks. Notably, a distinction could be made amongst participants with clinically-significant, harmful changes in mood and behaviour attributable to DBS, based upon an analysis of connectivity and its relationship with gambling behaviour. Additional analyses suggested that this distinction may be mediated by the differential involvement of fibres connecting ventromedial subthalamic nucleus and orbitofrontal cortex. These findings identify a mechanistic substrate of neuropsychiatric impairment after STN-DBS and suggest that tractography could be used to predict the incidence of adverse neuropsychiatric effects. Clinically, these results highlight the importance of accurate electrode placement and careful stimulation titration in the prevention of neuropsychiatric side-effects after STN-DBS.
See Dagher (doi:) for a scientific commentary on this article.
Introduction
Deep brain stimulation (DBS) of the subthalamic nucleus (STN) in Parkinson’s disease is an established advanced therapy that treats motor symptoms (tremor, rigidity, bradykinesia), improves quality of life, and permits reduction or cessation of dopaminergic therapies (Krack et al., 2003; Williams et al., 2010; Schuepbach et al., 2013). However, in a proportion of those treated with STN-DBS, stimulation may induce neuropsychiatric symptoms, most often characterized by impulsivity and mood elevation (Romito et al., 2002; Daniele et al., 2003; Hershey et al., 2004, 2010; Voon et al., 2006; Appleby et al., 2007; Mallet et al., 2007; Welter et al., 2014; Mosley and Marsh, 2015). Although these symptoms can be ameliorated with stimulation reprogramming, they may nonetheless be associated with lasting harm (Mosley et al., 2018b, 2019b) and caregiver burden (Mosley et al., 2018a).
The ability to predict those at risk of a poor non-motor outcome would be a significant benefit to clinicians delivering this therapy, affecting surgical candidacy and choice of target. This is because the internal segment of the globus pallidus represents an alternative DBS site that has been advanced as a neuropsychiatrically ‘safer’ target (Okun and Foote, 2005) but with potentially less favourable motor outcomes (Odekerken et al., 2013). Unfortunately, most preoperative measures show poor sensitivity and specificity for this syndrome. Whilst impulse control behaviours (ICBs) related to dopaminergic therapy display the greatest phenomenological overlap with stimulation-induced neuropsychiatric symptoms, their presence is not predictive and their absence is not protective: patients with pre-DBS ICBs may remit after STN-DBS following medication reduction (Lhommee et al., 2012; Eusebio et al., 2013), whilst those on medication but with no history of ICBs may develop such behaviours after STN-DBS (Lim et al., 2009; Moum et al., 2012).
STN-DBS may facilitate movement in Parkinson’s disease by disrupting synchronous oscillations between STN and cortex (Eusebio et al., 2009, 2011; Shimamoto et al., 2013), particularly in the hyperdirect pathway (Nambu et al., 2002; Akram et al., 2017). However, there is evidence to suggest that neuropsychiatric side effects of this therapy may also be determined by modulation of activity in frontostriatal networks. The STN has an internal functional topography, with a motor subregion in the dorsolateral aspect of the nucleus that transitions into cognitive-associative and affective subregions in the ventromedial plane (Lambert et al., 2012; Haynes and Haber, 2013; Accolla et al., 2014; Ewert et al., 2018). Spread of the stimulation field around a DBS electrode in the motor region of the STN can also modulate these non-motor circuits. Previously, by localizing the active DBS contact and modelling a stimulation field based on individualized parameters, we reported an association between stimulation of the cognitive-associative STN subregion and postoperative disinhibition, in addition to the emergence of clinically-significant neuropsychiatric symptoms such as hypomania (Mosley et al., 2018c). The physiological underpinnings of this impairment may result from the STN’s role as a ‘stopping’ node in the indirect pathway of the basal ganglia. By inhibiting the output of cortico-striatal circuits, healthy STN firing delays decision-making, allowing time for evidence accumulation and the formulation of an appropriate behavioural policy (Doll and Frank, 2009). Accordingly, overriding this function with DBS may unmask impulsive and error-prone responding (Frank et al., 2007; Cavanagh et al., 2011). More generally, dimensional variations in a range of non-motor symptoms after STN-DBS have been found to covary with the spread of electrical stimulation (Petry-Schmelzer et al., 2019). However, beyond local effects of DBS, a mechanistic association between modulation of frontostriatal networks and the emergence of post-DBS neuropsychiatric symptoms has not been established.
Quantifying the relationship between impulsivity and the individualized connectivity of the subthalamic stimulation field can address this issue. Through modelling the distribution of white matter tracts in the brain, diffusion MRI can be used to investigate connections of the surgical target site that mediate network-wide effects of DBS. Additionally, diffusion MRI can also characterize white matter tracts adjacent to the STN, such as the medial forebrain bundle, which may also be important mediators of adverse events (Coenen et al., 2009, 2012). Motor networks associated with clinically-effective STN-DBS have previously been delineated with diffusion MRI (Accolla et al., 2016; Vanegas-Arroyave et al., 2016; Akram et al., 2017; Horn et al., 2017; Chen et al., 2018) but neuropsychiatric symptoms have not yet been comprehensively examined.
Using a high-resolution preoperative diffusion MRI acquisition, we reconstructed the distribution of subthalamic stimulation and its connectivity based on two frontostriatal networks recently shown to underlie dissociable aspects of impulsivity and gambling behaviour in patients with Parkinson’s disease prior to STN-DBS (Mosley et al., 2019a). These networks were chosen because of their involvement in cognitive mechanisms of central relevance for impulsivity: reward evaluation (sensitivity to appetitive rewards) and response inhibition (failure to suppress inappropriate or premature choices). Multiple lines of evidence implicate separable anatomical substrates of these ‘choosing’ and ‘stopping’ behaviours (Aron et al., 2007; Haber and Knutson, 2010; van Eimeren et al., 2010; Antonelli et al., 2014; Rae et al., 2015; Hampton et al., 2017). In our previous study of patients with Parkinson’s disease, we demonstrated brain-behaviour covariation between impulsivity and connectivity of these frontostriatal networks, with the effect of connectivity showing a distinction by ICB status. Here, we sought to identify the most important contributors to impulsivity after STN-DBS, examining the connectivity of frontostriatal networks prior to DBS and the connectivity of the stimulation field within these networks after DBS.
Materials and methods
Participants
Participants were consecutively recruited at the Asia-Pacific Centre for Neuromodulation in Brisbane, Australia between 2016 and 2018. All participants met the UK Brain Bank criteria for Parkinson’s disease (Hughes et al., 1992) and at the time of recruitment were being assessed for subthalamic DBS. All participants were at Hoehn and Yahr stage 2 or greater (Hoehn and Yahr, 1967) with motor fluctuations or other motor complications related to dopaminergic therapy. No participants met the Movement Disorder Society criteria for dementia (Emre et al., 2007). The disease subtype was established based on an analysis of the dominant symptoms elicited during the Unified Parkinson’s Disease Rating Scale (UPDRS) Part III Motor Examination, as described in Spiegel et al. (2007).
In the present longitudinal investigation, clinical and phenotypic assessments took place at baseline, prior to DBS (ON medication), and 3 months postoperatively (on stimulation). With presurgical results already reported (Mosley et al., 2019a) the present report focuses on postoperative behaviours. However, preoperative findings are necessarily referenced when correlations between pre- and postoperative behaviours are analysed.
Ethics approval
Prior to the commencement of data collection, the full protocol was approved by the Human Research Ethics Committees of the Royal Brisbane and Women’s Hospital, the University of Queensland, the QIMR Berghofer Medical Research Institute and UnitingCare Health. All participants gave written, informed consent to participate in the study.
Image acquisition
A preoperative T1-weighted MPRAGE, a T2-weighted FLAIR sequence and diffusion-weighted imaging (DWI) were obtained at baseline, using a 3 T Siemens Prisma and a 64-channel head coil. The acquisition parameters were as follows: T1, 1 mm3 voxel resolution, repetition time = 2000 ms, echo time = 2.38 ms, flip angle = 9°, matrix size = 256 × 256, field of view = 256 × 256 × 192; T2, 1 × 1 × 2 mm voxel resolution, repetition time = 9500 ms, echo time = 122.0 ms, flip angle = 120°, matrix size = 256 × 256, field of view = 256 × 256 × 70; DWI, 90 directions, b-value = 3000 s/mm2, voxel size = 1.7 mm3 isotropic. Twelve non-diffusion-weighted images (b0) were interleaved throughout this main sequence, while an additional sequence of 8 b0 images were also acquired with the opposite phase-encoding (posterior-anterior) direction to allow for distortion correction. Postoperative CT images for all participants were acquired on a Siemens Intevo, with a resolution of 0.5 mm3.
The DWI data were preprocessed with MRtrix3 (https://github.com/MRtrix3/mrtrix3), using an in-house preprocessing pipeline (https://github.com/breakspear/diffusion-pipeline). Preprocessing steps were identical to (Mosley et al., 2019a). Full details on DWI acquisition, preprocessing and fibre reconstruction are provided in the Supplementary material.
Surgery and follow-up
After the STN was manually identified on FLAIR imaging, bilateral implantation of Medtronic 3389, Boston Vercise or Abbott 6172 directional electrodes took place in a single-stage procedure using a Leksell stereotactic apparatus. Intraoperative microelectrode recordings (MERs) were used to identify the boundaries of the STN and intraoperative test stimulation was performed. Postoperative lead placement was confirmed with CT imaging. Subthalamic stimulation was commenced immediately with the initial choice of contact based upon MER signals. After discharge, participants returned to the clinic at set intervals for further titration of stimulation (including changes in stimulating contact) against motor symptoms until these were satisfactorily treated without adverse effects. Dopaminergic medication was reduced or ceased postoperatively, with remaining treatment converted to a levodopa-equivalent daily dose (LEDD) value (Evans et al., 2004).
Assessment of impulsivity
All participants were assessed for impulsivity at baseline and at follow-up, 3 months after DBS surgery. Participants were phenotyped on both occasions using a combination of neuropsychiatric instruments and engagement in a naturalistic gambling paradigm (the ‘virtual casino’).
Neuropsychiatric instruments
Impulsivity was assessed with a range of neuropsychiatric instruments, to account for the multidimensional nature of this construct (Mosley et al., 2019a). These included: trait impulsiveness: the Barratt Impulsiveness Scale 11 (BIS) (Patton et al., 1995); impulsive and compulsive behaviours (ICBs): the Questionnaire for Impulsive-Compulsive Disorders in Parkinson’s Disease-Rating Scale (QUIP-RS) (Weintraub et al., 2012); impatience: the Delay Discounting Task (Kirby et al., 1999); disinhibition: the Excluded Letter Fluency task (ELF) (Shores et al., 2006) and the Hayling test (Burgess and Shallice, 1997). In addition, depressive symptoms were assessed with the Beck Depression Inventory (Beck et al., 1961) and apathetic symptoms with the Apathy Scale (Starkstein et al., 1992). To assess basic cognitive status, the Mini-Mental State Examination (MMSE) (Folstein et al., 1975) and the Montreal Cognitive Assessment (MoCA) (Nasreddine et al., 2005) were also administered. For further information, see the Supplementary material. Statistical analyses of differences in impulsivity between pre- and post-DBS assessments were corrected for multiple comparisons using the Benjamini and Hochberg method (1995), with α = 0.05.
Gambling paradigm
Participants gambled on slot machines within a virtual casino (Supplementary Fig. 1) that has previously been used to study impulsive decision-making in healthy controls and patients with Parkinson’s disease (Paliwal et al., 2014, 2019). This naturalistic gambling task allowed for impulsive behaviour to be expressed as bet increases, exploratory slot machine switches and ‘double or nothing’ gambles. Full details of this task are given in Mosley et al. (2019a), Paliwal et al. (2019) and the Supplementary material.
Caseness
Following DBS surgery, in addition to the dimensional assessment of impulsivity and gambling behaviour, participants were also assigned to the category ‘case’ or ‘non-case’ depending on whether they developed clinically-significant (i.e. impairment or distress) neuropsychiatric symptoms attributable to DBS, necessitating device manipulation (hereafter referred to as ‘caseness’). Identification of these patients used the same process as prior work (Mosley et al., 2018,a, c, 2019b). This category was operationalized as follows: participants were evaluated at baseline and postoperatively by a neuropsychiatrist (P.M.). A semi-structured diagnostic interview and mental state examination were undertaken with attention to euphoria, irritability, disinhibition, impulsivity and compulsivity. The contribution of neurostimulation to the presentation was confirmed if symptoms responded promptly to a reduction in the amplitude or change in the locus of stimulation, as assessed by serial mental state examinations and feedback from close family members. Clinically-significant neuropsychiatric symptoms had remitted in all participants by the time of the postoperative reassessment of impulsivity and gambling.
Electrode localization and volume of tissue activation
DBS electrodes were localized using the Lead-DBS toolbox version 2.2 (Horn and Kuhn, 2015; Horn et al., 2019a) (https://github.com/netstim/leaddbs/tree/develop). Preoperative structural acquisitions were co-registered with postoperative CT imaging and then normalized into common ICBM 2009b non-linear asymmetric space using the SyN approach implemented in advanced normalization tools (ANTs) (Avants et al., 2008). Electrode trajectories were reconstructed after correcting for brainshift in postoperative acquisitions by applying a refined affine transform in a subcortical area of interest calculated pre- and postoperatively. Rotation of directional electrodes was determined based on visualization of the artefact created by the orientation marker and directional electrode segments (Hellerbach et al., 2018). For each electrode, a volume of activated tissue (VAT) was estimated using a volume conductor model of the DBS electrode and surrounding tissue, based on each participant’s individualized stimulation settings and a finite element method to derive the gradient of the potential distribution (Horn et al., 2019a). An electric field (E-field) distribution was also modelled (Vorwerk et al., 2018).
Tractography and apparent fibre density
Using the preoperative DWI data, constrained spherical deconvolution (CSD) (Tournier et al., 2004, 2007; Jeurissen et al., 2014) was performed in each participant after group-average intensity normalization (Raffelt et al., 2012), generating voxel-wise estimates of fibre orientation distribution functions (fODF). Fibre tracts from seed (subcortical) to target (cortical) regions were reconstructed with the probabilistic streamline algorithm iFOD2 (Tournier et al., 2010). Estimates of structural connectivity between each seed and target region were derived from the apparent fibre density representing the underlying intra-axonal volume averaged along tracts (Raffelt et al., 2012) (Supplementary Fig. 2 and Supplementary material).
Networks
The influence of the site and distribution of stimulation on postoperative impulsivity and gambling was evaluated using two discrete brain networks supporting reward evaluation and response inhibition (Fig. 1A). These networks incorporate anatomical priors, as below. We chose to employ the same networks used in Mosley et al. (2019a), which were found to explain a substantial fraction of the variance in impulsivity prior to DBS. We defined these networks at baseline, prior to STN-DBS, and adjust their anatomical features postoperatively to incorporate the subthalamic VAT as the seed for probabilistic tractography.
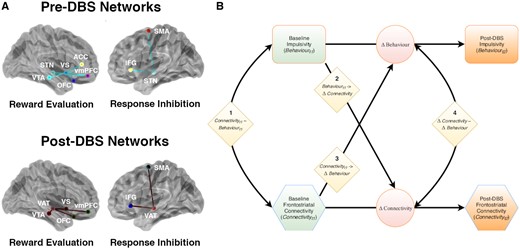
Modelling brain-behaviour covariation. (A) Two discrete networks subserving reward evaluation and response inhibition were specified based on Mosley et al. (2019a). The pre-DBS reward evaluation network was defined to include tracts connecting ventral striatum (VS) with vmPFC, OFC, anterior cingulate cortex (ACC) and VTA. It also included a tract connecting the STN with vmPFC. The response inhibition network included tracts connecting the STN with the IFG and the SMA. Postoperatively, these networks were extended to incorporate the subthalamic VAT, with a focus on connections of the VAT within the network. Network models were visualized with the BrainNet Viewer (Xia et al., 2013). (B) Cross lagged (latent change score) model which allows quantification of the relationship between preoperative structural network connectivity (Connectivityt1) and baseline measures of impulsivity (Behaviourt1) to post-DBS structural network connectivity (Connectivityt2) and postoperative measures of impulsivity (Behaviourt2). Coefficients are modelled as follows: 1, connectivity-behaviour covariance at baseline (Connectivityt1 ∼ Behaviourt1); 2, behaviour to connectivity coupling (Behaviourt1 → ΔConnectivity); 3, connectivity to behaviour coupling (Connectivityt1 → ΔBehaviour); and 4, an estimate of correlated change in connectivity and behaviour (ΔConnectivity ∼ ΔBehaviour). In the context of the present investigation, we were mainly interested in connectivity to behaviour coupling (3). Diamonds = coefficients; circles = change scores; rectangles = measured indices of impulsivity; hexagons = structural connectivity profiles. For these latter two variables, green shading indicates preoperative data and orange shading indicates postoperative data. See the main text and Supplementary material for further elaboration of these relationships. LEDD = levodopa equivalent daily dose; PCA = principal components analysis.
The preoperative reward evaluation network comprised streamlines connecting ventral striatum with anterior cingulate cortex, orbitofrontal cortex (OFC), ventromedial prefrontal cortex (vmPFC) and the ventral tegmental area (VTA), as well as the STN with vmPFC. The preoperative response inhibition network connected the STN with the inferior frontal gyrus (IFG) and pre-supplementary motor area (SMA). Although other cortical areas (such as the anterior cingulate cortex) are implicated in cognitive control, we focused on the IFG and SMA because of the strong empirical support for this network in prior work on behavioural inhibition (Rae et al., 2015; Hughes et al., 2018). These baseline networks were used to evaluate the influence of structural connectivity prior to DBS on postoperative impulsivity and gambling. Postoperatively, these networks were extended to incorporate the subthalamic VAT, with a focus on connections of the VAT within the network. The reward evaluation network now included streamlines connecting the site of stimulation with OFC, vmPFC, ventral striatum and VTA. To capture tegmental fibres for this latter midbrain region, the VTA served as the seed and the subthalamic VAT as the target. The response inhibition network included tracts connecting the VAT with IFG and SMA.
Further details of these parcellations are provided in the Supplementary material.
Data analysis
Partial least squares path modelling
Partial least squares path modelling (PLS-PM) was used to identify specific patterns of structural connectivity explaining inter-individual variability in impulsivity and gambling behaviour after STN-DBS (McIntosh and Lobaugh, 2004; Shaw et al., 2016), controlling for relevant demographic and disease-related factors (Supplementary Fig. 3). PLS-PM is a method for examining a system of linear relationships between multiple blocks of variables. In this investigation, we were interested in how brain structure (connectivity) affected impulsivity (behaviour) and whether this was also influenced by age, gender, duration of disease, subtype of disease and dopaminergic medication. The connectivity variable in the path model was constructed from the apparent fibre density of each white matter tract in the structural network under investigation. The individual contribution of each tract to the connectivity variable was quantified by a ‘weight’ (linear coefficient) and the connectivity variable was formed as a linear mixture of the corresponding apparent fibre density values that most strongly covaried with the behavioural variable under investigation. The relationship between the connectivity and behavioural variables was quantified in the path model by a path coefficient and tested for statistical significance using bootstrapping. Relevant demographic and disease-related covariates were also represented and path coefficients were determined for these relationships. Bootstrapping of the model yielded 95% confidence intervals for the coefficients of interest.
All models were constrained to be of equivalent complexity: each model used either the reward evaluation or the response inhibition network, plus LEDD, age and years since diagnosis of Parkinson’s disease. One interaction term (e.g. the interaction of LEDD with the reward evaluation network) was permitted per model and reported if significant. The winning model from all possible permutations (network, interaction effect if significant) was selected based on the maximum R2 value prior to bootstrapping, which was used as the summary metric to compare models. The influence of gender, disease-subtype, pre-DBS ICB status and post-DBS caseness on the association between connectivity and behaviour was examined with a permutation test in the PLS path model, performed upon the winning model for each behavioural variable of interest. For further details, see the Supplementary material.
Longitudinal modelling
Using the weighted network scores derived from PLS-PM, with pre- and post-DBS behavioural evaluations, a cross-lagged panel model was used to evaluate whether structural connectivity at baseline (Connectivityt1) influenced impulsivity and gambling postoperatively (Behaviourt2) (Fig. 1B). These latent change score models assess longitudinal associations between two or more repeatedly sampled measures of brain and behaviour (Kievit et al., 2018; Muetzel et al., 2018; Lin et al., 2019). They quantify cross-domain coupling, capturing the extent to which change (Δ) in one domain (impulsivity) reflects the baseline level in the other (connectivity) and vice versa. Here, a bivariate cross-lagged model described four brain-behaviour relations of interest. These comprised connectivity-behaviour covariance at baseline (Connectivityt1 ∼ Behaviourt1), connectivity to behaviour coupling (Connectivityt1 → ΔBehaviour), behaviour to connectivity coupling (Behaviourt1 → ΔConnectivity) and an estimate of correlated change in connectivity and behaviour (ΔConnectivity ∼ ΔBehaviour) after taking into account the coupling pathways. Change in connectivity (ΔConnectivity) was defined as the change in network connectivity after the subthalamic VAT was added as a seed for probabilistic tractography. In the context of the present investigation, we were mainly interested in the ability of pre-DBS network connectivity to predict cognitive change from pre- to post-DBS (Connectivityt1 → ΔBehaviour). Model fit metrics comprised the Comparative Fit Index (CFI; the degree to which the proposed model better fits the data than one that assumes no correlations amongst latent variables) and the root mean square error of approximation (RMSEA; a measure of the deviation between observed covariance and that predicted by the model). Notably, we omitted longitudinal modelling of demographic and disease-related covariates in these latent change score models and focused only on the longitudinal coupling of brain connectivity and behaviour. We did this for two reasons: (i) our goal was to test a relatively straightforward baseline assay (brain connectivity) of vulnerability to postoperative impulsivity, which could be implemented in clinical practice without excessively complex statistical methods; and (ii) building a cross-lagged model that represents all conceivable covariates is a difficult task, possibly leading to excessively complex models (Kievit et al., 2018). Unless a clear role for covariates was identified in the PLS path models, we opted for a more parsimonious representation.
For the gambling outcomes, random-intercept linear mixed-effects models were fit in order to provide an explicit longitudinal metric of change (e.g. in dollars wagered) by connectivity (Supplementary material).
Caseness
Supplementary analyses were undertaken to explore distinct patterns of connectivity in individuals with clinically-significant, stimulation-dependent neuropsychiatric symptoms (‘cases’) based on their betting behaviour (Fig. 2). This required co-registration of individual participant data with a common anatomical reference. To achieve this, using the Lead-DBS toolbox, each participant’s VAT in each hemisphere was integrated with a normative structural connectome derived from 90 patients with Parkinson’s disease (mean age 61.4 ± 10.4, 28 females) enrolled in the Parkinson’s Progression Markers Initiative (PPMI, www.ppmi-info.org), in which 20 000 fibres were sampled per subject using a generalized q-sampling approach implemented in DSI-Studio (Yeh et al., 2010), as described in more detail in Ewert et al. (2018) and Horn et al. (2017). Fibres traversing each participant’s VAT were selected from the group connectome based on the E-field gradient strength (i.e. fibres in peripheral VAT regions with a low E-field were down-weighted) and projected to the volumetric surface of the ICBM 2009b non-linear asymmetric brain in 1 mm isotropic resolution. A connectivity profile for each participant was expressed as the weighted number of fibre tracts between the stimulation site and each brain voxel. Subsequently, to visualize subcortical streamlines predictive of outcome, all fibres traversing VATs across the cohort were isolated from the normative connectome.
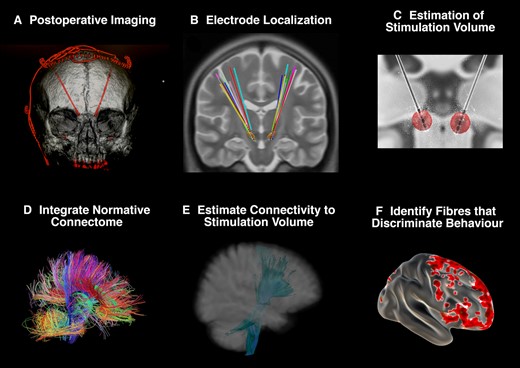
Identifying fibres discriminative of gambling behaviour. A supplementary analysis was undertaken to identify distinct patterns of connectivity between ‘cases’ and ‘non-cases’. (A) Subthalamic electrodes were identified on postoperative imaging. (B) Electrodes were localized in ICBM 2009b non-linear asymmetric space using the Lead-DBS toolbox. (C) Stimulation volumes were estimated for each participant based on individual stimulation parameters. (D) A normative connectome from the PPMI was integrated with the cohort. (E) Fibres from this connectome passing through each stimulation volume were isolated. (F) Measuring the behavioural variable (bet size in the virtual casino), each fibre was tested across the cohort between participants with a stimulation volume that encompassed the fibre (connected) and those where the fibre did not traverse the volume (unconnected). If there was a significant difference in bet size between participants with connected and unconnected VATs, then this fibre was identified as associated with betting behaviour. The top 20% of discriminative fibres were compared between ‘case’ and ‘non-case’ groups to identify distinct patterns of connectivity.
Discriminating by caseness, fibres associated with bet size in the virtual casino were identified. Each fibre was tested across the cohort between participants with a stimulation volume that encompassed the fibre (connected) and those where the fibre did not traverse the volume (unconnected). If there was a significant difference between betting behaviour in participants with connected and unconnected VATs (using a two-sided, two-sample t-test), then this fibre was identified as discriminative of outcome. This process yielded a ‘fibre t-score’, with high-values indicating that this fibre was strongly discriminative of clinical outcome (Baldermann et al., 2019). Only the top 20% of fibres positively correlated with the behavioural variable were selected for analysis to mitigate the risk of false positive associations.
Focal subthalamic stimulation
Supplementary analyses were also undertaken to investigate the effects of focal stimulation within the STN on motor and neuropsychiatric outcomes. The spatial position of each electrode contact and the distribution of each VAT was evaluated with reference to a multimodal parcellation of the STN into affective, associative and motor subregions (Ewert et al., 2018). For each hemisphere, the following variables were calculated: (i) the distance of the active electrode contact to the centroid of each STN subregion; and (ii) the extent of each subregion volume occupied by each participant’s VAT (i.e. representing the dispersion of charge).
To reduce the dimensionality of this dataset, as with Mosley et al. (2018c), a variable selection and regularization algorithm (the Least Absolute Shrinkage and Selection Operator: LASSO) was used to identify the combination of anatomical variables with the best predictive value for each neuropsychiatric outcome (Friedman et al., 2010). A conservative one-standard-deviation rule was chosen for the regularization parameter (λ) to protect against overfitting (Hastie et al., 2009).
Subsequently, neuropsychiatric variables and their anatomical predictors as identified from the LASSO were modelled in a general linear model. Demographic and disease-related factors, including LEDD, were also entered as covariates.
Data and code availability
Data analysis was performed in the R software environment (R Core Team, 2014), using the packages glmnet for optimization (Friedman et al., 2010), plspm for PLS-PM (Sanchez, 2013), pls for PLS regression (Mevik, 2007), lavaan for cross-lagged models (Rosseel, 2012) and lme4 for linear mixed-effects models (Bates et al., 2015).
The gambling paradigm is provided for download from a git repository at https://github.com/saeepaliwal/breakspear_slot_machine and the analysis pipeline at https://github.com/saeepaliwal/dbs_pd_analysis_pipeline. The diffusion MRI processing pipeline is at https://github.com/breakspear/diffusion-pipeline. Code for the analysis of focal STN stimulation is at https://github.com/AlistairPerry/DBSVATstats. A de-identified dataset containing neuropsychiatric assessment and gambling data can be provided on application to the corresponding author, subject to institutional review board approval.
Results
Participants
Fifty-seven surgical candidates gave informed consent and completed all baseline assessments. Two participants were unable to complete the postoperative assessments because of fatigue. Fifty-five participants thus proceeded to analysis (Table 1). Prior to surgery, 17 participants had a current or past history of an ICB and six participants had more than one ICB. These all developed after the diagnosis of Parkinson’s disease and in the setting of dopaminergic therapy (including both levodopa and dopamine agonist treatment). These comprised pathological gambling (n = 10), hypersexuality (n = 9), compulsive shopping (n = 3), dopamine dysregulation (n = 2), binge eating (n = 1) and hobbyism (n = 1). Participants with ICBs were more likely to be male [χ2(1) = 7.20, corrected P = 0.044] and younger (t = 2.78, mean difference 8.6 years, corrected P = 0.044). Implanted devices comprised Medtronic 3389 (n = 21), Boston Scientific Vercise (n = 18) and Abbott 6172 directional electrodes (n = 16). Directional electrodes were used in five participants to steer current. Across all participants, subthalamic VATs in each hemisphere were concatenated, with the highest probability of stimulation occurring in the dorsolateral aspect of the STN in both hemispheres [Fig. 3A(i and ii)].
![Subthalamic stimulation. VATs for each participant in each hemisphere were concatenated and thresholded to identify the highest frequency of overlapping voxels (the top 25% are shown here). The VATs overlapped most substantially with the dorsolateral aspects of the STN in both hemispheres. The subthalamic atlas (Ewert et al., 2018) is overlaid on a 7 T MRI ex vivo brain image (Edlow et al., 2019). Within each STN, affective = yellow, associative = blue, and motor = maroon subregions. [A(i and ii)] Axial and coronal visualizations of stimulation across the whole cohort (green). [B(i and ii)] For those participants who developed clinically-significant neuropsychiatric symptoms (cases), the VATs are visualized at the time of symptom onset (red) and after stimulation manipulation (reduction in amplitude, change of contact etc.) when acute symptoms had resolved (green). A qualitative trend away from ventromedial regions can be seen after stimulation adjustment associated with remission of neuropsychiatric symptoms.](https://oup.silverchair-cdn.com/oup/backfile/Content_public/Journal/brain/143/7/10.1093_brain_awaa148/2/m_awaa148f3.jpeg?Expires=1716347171&Signature=DyYcXCSwGIKAHt605-54C5~Uk~10-6uA1ipwMP~LYdQzYesafnELUUOb-LpGzilubLo9v01Lck7DfeX4W0LuqrRaQhlnLt4ShVK63erTj2Q46HD31HSnJO80Sr8CeVsnogOmQlwxqf5lcvnnDX067-54EMxrFt6Vpe0CIDf-VycjBiCZVp4rSO3YrO3c9K-W3CdXyFmT6vWbIpmkuuSTXPb3TC7FMCY54zdkhgG0jCC2fP-TiQ4LFkUCaQxIgRn0lFObJzON~Uh5zkwCc4IrKgpjr~PjCuQxbtHm1ZCbOoTxC7eUnBMRs4uJZ8hejWCqxyLDsyAcLFCYRNoyD54HyQ__&Key-Pair-Id=APKAIE5G5CRDK6RD3PGA)
Subthalamic stimulation. VATs for each participant in each hemisphere were concatenated and thresholded to identify the highest frequency of overlapping voxels (the top 25% are shown here). The VATs overlapped most substantially with the dorsolateral aspects of the STN in both hemispheres. The subthalamic atlas (Ewert et al., 2018) is overlaid on a 7 T MRI ex vivo brain image (Edlow et al., 2019). Within each STN, affective = yellow, associative = blue, and motor = maroon subregions. [A(i and ii)] Axial and coronal visualizations of stimulation across the whole cohort (green). [B(i and ii)] For those participants who developed clinically-significant neuropsychiatric symptoms (cases), the VATs are visualized at the time of symptom onset (red) and after stimulation manipulation (reduction in amplitude, change of contact etc.) when acute symptoms had resolved (green). A qualitative trend away from ventromedial regions can be seen after stimulation adjustment associated with remission of neuropsychiatric symptoms.
Demographic and clinical characteristics of the Parkinson’s disease cohort (n = 55)
| Demographic and disease-related variables | |||
| Categorical variable | Total (n = 55) | Percentage total | |
| Gender | n | % total | |
| Male | 36 | 65.5 | |
| Female | 19 | 34.5 | |
| Clinical subtype | n | % total | |
| Akinetic-rigid | 17 | 30.9 | |
| Mixed | 27 | 49.1 | |
| Tremor | 11 | 20.0 | |
| ICB status | n | % total | |
| Yes | 17 | 30.9 | |
| No | 38 | 69.1 | |
| Continuous variable | Mean (SD), median [range] | ||
| Age, years | 62.0 (±9.8), 65 [35–77] | ||
| Hoehn and Yahr stage | 2.6 (±0.5), 2.5 [1.5–4] | ||
| Years since diagnosis | 8.2 (±4.2), 7 [2–21] | ||
| Variables assessed pre- and post-DBS, mean (SD), median [range] | |||
| Assessment instrument | Pre-DBS | Post-DBS | Pre- versus post-DBSa |
| LEDD | 1126 (±629.9), 1015 [0–3450] | 380 (±231.4), 375 [0–825] | t = 9.68; corr. P = 2.1 x 10⁻¹³*** |
| BIS Attentional | 16.0 (±3.4), 16 [10–26] | 15.5 (±4.3), 15 [8–31] | t = 1.40; corr. P = 0.25 |
| BIS Non-Planning | 22.6 (±4.1), 23 [14–32] | 22.7 (±5.3), 22 [14–37] | t = −0.14; corr. P = 0.92 |
| BIS Motor | 21.5 (±3.7), 21 [14–30] | 20.7 (±3.8), 21 [13–34] | t = 1.99; corr. P = 0.11 |
| QUIP-RS Total | 20.0 (±15.3), 18 [0–63] | 18.6 (±16.6), 15 [0–66] | t = 0.80; corr. P = 0.53 |
| Delay discount, k | 0.038 (±0.064), 0.016 [0.00016–0.25] | 0.028 (±0.031), 0.016 [0.00016–0.1] | t = 1.59; corr. P = 0.19 |
| Hayling AB Error Score | 14.2 (±13.1), 9 [0–44] | 10.0 (±10.6), 5 [0–39] | t = 2.60; corr. P = 0.044* |
| ELF Rule Violations | 8.6 (±5.4), 8 [0–24] | 7.1 (±4.7), 6 [1–22] | t = 2.29; corr. P = 0.072 |
| Beck Depression Inventory | 11.0 (±5.1), 10 [2–24] | 9.3 (±8.3), 8 [0–44] | t = 1.84; corr. P = 0.14 |
| Apathy Scale | 12.0 (±4.8), 11 [2–26] | 12.3 (±5.4), 11 [3–29] | t = −0.50; corr. P = 0.83 |
| MMSE | 28.3 (±1.5), 28 [25–30] | 28.3 (±2.5), 29 [27–30] | t = 0.20; corr. P = 0.84 |
| MoCA | 26.0 (±2.3), 26 [21–30] | 26.6 (±3.0), 28 [15–30] | t = −1.95; corr. P = 0.14 |
| UPDRS Part III Motor | 39.4 (±15.1), 39 [10–70] | 32.9 (±13.0), 32 [8–60] | t = 3.80; corr. P = 0.0020** |
| Virtual casino | |||
| Average bet size (AUD) | 42.2 (±45.2), 27.2 [5–191.8] | 61.4 (±78.0), 25.7 [5–339.8] | t = −1.87; corr. P = 0.12 |
| Double or nothing gamble, % | 17.1 (±20.7), 15 [0–100] | 17.4 (±20.1), 19 [0–100] | t = −0.097; corr. P = 0.92 |
FDR-corrected with Benjamini and Hochberg method (1995), with α = 0.05.
Significance: *P < 0.05; **P < 0.01; ***P < 0.001.
BIS = Barratt Impulsiveness Scale; ELF = Excluded Letter Fluency Task; LEDD = levodopa equivalent daily dose; MMSE = Mini Mental State Examination; MoCA = Montreal Cognitive Assessment; QUIP-RS = Questionnaire for Impulsive-Compulsive disorders in Parkinson’s Disease-Rating Scale; UPDRS = Unified Parkinson’s Disease Rating Scale Part III Motor Examination.
Postoperatively, there was a significant decrease in UPDRS part III motor examination score (t = 3.80, mean difference 6.6 points, corrected P = 0.0020) and levodopa equivalent daily dose (t = 9.68, mean difference 746 mg, corrected P = 2.1 × 10⁻¹³). At a group level, there was also a significant decrease in disinhibition as assessed by the Hayling AB Error Score (t = 2.60, mean difference 4.2 points, corrected P = 0.044). There were no other significant pre-post group differences amongst the neuropsychiatric instruments assessing impulsivity or gambling behaviours (Table 1). Only 17 participants used the machine switch option in the virtual casino and this measure was hence not analysed further. There were no significant changes in cognition, depressive or apathetic symptoms across the cohort. One participant developed clinically-significant depressive symptoms and these were treated with an antidepressant. Seventeen participants developed a postoperative elevation in mood and clinically-significant impulsive behaviour attributable to stimulation (‘cases’; specific neuropsychiatric symptoms are detailed in Supplementary Table 1). Clinically significant psychiatric symptoms had remitted in these individuals at the time of postoperative assessment (device manipulations used to remit symptoms are detailed in Supplementary Table 2). Subthalamic VATs were compared amongst cases before and after remission of symptoms [Fig. 3B(i and ii)]. There was a qualitative trend for stimulation associated with acute symptoms to be located in more ventromedial aspects of the nucleus, with remission of symptoms associated with more dorsolateral stimulation (cf. red and green concatenated fields of overlapping voxels). Between case-positive and case-negative participants, there were no significant differences in dimensional variability amongst neuropsychiatric indices of impulsivity derived from the clinical assessments or gambling behaviours derived from the virtual casino (Supplementary Table 3). A history of current or past ICBs was not predictive of developing a neuropsychiatric syndrome post-DBS [χ2(1) = 0.62, P = 0.43]. Participants with a history of ICBs prior to surgery also did not differ in postoperative neuropsychiatric measures or gambling behaviours (Supplementary Table 3).
Path modelling of connectivity and impulsivity
Overview
Impulsivity was assessed using either neuropsychiatric instruments or gambling behaviours in a virtual casino. The variance in impulsivity explained by the structural connectivity of the subthalamic VAT was estimated using PLS path models. The variance explained by frontostriatal connectivity was higher for betting behaviour in the virtual casino, than for the neuropsychiatric instruments. Employing a cross-lagged model, postoperative changes in impulsivity and gambling were not significantly related to the structural connectivity of frontostriatal networks at baseline, prior to DBS. Finally, the effect of connectivity on bet size in the virtual casino differed amongst participants who developed postoperative, stimulation-dependent neuropsychiatric symptoms characterized by mood elevation, irritability, disinhibition and impulsivity reaching the threshold of clinical-significance (cases).
Barratt Impulsiveness Scale
We first examined how self-reported impulsiveness after DBS was related to the structural connectivity of networks incorporating the participant-specific stimulation field at each DBS electrode. The connectivity of the response inhibition network best explained variations in this construct. The greater the connectivity of the VAT with the response inhibition network, the greater the impulsiveness (coefficient = 0.36, P = 0.010; Table 2). The tracts weighted most heavily in the response inhibition network linked the VAT with left SMA and right IFG (Fig. 4A and Supplementary Table 4). There was no significant difference by preoperative ICB status (P = 0.57) or postoperative caseness (P = 0.33) on this effect. The connectivity of the VAT with the response inhibition network explained 15.4% of the total postoperative variance in impulsiveness.
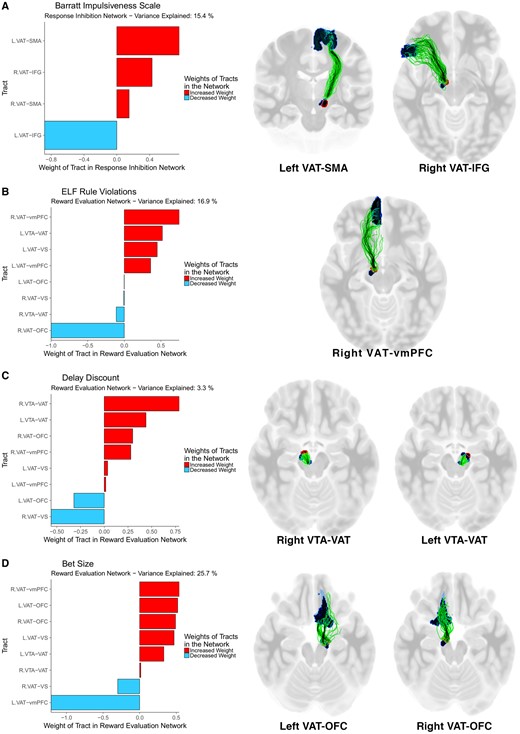
Fibre tracts weighted most strongly in the association of connectivity with impulsivity and gambling. The anatomical network with the greatest capacity to explain variance in each aspect of postoperative impulsivity and gambling. Left column: In each PLS path model, the anatomical variable representing structural connectivity was composed of a weighted mixture of all tracts in the network. Right column: The most heavily weighted tracts. (A) Barratt Impulsiveness Scale; (B) ELF rule violations; (C) Delay Discount constant k; (D) Bet size. VS = ventral striatum.
Detailed output of models from PLS-PM analysis of postoperative behaviour
| PLS-PM analysis of post-DBS impulsivity and gambling | ||||||
|---|---|---|---|---|---|---|
| Variable | Network | R2 | Path coefficient | Significance P-value | 95% CI | Other significant covariates |
| Post-DBS neuropsychiatric instruments | ||||||
| BIS | Response inhibition | 0.19 | 0.36 | 0.010* | 0.062 to 0.58 | Nil |
| ELF rule violations | Reward evaluation | 0.27 | 0.41 | 0.0017** | 0.15 to 0.62 | Nil |
| Delay Discount k | Reward evaluation | 0.14 | −0.31 | 0.042* | −1.00 to −0.049 |
|
| Post-DBS gambling behaviours | ||||||
| Bet size | Reward evaluation | 0.30 | 0.43 | 0.0029** | 0.044 to 0.64 | Nil |
Significance: *P < 0.05; **P < 0.01; ***P < 0.001.
We next used a cross-lagged model to assess the contribution of structural connectivity at baseline to postoperative changes in impulsiveness. This postoperative change was not significantly influenced by the structural connectivity of the response inhibition network prior to DBS (P = 0.071; Table 3). However, there was a significant cross-sectional association prior to DBS between impulsiveness and connectivity (coefficient = −2.38, P = 0.017), with greater connectivity of this network linked to reduced impulsivity in this domain, the opposite of the post-DBS effect (compare the sign of the coefficient in the PLS path model above). There was also a significant correlated change in connectivity and impulsivity from the pre- to the postoperative interval (coefficient 1.74, P = 0.023), suggesting a co-occurrence of connectivity and behavioural changes (Supplementary Fig. 4).
Cross-lagged model results
| Cross-lagged coefficients | Cross-sectional coefficients | Model fit indices | ||||
|---|---|---|---|---|---|---|
| Variable | Connectivityt1 → ΔBehaviour | Behaviourt1 → ΔConnectivity | Connectivityt1 ∼ Behaviourt1 | ΔConnectivity ∼ ΔBehaviour | CFI | RMSEA |
| Post-DBS neuropsychiatric instruments | ||||||
| BIS | coeff = 1.55 | coeff = 0.031 | coeff = −2.38 | coeff = 1.74 | 1.0 | 0.001 |
| P = 0.071 | P = 0.026 * | P = 0.017 * | P = 0.023* | |||
| ELF rule violations | coeff = 0.25 | coeff = 0.24 | coeff = −0.51 | coeff = 0.34 | 1.0 | 0.001 |
| P = 0.12 | P = 0.10 | P = 0.018 * | P = 0.0050** | |||
| Delay Discount k | coeff = 0.033 | coeff = −0.11 | coeff = −0.46 | coeff = −0.013 | 1.0 | 0.001 |
| P = 0.67 | P = 0.33 | P = 0.020* | P = 0.85 | |||
| Post-DBS gambling behaviours | ||||||
| Bet size | coeff = 0.045 | coeff = 0.35 | coeff = 0.53 | coeff = 0.37 | 1.0 | 0.001 |
| P = 0.78 | P = 0.056 | P = 0.0050** | P = 0.059 | |||
Significance: *P < 0.05; **P < 0.01; ***P < 0.001.
In the cross-lagged model:
(i) Connectivityt1 → ΔBehaviour represents connectivity to behaviour coupling: the extent to which structural connectivity at baseline associates with change in impulsivity and gambling at follow-up.
(ii) Behaviourt1 → ΔConnectivity represents behaviour to connectivity coupling: the degree of change in structural connectivity dependent on impulsivity at baseline.
(iii) Connectivityt1 ∼ Behaviourt1 is connectivity-behaviour covariance at baseline
(iv) ΔConnectivity ∼ ΔBehaviour is an estimate of correlated change: reflecting the degree to which connectivity and behaviour changes co-occur.
BIS = Barratt Impulsiveness Scale; CFI = Comparative Fit Index; RMSEA = root mean square error of approximation.
Questionnaire for Impulsive-Compulsive Disorders in Parkinson’s Disease-Rating Scale
There were no significant associations between dimensional ratings of behavioural addictions (such as gambling, sex, shopping and eating) and structural connectivity with the site of stimulation, either within the response inhibition or reward evaluation network.
Excluded Letter Fluency rule violations
We then evaluated how structural connectivity with the site of stimulation was related to postoperative disinhibition (as expressed by ELF rule violations). The connectivity of the reward evaluation network best explained variability in this facet of impulsivity. The greater the connectivity of the VAT with the reward evaluation network, the more inhibitory errors (coefficient = 0.41, P = 0.0017; Table 2). The tract weighted most heavily in the reward evaluation network linked the VAT with right vmPFC (Fig. 4B and Supplementary Table 5). There was no significant difference by preoperative ICB status (P = 0.62) or postoperative caseness (P = 0.78) on the effect of connectivity. The connectivity of the VAT with the reward evaluation network explained 16.9% of the total postoperative variance in disinhibition.
In the cross-lagged model, there was no significant effect of baseline structural connectivity on postoperative changes in disinhibition (P = 0.12; Table 3). Again, prior to DBS there was a cross-sectional association between connectivity and disinhibition (coefficient = −0.51, P = 0.018), with greater connectivity in the reward evaluation network associated with fewer inhibitory errors, again the opposite of the post-DBS effect. There was also a significant co-occurrence of connectivity and behavioural changes after DBS (coefficient = 0.34, P = 0.0050) (Supplementary Fig. 5).
Hayling AB Error Score
The structural connectivity of networks incorporating the participant-specific stimulation field (both response inhibition and reward evaluation) did not associate with variation in disinhibition (as expressed by Hayling A or B errors).
Delay Discount k
Last amongst the neuropsychiatric instruments, we considered delay discounting: the tendency to prefer sooner, smaller rewards over those that are larger but temporally more distant. Postoperatively, behaviour on this task was best explained by the connectivity of the site of stimulation within the reward evaluation network. The greater the connectivity of the VAT with the reward evaluation network, the lower the impatience and the greater the ability to defer reward (coefficient = −0.31, P = 0.042; Table 2). The tracts weighted most strongly in the reward evaluation network were bi-hemispheric connections between the VTA and the site of stimulation (Fig. 4C and Supplementary Table 6). There was no significant difference by preoperative ICB status (P = 0.15) or postoperative caseness (P = 0.14) on the effect of connectivity. The connectivity of the VAT with the reward evaluation network explained 3.3% of the total postoperative variance in impatience.
Using the cross-lagged model, postoperative change in impatience was not influenced by the structural connectivity of the reward evaluation network prior to DBS (P = 0.67; Table 3). At baseline, there was significant connectivity-behaviour covariance (coefficient = −0.46, P = 0.020) with greater connectivity of the reward evaluation network also associated with a greater ability to defer reward. Connectivity and behavioural changes pre- to post-DBS were not significantly correlated (P = 0.85) (Supplementary Fig. 6).
Bet size
Inter-individual variation in bet size post-DBS in the virtual casino was best explained by the connectivity of the VAT with the reward evaluation network. The greater the connectivity of the VAT with the reward evaluation network, the higher the bets in the casino (coefficient = 0.43, P = 0.0029; Table 2). Tracts weighted most heavily were those linking the stimulation field with right and left OFC, right vmPFC and left ventral striatum (Fig. 4D and Supplementary Table 7). There was no significant difference by preoperative ICB status (P = 0.27) but there was a significant difference in postoperative caseness on the effect of connectivity (coefficient case-positive = −0.90, case-negative = 0.56, P = 0.020). The connectivity of the VAT with the reward evaluation network explained 25.7% of the total postoperative variance in bet size. In a linear mixed effects model, an increase in connectivity of 1 standard error (SE) increased bet size by AUD 31.1 [±5.49, χ2(1) = 26.6, P = 2.5 × 10⁻⁷] with no significant covariates.
Baseline connectivity of the reward evaluation circuit did not predict postoperative changes in bet size (P = 0.78; Table 3). However, prior to DBS there was a significant relationship between pre-DBS bet size and baseline connectivity (coefficient = 0.53, P = 0.0050), with greater connectivity also associated with higher bets. There was no significant correlation in change between gambling and structural connectivity pre- to post-DBS (P = 0.059) (Supplementary Fig. 7).
Double or nothing gambles
The likelihood of a gambler taking on a double or nothing gamble was not associated with the structural connectivity of the site of stimulation, when the reward evaluation and response inhibition networks were entered into the PLS path models.
Fibre tracts discriminative of bet size in case-positive and case-negative participants
Subsequently, we used a normative connectome derived from individuals with Parkinson’s disease to visualize white matter fibres connected to the stimulation field. We selected fibres predictive of bet size and compared these between case-positive and case-negative participants. This allows identification of fibres associated with gambling behaviour that are also associated with pathological behaviour of a clinically-relevant nature. In case-negative participants, streamlines predictive of increased bet size passed from the diencephalon lateral to the STN and to the right vmPFC and OFC, consistent with findings from the PLS-PM analysis. In the right hemisphere, a portion of these streamlines traversed the VTA. However, in case-positive participants, right-hemispheric fibres predominantly involved the OFC rather than vmPFC. Moreover, these fibres were situated medial to the right STN and appeared to terminate/originate in the STN rather than passing into the midbrain (Fig. 5).
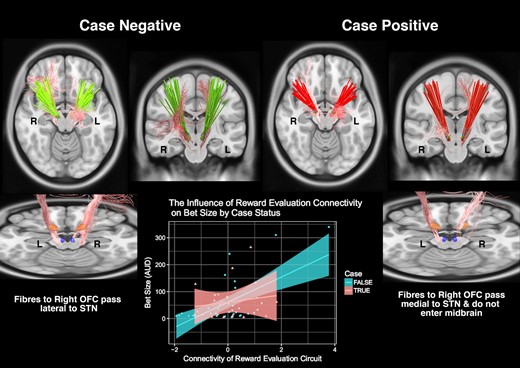
Fibre tracts weighted most strongly in the association of connectivity with gambling. Fibres that were discriminative of bet size and mediated differences between case-positive and case-negative groups. A greater proportion of fibres connecting the right STN with the right OFC were observed in case positive participants. Furthermore, these fibres appeared to run medial rather than lateral to the STN (shown in orange in the bottom right and left panels) and did not traverse the diencephalon or include the VTA (shown in blue in bottom right and left panels). The bottom middle panel visualizes the relationship between connectivity of the reward evaluation network and bet size, differentiated by caseness.
Relationship between motor and neuropsychiatric symptoms
We also investigated whether neuropsychiatric symptoms, including impulsivity, could be dissociated from postoperative improvement in UPDRS part III motor examination scores, given that treatment of motor symptoms is the core clinical objective of STN-DBS for Parkinson’s disease. Measures of postoperative impulsivity including the BIS (r = 0.41, corrected P = 0.0048), the Hayling AB Error Score (r = 0.42, corrected P = 0.0048) and Double or Nothing Gambles in the virtual casino (r = 0.42, corrected P = 0.0048) were positively correlated with UPDRS Part III score, suggesting that the greater the impulsivity, the worse were postoperative motor symptoms after STN-DBS (Supplementary Table 8). Moreover, participants who developed clinically-significant neuropsychiatric symptoms characterized by euphoria, disinhibition and impulsivity (cases) were also more likely to have a lesser postoperative improvement (or worsening) of motor symptoms (t = 2.53, mean difference 22 UPDRS points, corrected P = 0.018).
To obtain a more sensitive measure of symptomatic change after DBS, we calculated the percentage improvement in motor symptoms post-DBS (stimulation on), as compared to pre-DBS (medication ON). Placing these values into the PLS path models of our frontostriatal networks, improvement in motor symptoms was not related to the structural connectivity of the site of stimulation within the response inhibition network. However, the greater the connectivity of the stimulation field within the reward evaluation network, the lower the improvement in postoperative motor symptoms (coefficient = −0.37, P = 0.0085, 95% confidence interval = −0.62 to −0.11).
To evaluate differential effects of focal stimulation within the STN on motor and dimensional neuropsychiatric outcomes, we next analysed the position of the active contact and the distribution of the stimulation field with reference to affective, associative and motor regions of the DISTAL subthalamic atlas. To identify predictive anatomical variables, we first used a variable selection and regularization algorithm, reducing the dimensionality of the dataset and avoiding multiple testing. Candidate variables were then tested in a general linear model controlling for age, gender, LEDD and years since diagnosis of Parkinson’s disease. Only percentage change in motor symptoms was found to be related to these subthalamic variables. The closer the active contact to the centroid of the left motor subregion (z = −8.63, P = 0.0025) and the greater the distribution of the VAT within the left motor subregion (z = 0.37, P = 0.018), the greater the postoperative reduction in motor symptoms. The variable selection algorithm did not identify predictive variables for the other dimensional assessments of impulsivity (Supplementary Table 9).
Differences in focal subthalamic stimulation and connectivity amongst cases and non-cases
Differences in focal subthalamic stimulation were identified for the categorical delineation of participants into ‘cases’ and ‘non-cases’ (Supplementary Table 10). A history of caseness was significantly associated with a closer distance to the centroid of the affective subregion of the right STN (t = 3.40, mean difference 2.16 mm, corrected P = 0.0080), a further distance from the centroid of the right motor subregion (t = −4.67, mean difference 1.92 mm, corrected P = 0.00030) and lesser distribution of the stimulation field within the right motor subregion (t = 3.80, mean difference 27%, corrected P = 0.0031). However, there were no significant differences between cases and non-cases regarding the connectivity of the stimulation field with frontostriatal regions (Supplementary Table 11).
Finally, amongst participants who became cases, we simulated stimulation fields associated with the acute onset of neuropsychiatric symptoms and compared the subthalamic distribution and frontostriatal connectivity of these VATs with those simulated at the 3-month postoperative assessment when acute symptoms had remitted, because of a change in the stimulation parameters and hence the VAT [Fig. 3B(i and ii), Supplementary Tables 1 and 2]. Cases with active symptoms were more likely to have greater stimulation within the right limbic STN subregion (t = 2.48, mean difference 10%, uncorrected P = 0.024) although this did not survive correction for multiple comparisons (Supplementary Table 12). Furthermore, cases with active symptoms (i.e. before stimulation adjustment) had greater connectivity of the site of stimulation with the right OFC (t = 3.26, mean difference 1.49 apparent fibre density units, corrected P = 0.039) (Supplementary Table 13). Therefore, changes in the VAT leading to symptom resolution implicated structural connectivity of the stimulation field with the right OFC.
Discussion
In patients with Parkinson’s disease undertaking subthalamic DBS, dimensional measures of impulsivity and gambling behaviour covaried with the structural connectivity between the field of stimulation and frontostriatal networks (reward evaluation and response inhibition). The variance explained by connectivity was higher for a behavioural index of impulsivity derived from a virtual casino than for the neuropsychiatric instruments. The relative contribution of white matter tracts in each network differed for each measure, suggesting that impulsivity is a multifactorial construct in this clinical group. Notably, structural connectivity of these networks at baseline (prior to DBS) did not associate with postoperative behaviour, suggesting a primary role for the locus and distribution of stimulation in explaining this variance. Although there were no significant differences in these quantitative assessments of impulsivity amongst individuals who developed clinically-significant postoperative changes in mood and impulsive behaviour (cases), these cases could be discriminated by the interaction of connectivity and betting behaviour in the virtual casino, there being a significant difference in postoperative caseness on the effect of connectivity on bet size. These cases were not able to be discriminated prospectively based on neuropsychiatric or clinical indices, including a background of ICBs prior to STN-DBS.
Postoperatively, inter-individual variability in impulsiveness was best accounted for by a model incorporating the response inhibition network, composed of bilateral fibre tracts connecting the subthalamic VAT with the SMA and IFG. The greater the connectivity of the site of stimulation in this network, the more impulsive and disinhibited were the participants. At baseline, the inverse relationship was observed between connectivity and impulsiveness, but structural connectivity of this ‘stopping’ network preoperatively (Aron et al., 2007; Rae et al., 2015) did not pre-empt behaviour postoperatively. This finding suggests that if this structural network is incorporated into the stimulation field through placement of the DBS electrode or stimulation titration, the influence of STN-DBS may be to engender impulsivity. This accords with substantial prior literature connecting STN-DBS to impairment in action restraint (Hershey et al., 2004), action cancellation (Obeso et al., 2013) and task-switching (Witt et al., 2004), and supports prior work providing a structural substrate through which this impairment may arise (Haynes and Haber, 2013). In other words, the change in the effect of connectivity (with opposite effects on behaviour) generated by STN-DBS arises through disruption of the natural functioning of the STN within an inhibitory frontostriatal network. Before DBS, the stronger the connectivity between the STN, IFG and SMA, the lesser the impulsiveness, presumably related to a greater capacity for inhibition conferred by greater connectivity. Postoperatively, the greater the connectivity with the subthalamic VAT (denoting a greater proportion of fibres in this network influenced by the field of high-frequency stimulation) the more compromised are physiological patterns of neural signalling and the more disrupted is the capacity for behavioural inhibition. Based on the latent change score modelling, it appears that the number of fibres recruited by the VAT (which depends on the exact position of the DBS lead and the stimulation parameters) is a more important factor in the evolution of impulsive behaviour than the structure of these networks before surgery.
Inter-individual variability in disinhibition, as manifest with ELF rule violations, was best accounted for by a model incorporating the reward evaluation network—a network composed of bilateral fibre tracts connecting the subthalamic VAT with the ventral striatum, VTA, OFC and vmPFC. The most heavily weighted tract in this network linked the right subthalamic VAT with vmPFC, suggesting that the strength of the stopping signal exerted by the STN makes a key contribution to the behavioural role of this network. This ‘hyperdirect’ tract may be a means through which the STN links reward evaluation and response inhibition networks (Nambu et al., 2002; Haynes and Haber, 2013). Again, at baseline, the inverse relationship was observed between connectivity and behaviour. The weight of the right-hemisphere in the postoperative network is noteworthy, given prior work suggesting that the executive control of inhibition is primarily a right-lateralized process (Aron et al., 2004; Possin et al., 2009; D’Alberto et al., 2017). These results also support the previous finding that modulation of the right associative STN subregion after DBS for Parkinson’s disease is most likely to induce disinhibition (Mosley et al., 2018c), with this subregion most likely to show connectivity with the vmPFC in the topographically-organized STN. Again, the change in valence between pre- and postoperative conditions is likely attributable to the disruption (due to high-frequency stimulation) of the physiological ‘stopping’ signal provided by the STN, in particular to the vmPFC.
Inter-individual variability in impatience was also best explained by the connectivity of the reward evaluation network. Here, there was no dissociation by valence pre- and post-DBS; at both intervals stronger network connectivity was associated with a greater ability to delay gratification in the service of a larger reward. However, the variance explained by connectivity was small for this measure.
For two neuropsychiatric outcomes, the QUIP-RS and the Hayling AB Error Score, there was no significant relationship between inter-individual variability and structural network connectivity with the participant-specific stimulation field. For the QUIP-RS, it may be that the substantial postoperative reduction in dopaminergic medication affects measurement of this construct, given that STN-DBS (with its attendant reduction in LEDD) has been advanced as a treatment for compulsivity (Lhommee et al., 2012; Eusebio et al., 2013). In the Hayling test, it may be that the AB error score is too coarse a measurement of disinhibition, given that a finer-grained analysis of this instrument has shown differing anatomical specificity of A and B errors (Robinson et al., 2015; Cipolotti et al., 2016). Further work will be necessary to understand these findings.
Brain-behaviour covariations were stronger for betting behaviour in the virtual casino than for the neuropsychiatric instruments. The greater the connectivity of the subthalamic VAT with the reward evaluation network, the higher the bets made by participants, with an increase of 1 SE in connectivity associated with an increased bet of AUD 31.1. The involvement of bilateral tracts connecting the site of stimulation with OFC is particularly interesting given the role of this region in predicting outcomes after behavioural choices (Rudebeck and Murray, 2014) and contributing to prediction error signalling in ascending dopaminergic projections from the VTA (Takahashi et al., 2011). This also lends further support to the idea that spread of electrical stimulation into ventromedial regions of the STN can quantitatively influence impulsivity.
An alternative explanation for these findings is that the subthalamic VAT modulates ascending dopaminergic fibres in the superolateral branch of the medial forebrain bundle (slMFB), which pass adjacent to the STN and onwards to vmPFC and OFC (Coenen et al., 2009, 2012). Lateral orbitofrontal branches of the slMFB traverse the ventral striatum via the anterior limb of the internal capsule, potentially explaining why the ventral striatum is also weighted heavily in the reward evaluation network for bet size (Coenen et al., 2018). Appetitive learning and reinforcement are underpinned by dopaminergic signalling within mesocorticolimbic networks (Haber and Knutson, 2010) and it is plausible that STN-DBS could directly affect the evaluation of reward in this manner outside of any direct effect on STN firing.
The distinction observed between case-positive and case-negative participants in the effect of connectivity on bet size offers an insight into these alternative hypotheses. In case-negative individuals, the effect of connectivity has a strong positive valence, whilst visual inspection of individual discriminative fibres isolated from a normative connectome shows ascending tracts passing through the VTA and adjacent to the STN in the right hemisphere, distributed widely amongst vmPFC and OFC. Therefore, in such individuals, it is plausible that direct modulation of the slMFB is operating to mediate this relationship. However, in case-positive individuals, this relationship between connectivity and bet size is not observed. Visual inspection of discriminative fibres shows tracts between the STN and right OFC that do not extend into the diencephalon. These fibres conceivably represent direct cortical-STN connections that drive STN output and behavioural inhibition. These findings converge with our previous work demonstrating that ventromedial dispersion of the stimulation field within the right STN was more likely to be associated with disinhibition and the development of clinically-significant hypomania and harmful impulsivity (Mosley et al., 2018c). Furthermore, our finding that cases with active neuropsychiatric symptoms differed in the connectivity of the stimulation field with the right OFC further implicates this prefrontal region in the genesis of these clinically-significant behavioural changes.
More generally, our finding that participants with clinically-significant neuropsychiatric symptoms after STN-DBS did not differ from other participants on raw behavioural indices derived from the virtual casino, aligns with recent work demonstrating a more nuanced relationship between connectivity and behaviour in Parkinson’s disease. In a previous study of non-surgical patients with Parkinson’s disease (Mosley et al., 2019a), we found no difference in gambling behaviours between participants with and without a history of ICBs. However, we observed a scaling of structural connectivity in the reward evaluation network and impulsive gambling in the virtual casino, which was present only amongst participants without ICBs and not amongst those with ICBs. The observed differences in the scaling of connectivity and behaviour between clinical groups such as these may progress the neuroimaging-based identification of patients vulnerable to neuropsychiatric complications of treatment.
An important question is whether optimal improvement in motor symptoms after STN-DBS is correlated or anti-correlated with impulsive behaviour. In other words, is impulsivity an unfortunate but unavoidable corollary of the relief of akinesia, rigidity and tremor? Or alternatively, does impulsivity suggest a suboptimal focal stimulation profile or suboptimal pattern of network modulation (Volkmann et al., 2010)? Our results suggest that motor and non-motor symptoms were dissociable in this cohort. Impulsive participants were more likely to have worse motor symptoms after DBS and frontostriatal network modulation was also associated with a lesser improvement (or worsening) of motor symptoms postoperatively. Additionally, improvement in motor symptoms was associated with greater stimulation of the motor subregion of the STN, whilst dimensional neuropsychiatric variables showed no association with focal STN stimulation. Furthermore, the development of clinically-significant neuropsychiatric symptoms (caseness) was associated with greater motor symptoms, as well as with greater stimulation of the right associative STN and lesser stimulation of the right motor subregion. Overall, these findings imply the existence of a connectivity target that could optimize motor symptoms whilst minimizing neuropsychiatric side effects. These findings are also supported by prior work in which stimulation of the hyperdirect pathway between the STN and pre-SMA was not associated with improved motor symptoms, but did lead to faster reaction times with more erroneous movements (i.e. impulsive and error-prone) in a complex motor task requiring inhibitory control (Neumann et al., 2018). Modulation of the effectivity connectivity in the hyperdirect pathway between STN and cortex has also been associated with a reduction in the clinical effectiveness of STN-DBS (Kahan et al., 2014). Optimal patterns (‘sweet spots’) of focal stimulation, in addition to structural and functional signatures of effective subthalamic stimulation have been defined with reference to the anti-parkinsonian effects of STN-DBS (Akram et al., 2017; Horn et al., 2017, 2019b; Dembek et al., 2019). It is anticipated that these will continue to be refined to incorporate neuropsychiatric indices.
A related question is whether it is stimulation of the target nucleus that leads to neuropsychiatric side effects, or whether dispersion of the stimulation field outside of the STN modulates adjacent fibre tracts responsible for these symptoms. The clinical relevance of this question again pertains to targeting and stimulation titration: can neuropsychiatric symptoms be avoided by more accurate electrode placement and focal stimulation only within the STN? The association between focal stimulation of the motor STN subregion and improvement in motor symptoms, as well as the relationship of ascending tegmental fibres with bet size in the virtual casino also suggests a dissociation here. Whilst the highest probability of stimulation in our cohort was within the dorsolateral region of the STN (Fig. 3), inevitably there is dispersion of charge into the surrounding tissue. However, we cannot definitively resolve this question with our connectivity analysis, which is agnostic to the origin of fibre projections and the mechanism of DBS at the cellular level.
A number of caveats need to be considered when interpreting these results. First, although we found that the structural connectivity of frontostriatal networks at baseline did not associate with postoperative changes in impulsivity, it is important to note that we did not model all potentially-relevant demographic and disease-related covariates in the latent change score models. We opted for a more parsimonious representation, with the aim of characterizing a structural signal of vulnerability to postoperative impairment and avoiding statistical complexity. Moreover, we note that these covariates were not found to have a significant relationship with postoperative behaviour in the PLS-PM analyses or linear mixed effects modelling (only years since diagnosis of Parkinson’s disease affected Delay Discount performance). Second, our case-positive participants were assessed after stimulation manipulation had taken place to remediate more florid neuropsychiatric symptoms. Therefore, the distribution of stimulation associated with clinical hypomania will have been slightly different to that recorded at the formal postoperative assessment. However, we could still discriminate these groups in our virtual casino even after resolution of clinically-significant symptoms, based on the relationship between connectivity and bet size. This suggests that our assay was relatively sensitive and arguably improves the robustness of our findings. Third, the methodology employed in the isolation of discriminative fibres from the normative connectome involved mass-univariate tests across many connected fibres without controlling for the false discovery rate and thus must be viewed with caution. Finally, our method of assessing improvement in motor symptoms by comparing medication ON (prior to DBS) and stimulation on (after DBS) was not optimal in this regard (ideally motor symptoms should be assessed ‘off’ and ‘on’ at both intervals). However, we found that our participants were too impaired to tolerate a drug/stimulation washout as well as complete the extensive battery of neuropsychiatric instruments. Similarly, assessing performance on these instruments and the virtual casino both on and off DBS was prohibited by the emergence of severe motor symptoms in this cohort once stimulation was interrupted. This necessarily limits definitive conclusions regarding the role of electrical stimulation in disrupting these non-motor networks. Future work targeting a younger, less severely-affected cohort might permit such an on/off design.
In conclusion, STN-DBS is an established and valuable intervention for the motor symptoms of Parkinson’s disease. However, there are relatively frequent and important neuropsychiatric changes which affect postoperative quality of life. We have demonstrated that the structural connectivity of the site of stimulation with reward evaluation and response inhibition networks is a major determinant of dimensional variability in postoperative impulsivity. Our results also suggest that the connectivity of the stimulation field with the prefrontal cortex (specifically the OFC) relates to the development of categorical changes in mood and behaviour of clinical significance. Structural connectivity of these networks at baseline was not associated with postoperative neuropsychiatric outcomes, suggesting that electrode placement and accurate stimulation titration are key drivers of these non-motor outcomes, over-riding and even reversing preoperative effects. It further highlights the difficulty of identifying an ‘at-risk’ phenotype prior to neurosurgery. In summary, the lack of a preoperative connectivity ‘fingerprint’ signifying susceptibility to postoperative impulsive behaviour is of clinical relevance to surgical teams planning STN-DBS for Parkinson’s disease, because it suggests that neuropsychiatric side-effects, as well as symptomatic benefit, arise from the modulatory effects of the stimulation field on connected networks. As more neurosurgical centres employ tractography to improve DBS electrode targeting, contact selection and current steering for Parkinson’s disease, we anticipate that these findings will assist with adapting these methods to address neuropsychiatric outcomes.
Acknowledgements
The authors gratefully acknowledge the commitment of participants and caregivers who contributed their time to this study. The authors acknowledge the ongoing support of St Andrew’s War Memorial Hospital and the Herston Imaging Research Facility. The authors thank Till Dembek for assistance with modelling the field of stimulation in directional leads.
Funding
P.E.M. was supported by an early career fellowship from the Queensland government’s ‘Advance Queensland’ initiative, a Royal Brisbane and Woman’s Hospital Foundation Research Grant and a young investigator grant from the Royal Australian and New Zealand College of Psychiatrists. He received an unrestricted educational grant from Medtronic. M.B. was supported by the National Health and Medical Research Council (118153, 10371296, 1095227) and the Australian Research Council (CE140100007). K.E.S. was supported by the University of Zurich and the René and Susanne Braginsky Foundation. A.P. acknowledges the current support of Dr Douglas Garrett’s funding from the Emmy Noether Programme grant (German Research Council) and the Max Planck UCL Centre for Computational Psychiatry and Ageing Research.
Competing interests
The authors report no competing interests.
References
R Core Team.
Schuepbach WM, Rau J, Knudsen K, Volkmann J, Krack P, Timmermann L, et al. Neurostimulation for Parkinson's disease with early motor complications. N Engl J Med 2013;
- DBS =
deep brain stimulation
- ICB =
impulse control behaviour
- IFG =
inferior frontal gyrus
- OFC =
orbitofrontal cortex
- SMA =
supplementary motor area
- STN =
subthalamic nucleus
- VAT =
volume of activated tissue
- vmPFC =
ventromedial prefrontal cortex
- VTA =
ventral tegmental area
Author notes
Alistair Perry and Michael Breakspear contributed equally to this work.

