


Abstract
Intrinsic regulatory factors play critical roles in early cortical patterning, including the development of the anteroposterior (A-P) axis. To identify genes that are differentially expressed along the A-P axis of the developing cerebral cortex, we analyzed gene expression in presumptive frontal, parietal, and occipital cerebral walls of E12.5 mouse using complementary DNA microarrays. We identified 106 genes, including expressed sequence tags (ESTs), expressed in an A-P gradient in the embryonic brain and screened 88 by in situ hybridization for confirmation. Central nervous system (CNS) expression patterns of many of these genes were previously unknown. Others, such as Sfrp1, CoupTF1, and FABP7, were expressed in a manner consistent with previous studies, providing independent confirmation. Two related transcription factors, previously not implicated in CNS development, Fhl1 and Fhl2, were observed to be enriched in posterior and anterior telencephalon, respectively. We studied patterning gradients in Fhl1 knockout mice but observed no changes in gene expression related to A-P regionalization in the Fhl1 knockout mice. These data provide an important set of new candidates for studies of cortical patterning and maturation.
Introduction
There has been significant progress in our understanding of the processes of regional patterning in the cerebral cortex during embryogenesis. The now classic and enduring model for cortical regionalization is the “protomap” model (Rakic 1988) in which the cells derived from neural progenitors have distinct intrinsic identity that drives regionalization. A growing body of data demonstrates that intrinsic gradients of homeobox transcription factors, such as Emx2 and Pax6, and other signaling molecules play a critical role in cortical regionalization (Miyashita-Lin et al. 1999; Bishop et al. 2000, 2002; Mallamaci et al. 2000; Muzio et al. 2002a,b; Muzio and Mallamaci 2003; Sansom et al. 2005). Otx1 and Otx2 provide further examples of homeobox transcription factors with restricted expression patterns that are involved in proper cortical organization and development (Acampora, Avantaggiato, et al. 1999; Acampora, Barone, et al. 1999). The identification of genes, many of which are transcription factors, with distinct temporal and spatial gradients in the developing telencephalon show that there are intrinsic mechanisms controlling early cortical regionalization and that the pattern of gene expression is functionally relevant (Levitt et al. 1997; Miyashita-Lin et al. 1999).
To further define other factors that show spatial gradients during the period of cortical regionalization, we used a genomic screening approach based on custom complementary DNA (cDNA) microarrays to assess gene expression gradients during corticogenesis. We chose to study gene expression at E12.5, a time during which time intrinsic signals are known to direct early telencephalic patterning (Barbe and Levitt 1991; Arimatsu et al. 1992; De Carlos and O'Leary 1992; Cohen-Tannoudji et al. 1994). We identified 106 genes with consistent and significant (P < 0.01) anteroposterior (A-P) gene gradients. We analyzed the majority of identified gene expression patterns (n = 88) using in situ hybridization and reverse transcription–polymerase chain reaction (RT-PCR) and confirmed a gradient of telencephalic expression for a subset of genes. We also investigated the role of one of these genes, Fhl1, a transcription factor without a previous known role in cortical development, in vivo (Morgan et al. 1995; Morgan and Madgwick 1996). We were unable to demonstrate a clear anterior–posterior patterning phenotype in Fhl1 knockouts, suggesting either redundancy with other close family members or a role in later neuronal maturation. This gene and other transcription factors, or signaling molecules identified here clearly provide an important group of genes for future study of cortical development.
Materials and Methods
Dissections and RNA Preparation
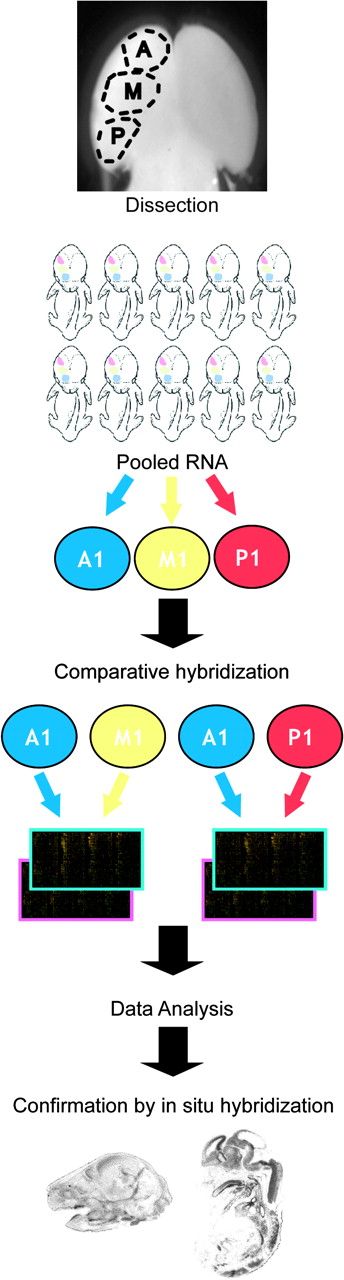
Anterior, middle, and posterior regions of the dorsal pallium, the forerunners of frontal parietal and occipital cortical areas, were dissected (A, M, P) from E12.5 C57Bl6J mice from Jackson Laboratory. Anatomical limits were chosen to increase reproducible dissection of samples. The cut between the anterior and the middle regions was made about 1–2 mm behind the middle of the ganglionic eminence because there are no surface landmarks. The posterior section is a tissue slice of approximately 2 mm above the rhinal sulcus identifiable at E12.5. Four litters were dissected resulting in 4 sets of pooled, independent replicate samples. The microdissected regions were flash frozen on dry ice and stored at −80 °C. Total RNA was extracted from each of the pooled samples using TRIzol reagent (GibcoBRL, Carlsbad, CA) according to the manufacturer's recommendations. RNA 6000 Nano Assay (Agilent Technologies, Palo Alto, CA) and Agilent 2100 Bioanalyzer software were used to analyze and quantify the RNA samples. Only high-quality RNA samples were used, for example 28S:18S ratio > 1.6 and A260/280 ∼2.0 (Ultrospec 2000, Pharmacia, Piscataway, NJ).
Fhl1 Knockout Animals
Fhl1 knockouts had been generated on a black Swiss background by inserting a LacZ sequence into the Fhl1 locus (Chu, Ruiz-Lozano, et al. 2000). Because Fhl1 is located on the X chromosome, heterozygous females were mated to wild-type males to generate Fhl1 knockout males and wild-type littermates. Genotyping of the animals was performed by using 2 sets of primers for wild-type and the knockout, for which the primers incorporate a portion of the LacZ gene.
Microarrays
Transcripts were analyzed using a mouse 10 000-element custom cDNA microarray printed at University of California at Los Angeles (UCLA) in collaboration with the microarray core (http://www.genetics.ucla.edu/microarray/) containing 7604 known genes and 1383 ESTs. This array is based on an Incyte cDNA library, which has highly reproducible and confirmable gene expression (Karsten et al. 2003). Four independent experiments were carried out using the pooled samples (A, M, and P) to compare A versus M and A versus P (Fig. 1). For each comparison 2 hybridizations were made with the dyes reversed in order to account for dye incorporation effects. A total of 16 array hybridizations were performed. Labeling and detection of cDNA were performed according to the tyramide signal amplification protocol (NEN, PerkinElmer) with minor modifications (Karsten et al. 2002). cDNA probes synthesized from 2 μg of total RNA of a pooled sample were independently labeled with either Cy3 or Cy5 fluorophore for each slide.
Flowchart schema of the microarray experiment. The schematic represents the steps for an experiment. Dorsal dissections of A, M, and P from each litter were combined to obtain pooled RNA samples, which were consequently used to for comparative hybridizations of A versus M and A versus P on cDNA microarrays. Each comparison was run in duplicate with a dye flip, resulting in a total of 4 slides per litter. The microarray experiment presented used 4 litters for a total of 16 slides.
Images were analyzed using ImaGene 4.2 (Biodiscovery, Marina del Rey). Quantified signal intensity data were downloaded into Genesight 3.0 (Biodiscovery) and analyzed as described below. Poor quality spots flagged in ImaGene were omitted, and local background correction was performed. Signals with values below 20 were given a low positive value (=20). The ratios of signal intensities were log transformed for each hybridization, and normalized ratios were combined for each dye-flip experimental pair following global normalization. Genes differentially regulated in 2 conditions throughout were identified based on passing a statistical threshold of the 99.5% confidence interval, a stringent criteria (Genesight 3.0). The resulting gene list was narrowed (Karsten et al. 2003) by thresholding those genes with a ratio of at least 1.5 in at least 3 out of the 4 replicate experiments for either A versus M or A versus P. For genes showing similar trends in both comparisons, the criterion was such that at least 4 out of the total of 8 experiments had a ratio of 1.5 or above.
Tissue and Slide Preparation
Tissue samples were flash frozen upon dissection and stored at −80 °C until use. Human tissue was obtained from the National Institutes of Health (NIH) Maryland Brain and Tissue Bank under a protocol approved by the UCLA Institutional Review Board. Cryostat sections of 20 μm were cut and thaw-mounted onto Fisher Superfrost Plus slides. For in situ hybridization, sections were air dried, fixed in 4% paraformaldehyde (PFA) in 0.1 M phosphate buffer (PB) for 20 min, washed in PB for 5 min., rinsed in H2O, dried at room temperature (RT), then stored at −80 °C until use. Slides for immunohistochemistry and for X-gal staining were air dried and stored at −80 °C until use without treatment.
In Situ Hybridization
Tissues fixed on slides were washed/incubated in the following series of solutions at RT: 1) 0.1 M glycine in PB twice for 3 min each, 2) PB for 15 min, 3) 0.25% acetic anhydride, 1.3% tris-acetate buffer in PB for 10 min, 4) 2× sodium chloride-sodium citrate (SSC) twice for 15 min each, 5) 50, 70, 95, and 100% ethanol for 1 min each, 6) chloroform for 5 min, 7) 100 and 95% ethanol for 1 min each. Probes were diluted in hybridization solution to 106 counts/mL. Hybridized slides were coverslipped, sealed with DPX mountant (Gallard Schlesinger, Plainview, NY), and incubated overnight at 60 °C. Following hybridization, slides were washed in the following series of solutions: 1) 4× SSC twice for 20 min each at 60 °C, 2) 30 μg/mL RNase A in RNase buffer for 30 min at 45 °C, 3) 2× SSC 4 times for 20 min at RT, 4), 0.5× SSC twice for 20 min at 60 °C, 5) 0.1× SSC for 20 min at 60 °C, 6) 0.1× SSC for 20 min at RT. Slides were briefly rinsed in H2O, and then air dried. Hybridized slides were opposed to film prior to dipping in Kodak NTB2 emulsion. Following exposure to emulsion at 4 °C the slides were developed, stained with Cresyl violet or hematoxylin and eosin, coverslipped with Permount (Fisher, Houston, TX), and photographed in bright and dark field optics (SPOT).
Probe Synthesis
Inserts from clones spotted on the microarrays were used as templates to generate strand-specific 35S-labeled cRNA probes for in situ hybridization. Bacteria from glycerol stocks were grown in LB + ampicillin media, and the vectors containing the inserts were purified using Miniprep (Qiagen, Valencia, CA), which were subsequently digested with appropriate enzymes to produce linearized plasmids.
Fhl1Bm-specific probe template was generated by PCR, using primers up- and downstream of the alternately spliced region that contained fewer shared sequences with the other isoforms. The primer pair used for Fhl1Bm was 5′-TGTGGCCAAGAAGTGTGCT-3′ and 5′-AGTAGTCGTGCCAGGATTGTC-3′. The PCR product shares about 50 bp on either end of its sequence with AA047966, with about 200 bp specific to Fhl1Bm isoform, which should minimize binding to the other isoforms. The PCR product was gel purified and cloned into a vector (Invitrogen, Carlsbad, CA), and was subsequently used as a template to generate strand-specific 35S- and 32P-labeled cRNA probes for in situ hybridization and Northern blots, respectively.
Northern Blots
Total RNA was extracted from E14 embryos, E17 head, and brains from P0, P7, P14 and P21, using TRIzol reagent (GibcoBRL) according to the manufacturers recommendations. From each sample 10 μg of total RNA was run on a 1.5% agarose/formaldehyde gel in N-(2-hydroxyethyl)piperazine-N′-(2-ethanesulfonic acid)/ethylenediaminetetraacetic acid buffer. Transfer of electrophoresed RNA was carried out onto Nytran SPC (Schleicher & Schuell, Florham Park, NJ) overnight via capillary transfer. Single-stranded DNA probe for the Fhl1 clones was obtained by restriction digestion from the plasmid vector and purified through columns (Qiagen). The probes were labeled with 32P-deoxy-cytidine triphosphate using strand-specific StripEZ RNA Kit (Ambion). The membrane was hybridized with Ultrahyb (Ambion) containing 106 cpm/mL of probe overnight and washed as previously described (Geschwind et al. 2001). The blots were opposed to Kodak AR film against an intensifying screen.
Semiquantitative RT-PCR
Primers for Fhl1 (Taniguchi et al. 1998) were used to test the differential expression by semiquantitative RT-PCR from the pooled RNA samples from A, M, and P. cDNA was reverse transcribed from pooled RNA samples (Promega, Madison, WI), and semiquantitative expression analysis was performed by incorporating SYBR Green I dye into the RT-PCR product. Primers for mouse ribosomal RNA 18S (5′-GTAACCCGTTGAACCCCATT-3′ and 5′-CCATCCAATCGGTAGTAGCG-3′) were used in conjunction for normalization. Typhoon 9410 (Amersham Biosciences, Piscataway, NJ) was used to scan and quantitate the RT-PCR products. For each pooled region of A, M, and P, 500 ng of RNA was used with random primers for cDNA synthesis (Promega). A total of 18 PCR reactions were performed with 3 different pools of RNA. Reactions of 20 μL containing 2 μL of cDNA, 0.2 mM dNTP, 0.2 μM Fhl1 primers (each), 0.0375 μM control primers for ribosomal RNA (each), and 0.5 U Taq polymerase, were run from 21 to 26 cycles. The program used was 1) 2 min at 94 °C, 2) 40 s at 94 °C, 3) 30 s at 61 °C, 4) 1 min at 72 °C, 5) repeat (2)–(4) 20–25 times, (4) 5 min at 72 °C. The products (10–16 μL) were run on agarose gels, and incubated in 1:10 000 dilution of SYBR Green in H2O for 30 min. The gel was subsequently scanned and quantified using the Typhoon 9410 (Amersham).
LacZ Staining
Staining for β-Gal activity was performed as described in Schmidt et al. (1998). Briefly, tissue on slides were fixed in 0.2% glutaraldehyde for 2 min then washed twice for 5 min. each in phosphate-buffered saline (PBS) at RT. Slides were incubated in freshly made staining solution overnight at RT. Subsequent to a short rinse in H2O, slides were counterstained with eosin and mounted with Permount (Fisher).
Immunohistochemistry
Sections on slides were washed and incubated in the following series of solutions at RT unless otherwise stated: 1) 4% PFA for 20 min, 2) PBS 3 times for 5 min each, 3) 0.5% TritonX-100 in PBS for 1 h, 4) PBS 3 times for 5 min each, 5) 50 mM NH4Cl in PBS for 20 min, 6) PBS 3 times for 5 min each, 7) 5% goat serum in 0.01% TritonX-100 in PBS for 1 h, 8) primary antibody incubation in the blocking solution at dilutions ranging from 1:5000 to 1:1000 overnight in 4 °C, 9) PBS 4 times for 20 min each, 10) secondary antibody incubation in blocking solution 1:5000 dilution for 1 h, 11) PBS 4 times for 20 min each. Slides were mounted with Aqua Poly Mount (Polysciences, Warrington, PA). Images were scanned using Leica confocal microscope.
Results
Microarray Expression Results
E12.5 mice were chosen for the microarray analysis because it is relatively early cortical neurogenesis and corresponds to the stage of early intrinsic regionalization and specification of cortical regions (Barbe and Levitt 1991, 1992, 1995; McConnell and Kaznowski 1991; Muzio et al. 2002b; Muzio and Mallamaci 2003). The dissections were performed by removing the dorsal portions of the isolated cerebral hemispheres (Fig. 1). Each litter, consisting of an average of 10 unborn pups of both sexes, was dissected and the resulting samples pooled by region. RNA quality was checked, and in total, 4 pools were used for 2 microarray comparisons of A versus M and A versus P, for a total of 16 slides, including dye swapping. Eighty-eight percent of arrayed clones were identified as present, as they generated average signal intensity greater than local background (Mean Negative Control was subtracted from Mean Signal, and those below 0 are omitted.) when hybridized by A, M, or P samples.
The analysis of the array data revealed 106 known genes and ESTs that are differentially expressed along the anterior–posterior axis (Table 1). Of the 80 genes with higher expression levels in anterior cortical anlage (at least in one of the 2 comparisons), 74 were known or annotated and 6 were ESTs. For the 26 genes identified to be posteriorly enriched (in at least one of the 2 comparisons), there were 25 known or annotated genes and 1 EST. CoupTF1 was found to be differentially expressed at the 99.5% confidence limit, but did not pass the more stringent a second screen (see Methods). Other genes known to be involved in cortical regionalization, such as Emx1 and Pax6 were not included on the array, and thus were not identified.
Anterior- and posterior-enriched genes identified by microarray
| Accession no. | Symbol | Name | In situ hybridization |
| Genes with anterior-enriched expression | |||
| AA073913 | Amn | Amnionless | UI |
| W75669 | Anapc2 | Anaphase-promoting complex subunit 2 | — |
| AA120679 | Arl7 | ADP-ribosylation factor-like 7 | + |
| W96830 | Brp16 | Brain protein 16 | UI |
| W36837 | Cacnb1 | Calcium channel, voltage-dependent, β1 subunit | + |
| W65230 | Cldn13 | Claudin 13 | — |
| AA120697 | Clec1b | C-type lectin-like receptor 2 | + |
| AA108438 | Cml4 | Camello-like 4 | UI |
| W63987 | Cnp1 | Cyclic nucleotide phosphodiesterase 1 | UI |
| AI594926 | Dcpp | Demilune cell and parotid protein | — |
| AA008734 | Ddx27 | DEAD (Asp–Glu–Ala–Asp) box polypeptide 27 | — |
| W45825 | Dyrk2 | dual-specificity tyrosine-(Y)-phosphorylation regulated kinase 2 | +CTX |
| AA008687 | Ecgf1 | Endothelial cell growth factor 1 (platelet-derived) | — |
| AA032559 | Eef2k | Eukaryotic elongation factor-2 kinase | UI |
| AA289606 | Elk3 | ELK3, member of ETS oncogene family | + |
| AA060723 | Etfa | Electron transferring flavoprotein, alpha polypeptide | — |
| AI385754 | Fabp7 | Fatty acid binding protein 7, brain | |
| AA031219 | Fbxl17 | F-box and leucine-rich repeat protein 17 | + |
| AA023645 | Fhl2 | FHL domains 2 | +CTX |
| AA002314 | Flt3l | FMS-like tyrosine kinase 3 ligand | — |
| AA060844 | Fxyd6 | FXYD domain-containing ion transport regulator 6 | |
| AA175441 | Ggta1 | Glycoprotein galactosyltransferase alpha 1, 3 | UI |
| AA466087 | H2afz | H2A histone family, member Z | — |
| W10072 | Igf1 | Insulin-like growth factor 1 | |
| AA175538 | Il7r | Interleukin 7 receptor | — |
| AA403846 | Kitl | Kit ligand | + |
| W97446 | Klf1 | Kruppel-like factor 1 (erythroid) | |
| W66749 | Letmd1 | LETM1 domain containing 1 | |
| AA003791 | Loxl2 | Lysyl oxidase–like 2 | |
| AA231293 | Meox2 | Mesenchyme homeobox 2 | — |
| AA098361 | Mfhas1 | Malignant fibrous histiocytoma amplified sequence 1 | UI |
| AA033466 | Mpo | Myeloperoxidase | — |
| AA109944 | Myo7b | Myosin VIIb | + |
| AA473269 | Ndrg1 | N-myc downstream regulated 1 | + |
| W85646 | Nek9 | NIMA (never in mitosis gene a)–related expressed kinase 9 | + |
| AI425728 | Nupl1 | Nucleoporin like 1 | + |
| AA119236 | Nvl | Nuclear VCP-like | |
| W14332 | Pcbd | 6-Pyruvoyl-tetrahydropterin synthase dimerization cofactor of hepatocyte nuclear factor 1 alpha | + |
| W98241 | Pcsk5 | Proprotein convertase subtilisin/kexin type 5 | + |
| AA062140 | Pitx3 | Paired-like homeodomain transcription factor 3 | — |
| AA031057 | Ppp2r2b | Protein phosphatase 2 (formerly 2A), regulatory subunit B (PR 52), β isoform | |
| AI429829 | Rab13 | RAB13, member RAS oncogene family | |
| AA275118 | Rap2c | RAP2C, member of RAS oncogene family | UI |
| CA748280 | Rbp1 | Retinol binding protein 1, cellular | |
| W80210 | Rbpms | RNA binding protein gene with multiple splicing | — |
| AA184614 | Rhof | Ras homolog gene family, member f (in filopodia) | + |
| AA000347 | Sec24c | SEC24 related gene family, member C (Saccharomyces cerevisiae) | UI |
| AA268953 | Sfrp1 | Secreted frizzled-related sequence protein 1 | +CTX |
| AA175259 | Sh3kbp1 | SH3-domain kinase binding protein 1 | + |
| AA413194 | Slc25a13 | Solute carrier family 25 (mitochondrial carrier; adenine nucleotide translocator), member 13 | +CTX |
| AI467559 | Slit3 | Slit homolog 3 (Drosophila) | UI |
| AA000223 | Smoc1 | SPARC related modular calcium binding 1 | +CTX |
| AA200737 | Snap25bp | Synaptosomal-associated protein 25 binding protein | + |
| W34018 | Spnb1 | Spectrin β1 | |
| AA062142 | Sprrl7 | Small proline rich-like 7 | UI |
| AA038788 | Stc | Stanniocalcin | UI |
| AA270232 | Tal1 | T-cell acute lymphocytic leukemia 1 | UI |
| AA547208 | Tcl1 | T-cell lymphoma breakpoint 1 | — |
| W59265 | Trio | Triple functional domain (PTPRF interacting) | + |
| AA522127 | Uqcrc2 | Ubiquinol cytochrome c reductase core protein 2 | |
| W49208 | Usp29 | Ubiquitin specific protease 29 | — |
| AA061458 | Usp52 | Ubiquitin specific protease 52 | |
| AA002636 | 2310030G09Rik | Similar to zinc finger protein 560 | + |
| AA003367 | Wdr33 | WD repeat domain 33 | UI |
| W97244 | 1810012P15Rik | RIKEN cDNA 1810012P15 gene | UI |
| AA163996 | 3110048L19Rik | RIKEN cDNA 3110048L19 gene | UI |
| AA145137 | 4930420O11Rik | RIKEN cDNA 4930420O11 gene | + |
| AA144046 | 4930432B04Rik | RIKEN cDNA 4930432B04 gene | UI |
| AI413838 | 5430413K10Rik | Similar to RIKEN cDNA 5430413K10 | UI |
| AA170335 | 5830403E09Rik | RIKEN cDNA 5830403E09 gene | UI |
| AA204360 | AA960558 | Expressed sequence AA960558 | UI |
| BX527908 | B230369L08Rik | RIKEN cDNA B230369L08 gene | UI |
| AA002786 | BC023488 | cDNA sequence BC023488 | UI |
| W59215 | BC037527 | cDNA sequence BC037527 | — |
| AK053778 | C80587 | Expressed sequence C80587 | |
| AA217113 | Similar to very large inducible GTPase-1 | UI | |
| AA050124 | EST, unknown | UI | |
| AA155387 | EST, unknown | UI | |
| W70958 | EST, unknown | UI | |
| W77508 | EST, unknown | UI | |
| Genes with posterior-enriched expression | |||
| AA245324 | Aip | Aryl-hydrocarbon receptor-interacting protein | — |
| AA064247 | Coro7 | Coronin 7 | |
| AA008001 | Ctsb/Fdft1 | Cathepsin B | UI |
| AA073904 | Dkk3 | Dickkopf homolog 3 (Xenopus laevis) | +CTX |
| AA153223 | Dusp11 | Dual-specificity phosphatase 11 (RNA/RNP complex 1-interacting) | |
| AA544895 | Farp1 | FERM, RhoGEF (Arhgef) and pleckstrin domain protein 1 (chondrocyte-derived) | +CTX |
| AA047966 | Fhl1 | FHL domains 1 | +CTX |
| AA030294 | Fzd1 | Frizzled homolog 1 (Drosophila) | +CTX |
| AA255078 | Galk1 | Galactokinase 1 | UI |
| AA048560 | Gart | Phosphoribosylglycinamide formyltransferase | +CTX |
| AA289992 | Ifitm2 | Interferon-induced transmembrane protein 3-like | +CTX |
| AA261160 | Mcam | Melanoma cell adhesion molecule | +CTX |
| W55827 | Nfix | Nuclear factor I/X | +CTX |
| W98998 | Notch1 | Notch gene homolog 1 (Drosophila) | — |
| BX513775 | Pfas | Phosphoribosylformylglycinamidine synthase (FGAR amidotransferase) | |
| AA015088 | Prpf3 | PRP3 pre-mRNA processing factor 3 homolog (yeast) | |
| AA253750 | Rbm9 | RNA binding motif protein 9 | + |
| AA518455 | SEF2/Tcf4 | Transcription factor 4 | +CTX |
| W17647 | Ttr | Transthyretin | + |
| W37018 | Zfp261 | Zinc finger protein 261 | — |
| AA041916 | E130016E03Rik | Fibrinogen silencer binding protein | UI |
| AA051406 | D5Wsu46e | DNA segment, Chr 5, Wayne State University 46, expressed | UI |
| BX522937 | 2900001G08Rik | RIKEN cDNA 2900001G08 gene | UI |
| AA273386 | 5033406L14Rik | RIKEN cDNA B230110O18 gene | UI |
| AA270527 | 1110019L22Rik | RIKEN cDNA 1110019L22 gene | +CTX |
| AA231557 | EST, unknown | + | |
Note: Data analysis resulted in the identification of 80 genes anteriorly enriched and 26 genes with posterior telencephalic enrichment. Expression patterns of 88 genes were examined with in situ hybridization, confirming regionalized patterns for 52 genes in the head or within the telencephalon. Among these genes, 15 possessed a clearly visible anterior–posterior gradient within the cortical plate and dorsal telencephalon based upon in situ hybridization. The symbols represent the following. +CTX, region-specific expression in the dorsal telencephalon was confirmed by in situ hybridization. +, region-specific expression in the head/telencephalon was confirmed by in situ hybridization. —, in situ hybridization did not show any anterior–posterior gradient in the head. UI, in situ hybridization gave uninterpretable results. X, in situ hybridization disagreed with the predicted gradient in the telencephalon.
To functionally categorize the identified genes, an analysis was performed using EASE (http://apps1.niaid.nih.gov/david/). This revealed the following overrepresented categories of genes with P values below 0.05 in the ontology category of Biological Processes: “development,” “cell differentiation,” and “extracellular.” Within these categories were genes of the Wnt pathway, several of these being factors known to play a role in cortical patterning, and other family members not known to be expressed in an A-P gradient. Strikingly, 8 of 41 (19.5%) classified genes were transcription factors, a larger proportion than usually identified in studies involving similar stages of mammalian brain development using the same microarray slides as those in this study (χ2 = 7.38, P < 0.007). For example, in a previous study of stem cell proliferation and neurogenesis using the same microarray, only 12 out of 110 (11%) genes were transcription factors (Karsten et al. 2003). This finding, using an unbiased genetic screening approach, lends additional support to the notion of a key role for transcriptional effects on cortical identity, and provides a set of genes likely to regulate the expression of other genes in an A-P gradient as well.
Database Confirmation of Known Genes
The Mouse Genome Informatics and National Center for Biotechnology Information PubMed databases were searched for previously published expression data or reports on the genes identified. Of the set of A-P differential genes, 47 had been previously studied. Published expression data in the form of in situ hybridization in the embryonic mouse central nervous system (CNS) were available for 20 of the identified genes but many contained insufficient data to determine whether there were A-P gradients of expression. There were, however, 8 genes that displayed graded telencephalic expression patterns by in situ hybridization at embryonic ages, supporting the present array analysis. Dkk3 (Diep et al. 2004), Rbpms (Gerber et al. 1999), Tcf4 (Dorflinger et al. 1999), Eef2k (Sakagami et al. 2002), Sfrp1 (Augustine et al. 2001; Kim et al. 2001), Elk3 (Ayadi et al. 2001), and FABP7 (Sansom et al. 2005) showed regionalized expression in the telencephalon in a pattern predicted by the array analysis. Gradients in the neuroepithelium were evident for both Sfrp1 (Kim et al. 2001), and FABP7 (Sansom et al. 2005). Kitl (Matsui et al. 1990) and Ttr (Grove et al. 1998) were expressed in the olfactory bulb (OB) and the choroid plexus, respectively. Highly expressed genes unique to the choroid plexus often exhibit differential expression in microarray experiments due to the difficulty of removing choroid plexus tissue completely in the dissection. A number of genes expressed in the OB, including Kit1, were identified as anteriorly expressed, consistent with the array analysis because fragments of the developing OB were likely present in the frontal samples. Further, because a low level of expression or a subtle gradient may not be detectable using in situ hybridization, we cannot rule out the possibility that the other genes also have graded expression.
Thirty-two of the identified genes had been knocked out in mice. Reports of CNS phenotypes were available for 7 genes (Table 2), but others had either no mention of a CNS phenotype, or resulted in embryonic lethality. This does not exclude the possibility that these animals may have subtle morphological or behavioral phenotypes that were not readily detected. To provide direct confirmation, we performed a large number of in situ hybridization experiments, summarized below.
Abnormal CNS phenotypes observed when genes identified in this study have been inactivated in mouse
| Gene | CNS phenotype of knockout or transgenic animals |
| Kitl | Deficient baseline synaptic transmission between the dentate gyrus and CA3 (Motro et al. 1996) |
| Trio | Altered organization of the dentate gyrus and the mitral cells (O'Brien et al. 2000) |
| Cnp1 | Hydrocephalus and neurodegeneration (Lappe-Siefke et al. 2003) |
| Sfrp1 | Decreased brain size (Bodine et al. 2004) |
| Pitx3/Elovl3 | Loss of neurons in the substantia nigra (Nunes et al. 2003; van den Munckhof et al. 2003) |
| Ctsb/Fdft1 | Cerebral and cerebellar atrophy (Felbor et al. 2002) |
| Igf1 | Decreased number of axons and oligodendrocytes; overexpression leads to increase in volume of primary somatosensory and primary motor cortices (Beck et al. 1995; Hodge et al. 2004) |
Note: The resulting phenotypes of knockouts and transgenics for these regionalized genes indicate that they are involved in telencephalic development. The published data do not indicate deficits or abnormalities in A-P patterning.
In Situ Hybridization Confirmation of Micorarray Results
The expression patterns of 88 clones were assayed by in situ hybridization at ages E12.5 to E14.5, E17.5, and P0 (Tables 1, 3). The data clearly confirmed the differential A-P expression of 15 genes resulting from the array data analysis. Because the in situ hybridizations were run as a large-scale screening, they could not be quantified at this throughput. Rather, we took a very conservative approach, such that only the genes with the graded A-P expression patterns that were most evident are reported (Figs 2, 3). A few genes were strongly expressed outside of the CNS, often in mesenchymal structures surrounding and/or rostral to the telencephalon, often corresponding to anterior-enriched genes in the microarray screen, such as Meox (data not shown). Others that had been identified by the array for enriched anterior expression showed strong signals in the OB and rostral migratory stream and rostral ventral telencephalon, as in the cases of Arl7, Fbxl17, and Kitl, (as well as other facial structures in the anterior head). This is expected, because the dissections of numerous embryos likely included some tissues surrounding the neocortex. These genes are not included in our list of confirmed genes, even though they are consistent with the array data. The in situ hybridization results of the genes identified by the microarrays are presented in Table 1.
Summary of experimental results by mircoarray and in situ hybridization
| Microarray result | Number of in situ hybridizations run | Confirmed regionalized expression in the head | Regionalized in dorsal telencephalon | |
| <F | 80 | 66 (40) | 23 | 5 |
| >F | 26 | 22 (16) | 13 | 10 |
| Total | 106 | 88 (56) | 37 | 15 |
| Microarray result | Number of in situ hybridizations run | Confirmed regionalized expression in the head | Regionalized in dorsal telencephalon | |
| <F | 80 | 66 (40) | 23 | 5 |
| >F | 26 | 22 (16) | 13 | 10 |
| Total | 106 | 88 (56) | 37 | 15 |
Note: The numbers in parentheses are numbers of in situ hybridization with interpretable results as characterized in the Methods and Results. A clear, qualitatively visible gradient was necessary for the gene to be considered confirmed, a stringent criterion. A subset of those genes that were expressed regionally in an anterior–posterior gradient, which could include extra-neural tissues or the OB, was also found to be regionalized in the dorsal telencephalon.
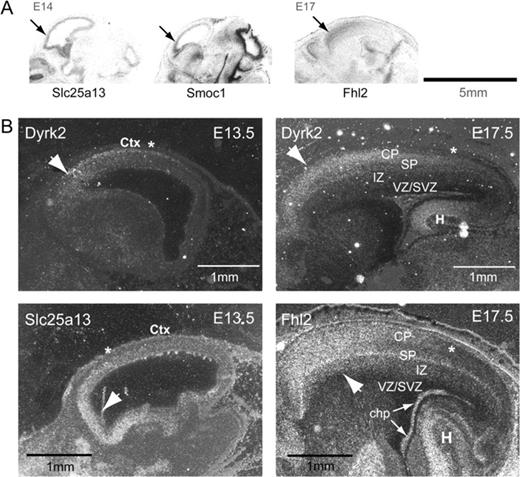
Genes with enriched anterior expression. (A) Autoradiographic images of in situ hybridization with probes representing anterior-enriched genes showing a clear gradient along the A-P axis of the developing telencephalon. (B) Images from emulsion dipped slides representing mRNA expression (silver grains) of anterior-enriched genes. Slc25a13 is expressed strongly in the anterior telencephalon at E13.5. Fhl2 is expressed anteriorly most prominently at E17.5. Note that the expression is strong in all the cortical layers but is low in the ventricular zone, suggesting that Fhl2 is expressed by postmitotic neural cells. It is also expressed at high levels in the choroid plexus, the differentiating hippocampus, and the thalamus. Dyrk2 is expressed strongly in the cortical plate and the hippocampus but expressed weakly in the VZ/SVZ. chp: choroid plexus, CP: cortical plate, Ctx: cortex, H: hippocampus, IZ: intermediate zone, SP: subplate. Arrows point to the regions of enriched expression. Asterisks indicate expression boundaries. Anterior is to the left.
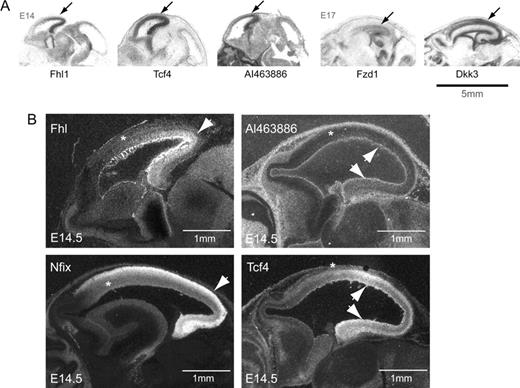
Posterior-enriched genes. (A) Autoradiographic film images of posterior-enriched genes showing a clear gradient along the A-P axis of the developing telencephalon. (B) Dark field images representing mRNA expression of posterior-enriched genes after developing slides dipped in photographic emulsion. Fhl1 and AI463886 show a strong A-P gradient at E14.5 (see Methods). Anterior is to the left. Arrows point to the regions of enriched expression. Asterisks indicate relative expression boundaries, which in most cases were gradual.
Anterior-Enriched Genes
In situ hybridization confirmed the A-P gradient of enriched expression for Fhl2, Sfrp1, Slc25a13, Smoc1, and Dyrk2. Three of these genes, Sfrp1, Slc25a13, and Smoc1 were all expressed in the ventricular and the subventricular zones (VZ/SVZ) with a rostral-to-caudal gradient, consistent with a potential intrinsic patterning role, whereas Dyrk2 and Fhl2 showed broader radial expression, including the cortical plate (Fig. 2). Slc25a13, which encodes a calcium-mitochondrial solute carrier protein with EF-hand domains (Kobayashi et al. 1999), showed intense anterior expression at E13.5, largely restricted to the neuroepithelium. Smoc1 encodes a secreted modular protein with EF-hand calcium-binding domain known to be expressed in the brain (Vannahme et al. 2002). Fhl2 encodes a LIM domain protein (Genini et al. 1997; Chan et al. 1998) that interacts with β-catenin of the Wnt pathway and act as a Wnt agonist (Chen et al. 2003; Wei et al. 2003; Labalette et al. 2004). At E17.5, Fhl2 shows strong signal in the intermediate zone and cortical plate, as well as the hippocampus and the choroid plexus (Fig. 2). Dyrk2, a dual-specificity tyrosine-(Y)-phosphorylation regulated kinase 2, is expressed in the anterior cortical plate at E12.5, E14.5, and E17.5 (Fig. 2; Becker et al. 1998; Matsuo et al. 2001; Woods et al. 2001; Campbell and Proud 2002).
Posterior-Enriched Genes
Ten posterior-enriched genes, including one EST, identified by the microarrays show distinct posterior enrichment gradients by in situ hybridization, 6 of which are shown in Figure 3. During early corticogenesis, 5 of these genes, Farp1, Fhl1, Gart, Mcam, and the previously uncharacterized gene, A1463886, were restricted to the germinal neuroepithelium of the VZ and SVZ. Fhl1, a LIM domain gene, is expressed with a ventricular zone-to-cortical plate gradient at E14.5 (Fig. 3). Farp, involved in the adhesion, proliferation, and differentiation of chondrocytes (Koyano et al. 1997, 2001), is expressed in VZ/SVZ at E14.5, and mostly in the posterior cortical plate at E17.5 (data not shown).
Two genes involved in the Wnt pathway, Dkk3, a Wnt antagonist, and Fzd1, a Wnt receptor, are expressed in a somewhat complementary pattern in the neocortical anlage, as Fzd1 is expressed strongly in posterior IZ, where Dkk3 expression is weak (Fig. 3). At E17.5 Dkk3 is expressed in the ventricular zone, the cortical plate, the marginal zone, and the hippocampus with a caudal-to-rostral gradient in the cortical plate. Fzd1 is expressed more strongly in the posterior intermediate zone at E14.5 and E17.5, as well as in the hippocampus and less prominently in the choroid plexus and VZ/SVZ.
Two transcription factors, Nfix and Tcf4 (SEF2), are strongly expressed in the developing cortex and the hippocampus (Fig. 3). Nfix is expressed in all the zones of the cerebral wall at E14.5 with a cortical plate-to-ventricular zone gradient and a caudal-to-rostral gradient. It is expressed at E17.5 in all the embryonic zones dorsal to the perirhinal sulcus but its expression in the subplate extends into the rhinencephalon. Tcf4 is weakly expressed in the marginal zone at E14.5. At E17.5, it is strongly expressed in the cortical plate and the VZ, but not the subplate, which is complementary to the expression of Nfix. In contrast to Nfix, Tcf4 expression in all the zones extends into the rhinencephalon, with the exception of the subplate.
One gene involved in biosynthesis and 2 others encoding membrane-associated proteins were also expressed in a caudal-to-rostral gradient. Gart, a glycinamide ribonucleotide formyltransferase, is a developmentally regulated protein that is implicated in Down syndrome (Brodsky et al. 1997). Mcam is a cell adhesion molecule involved in neurite extension (Taira, Kohama, et al. 2004; Taira, Tsukamoto, et al. 2004; Taira et al. 2005; Kohama et al. 2005). Gart and Mcam probes showed stronger signals in the caudoventral neuroepithelium at E14.5 (data not shown). Ifitm2 encodes an evolutionarily conserved interferon-induced transmembrane protein associated with germ cell specification in mice with known expression throughout the epiblast (Tanaka and Matsui 2002; Lange et al. 2003). It is expressed in the VZ and the outer cortical plate at E17.5, as well as in the choroid plexus and the hippocampus (data not shown).
AI463886, an EST that encodes for a previously uncharacterized protein (AAH55405, NP_081032), is expressed in the posterior marginal zone and the neuroepithelium, as well as the hippocampus and the choroid plexus of the embryonic brain (Fig. 3). It is enriched in the posterior telencephalon during periods of neurogenesis, and is expressed at high levels throughout the developing cortical plate and the ventricular zone at E17. By P0, the expression becomes weak in the brain. Structural analysis of the protein product of this gene using PROSITE (ExPASY) and PredictProtein (Rost and Sander 1993; Rost 1996; Rost et al. 1996; Gasteiger et al. 2003) predicts a transmembrane domain at its C-terminus with the rest of the sequence in the form of cytoplasmic loops. Homology searching revealed no other homologies or clear functional domains. Based on these data, we hypothesize that this gene may encode a novel membrane-bound protein.
Expression of Multiple Fhl1 Isoforms in the Developing Brain
The identification of 2 four-and-a-half LIM (FHL) domain family genes, Fhl1 and Fhl2, piqued our interest, as neither had previously been implicated in brain development. Both proteins contain FHL domains, a cysteine rich motif that coordinately binds 2 zinc atoms and mediates protein–protein interactions (Arber and Caroni 1996). Some LIM domain–containing proteins are nuclear proteins involved in cell lineage determination and pattern formation during development (Lumsden 1995; Beckerle 1997; Dawid et al. 1998; Zhou, Ruiz-Lozano, et al. 1999) and both of these FHL genes are enriched in muscle (Chan et al. 1998; Lee et al. 1998).
However, Fhl1 is subject to complex alternative splicing, which has been incompletely characterized. The murine homolog of Fhl1, KyoT1, produces a shorter splice variant, KyoT2, with a frame shift resulting in a protein domain that interacts with RBP-J (recombination signal binding protein-Jκ) and negatively regulates its transcriptional activity (Taniguchi et al. 1998). In the human, another variant, FHL1B has been identified as a brain-specific isoform of FHL1 with a putative nuclear localization signal and a RBP-J binding region (Lee et al. 1999) identical to KyoT2. This corresponds to the longer splice variant reported but not characterized, by Taniguchi et al. (1998), which will be referred to here as Fhl1Bm (for Fhl1B, mouse).
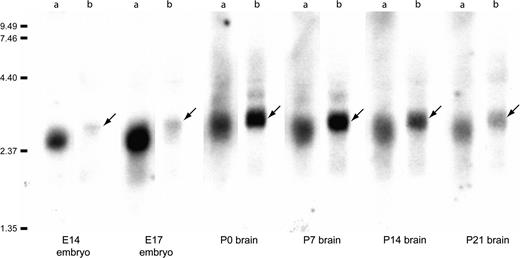
The expression of Fhl1 messenger RNA (mRNA) and its splice variants was examined using several methods. In the E12.5 mouse brain, semiquantitative RT-PCR confirmed that all isoforms of Fhl1 were consistently expressed at higher levels in the posterior telencephalon. The A, M, and P tissue samples from the microarray studies were used to assess the differential expression of Fhl1 along the A-P axis. PCR products from A, M, and P samples all expressed the 3 isoforms. Ratios were obtained by dividing the amount of PCR product in O by the amount of product in F. All 3 isoforms were significantly enriched in the posterior telencephalon (P values = 0.0005, 0.002, and 0.006 for product sizes 700, 500, and 300 bp, respectively). Northern blot hybridization analyses for E14 embryos, E17 head, and brains from P0, P7, P14, and P21 revealed the expression of Fhl1 and Fhl1Bm in embryonic and postnatal brains, with a lower expression level for Fhl1Bm during the embryonic stages (Fig. 4). The posterior-enriched expression of Fhl1 in the developing neocortex was confirmed by in situ hybridization but the gradient was absent by E17 (Fig. 5). In situ hybridization with a probe recognizing all Fhl1 isoforms showed posterior expression at E12.5, which became more ubiquitous at E17.5.
Northern blot analysis of Fhl1 and Fhl1Bm expression in total RNA. Fhl1 (lanes a) was expressed at high levels in the embryonic tissue and decreased postnatally. Note that the bands are narrower for the Fhl1Bm (lanes b) hybridization, indicating the specificity of the probe to this particular isoform. Most difference is seen at E14 and E17, showing that Fhl1Bm is not high during embryogenesis, and does not seem to be the predominant isoform of Fhl1 in embryonic or fetal brain. Arrows point to the bands for Fhl1Bm that is larger than that for the wider bands seen with Fhl1 probe.
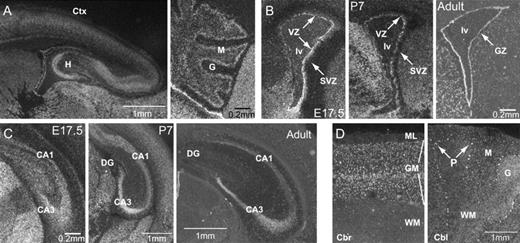
Fhl1 expression patterns in the telencephalon. (A) P0 sagittal section showed strong expression of Fhl1 in most areas of the cerebral cortex and other telencephalic structures, as well as the cerebellum. (B) Coronal sections of the germinal layer (medial to the left) showed Fhl1 expression through adulthood. (C) Fhl1 was expressed in the hippocampus throughout development, and in the adult the expression became more limited to the CA1 and CA3 regions, with much less robust expression in the dentate gyrus. (D) In situ hybridization of Fhl1 on adult human brain shows that Fhl1 signal is strong in pyramidal neurons in the gray matter in all cortical layers. The expression of Fhl1 appears to be expressed by different cell types in the cerebellum but most prominently in the Purkinje cells. CA1 and CA3: cornu ammonis 1 and 3, Cbl: cerebellum, Cbr: cerebral cortex; Ctx: cortex, DG: dentate gyrus, G: granular layer, GM: gray matter; GZ: germinal zone, lv: lateral ventricle, M: molecular layer of the cerebellum, ML: molecular layer, P: Purkinje cell layer, WM: white matter.
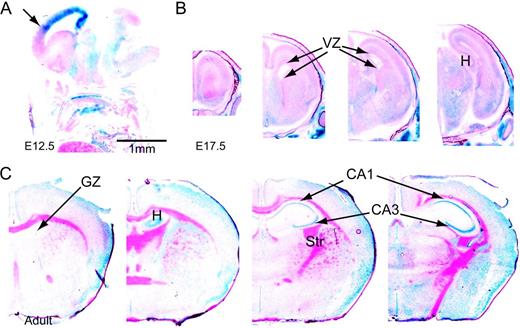
We also analyzed X-gal staining in heterozygote Fhl1 knockouts, in which the β-galactosidase gene was inserted to inactivate Fhl1 (see below). This revealed a comparable expression pattern to that of the mRNA pattern for Fhl1 in the wild-type mice, except that dentate gyrus X-gal staining was not observed. Close inspection of the stained cells revealed that those cells with LacZ staining (Fig. 6) were mostly pyramidal neurons, including hippocampal neurons of CA1 and CA3, motor neurons, and neurons of the thalamic nuclei. The staining was conspicuously weak in the CA2 region of the hippocampus and also absent from the marginal zone, where Cajal Retzius cells reside.
LacZ staining on Fhl1 +/− adult brain. (A) Sagittal section of an E14 Fhl1 +/− mouse facing left. (B and C) Coronal sections (rostral to caudal in left to right) of brains from an E17 Fhl1 +/− mouse and an adult Fhl1 −/y mouse, respectively. The staining pattern shows highest levels in the ventral-most regions of the VZ at E17.5 and pyramidal neurons of the adult hippocampus, identical to that of Fhl1 expression in the wild-type brains. CA1 and CA3: cornu ammonis 1 and 3, GZ: germinal zone, H: hippocampus, Str: striatum.
Finally, we examined the expression of FHL1 mRNA in the human cortex and cerebellum on adult brain. Similar to the mouse, Fhl1 expression is prominent in pyramidal neurons of the gray matter of the cerebral cortex and throughout the cerebellum, especially in Purkinje cells (Fig. 5).
Fhl1 Knockout Mice
We decided to assess FHL1's function as a potential regulator of A-P patterning in mice carrying a null allele of Fhl11 in which Fhl1 has been inactivated by insertion of β-gal into the first exon (Chu, Ruiz-Lozano, et al. 2000). We recognized that although its expression within postmitotic neurons suggested a role in neuronal maturation rather than A-P patterning, this avenue would be worth more detailed study, as Fhl1 previously had no known function in brain development. Animals deficient in Fhl1 do not show any gross anatomical or behavioral abnormalities. The brains of homozygous Fhl1 null mice have normal morphology and are comparable in size and appearance with those of their wild-type littermates (Table 4).
Measurements and weight comparison of adult wild-type and Fhl1 knockout littermates
| Body weight (g) | Brain weight (g) | a (cm) | b (cm) | c (cm) | Brain/body ratio (%) | A-P cortical length/width (%) | |
| WT | 44.9(7.7) | 0.49(0.02) | 0.93(0.06) | 1.04(0.04) | 0.72(0.07) | 1.1(0.3) | 89 |
| Fhl1 KO | 37.9(5.7) | 0.43(0.03) | 0.93(0.05) | 0.97(0.01) | 0.68(0.08) | 1.1(0.2) | 96 |
Note: Average body weights and weights of the entire brain were recorded from adult male mice. The measurements of the cortex were made as depicted in the diagram. Values in parentheses are standard deviations.
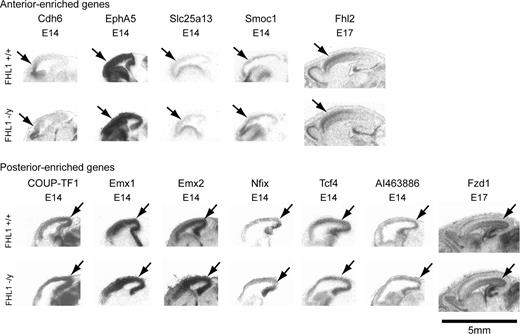
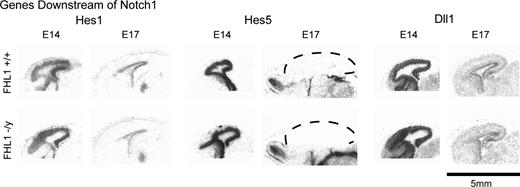
To examine the possibility of more subtle changes in telenephalic development, anterior–posterior regionalization was tested by assessing the expression of known molecular gradients, focusing on those genes defined in this study (Fhl2, Slc25a13, Smoc1, Dkk3, Farp1, Fzd1, Ifitm2, Nfix, Tcf4, and AI463886), or other genes known to mark regional boundaries, that is, Cdh6, CoupTF1, EphA5, Emx1, Emx2, and Otx2 (Simeone et al. 1993; Gulisano et al. 1996; Mallamaci et al. 1996; Suzuki et al. 1997; Mackarehtschian et al. 1999; Rubenstein et al. 1999; Liu et al. 2000) in the knockout animals. In situ hybridization was performed on sagittal sections of E14.5 and E17.5 embryos of Fhl1 knockouts and their wild-type littermates (Fig. 7). No changes in the expression patterns of these genes were detected in the Fhl1 heterozygote or homozygote null mice, suggesting that this gene is not likely an upstream regulator of these factors. Importantly, we detected no alterations in Hes-1 and Hes-5 in Fhl1 knockout mice, suggesting that Notch signaling is compensated and not disrupted with Fhl1 loss of function (Fig. 8). Furthermore, because Fhl2 expression is normal in the Fhl1 null mice, it is unlikely that the basis for normal telencephalic patterning in the Fhl1 null mouse is due to compensation by Fhl2.
Expression of A-P gradient genes in Fhl1 knockout mice. The images are low-power autoradiographs of sagittal sections. The expression patterns of both known and newly identified genes regionalized along the A-P axis show comparable gradients in the Fhl1 knockout animals compared with their wild-type littermates. Arrows point to the regions of enriched expression in the cortex.
Expression of genes downstream of Notch1 in Fhl1 knockout mice. Low-power autoradiographs of sagittal sections show that the expression patterns and levels of Hes1, Hes5, and Dll1 appear unaltered in the E14 and E17 mice that are deficient in Fhl1. Dashed lines outline the cerebral cortex.
Discussion
We used microarray analysis followed by in situ hybridization on a large scale to identify a number of genes previously not known to be expressed in anterior–posterior gradients in the developing cortex. These data add to a growing number of known genes with such patterns, and provide an additional foundation for future work on the molecular basis of mammalian forebrain patterning. The enrichment in transcription factors among those with A-P gradients at this developmental stage is particularly interesting in this regard, as it provides additional molecular support for the protomap concept, in which factors located in the dorsal pallium are hypothesized to direct initial regionalization of the cerebral cortex, independent of afferent input (Rakic 1988). The subset of genes with strong A-P gradients that are highly expressed or restricted to the VZ and SVZ, such as Sfrp1, Smoc1, Slc25a13, Gart, and the previously uncharacterized A1463886 are most likely to play direct roles in the process of intrinsic patterning within the germinal neuroepithelia.
It is also noteworthy to mention that of the 15 genes that were identified and confirmed in this study, 4 are known to be involved in the Wnt pathway, Fhl2, Fzd1, Dkk3, and Sfrp1 and 4 encode transcription factors/regulators, Fhl1, Fhl2, Tcf4, and Nfix. The use of genetic screening methods here provides a group of genes that were identified using unbiased sampling methods, without a predetermined focus on putative functions or homologies. These data will be useful for assessing putative roles in A-P patterning, as we did in the Fhl1 knockout mouse and have begun in a preliminary manner in another patterning mutant, the foxg1 heterozygous mouse (Levitt, unpublished data).
Wnt Pathway and Cortical Regionalization
Wnt signaling is well known to be critical in differentiation and patterning of the developing embryo (Cadigan and Nusse 1997). Our study identified novel expression patterns of 2 genes involved in the Wnt pathway, Dkk3 (Glinka et al. 1998; Krupnik et al. 1999; Monaghan et al. 1999) and Fzd1 (Vinson et al. 1989; Bhanot et al. 1996), which were expressed in a caudal-to-rostral gradient, as well as Sfrp1 (Finch et al. 1997; Leyns et al. 1997; Rattner et al. 1997) and Fhl2 (Peifer and Polakis 2000; Wei et al. 2003; Labalette et al. 2004) with a rostral-to-caudal gradient. Because Sfrp1 and Dkk3 are Wnt antagonists (Finch et al. 1997; Leyns et al. 1997; Rattner et al. 1997; Caricasole et al. 2003; Suwa et al. 2003), and Fzd1 and Fhl2 are Wnt agonists (Vinson et al. 1989; Bhanot et al. 1996; Peifer and Polakis 2000; Wei et al. 2003; Labalette et al. 2004), the expression data does not support a simple model for Wnt signaling (e.g., Soley proneurogenic). The biological significance of these Wnt antagonists (Zorn 2001; Jones and Jomary 2002; Diep et al. 2004; Roman-Roman et al. 2004), expressed in specific zones of the developing cerebral wall with strong gradients along the rostrocaudal axis, requires further investigation.
Known and Novel Transcription Factors Including Fhl1 and Fhl2
A growing number of transcription factors with identified roles in CNS development have been identified (Miyashita-Lin et al. 1999; Zhou, Qiu, et al. 1999; Zhou et al. 2001; Bishop et al. 2000, 2002; Mallamaci et al. 2000; Muzio and Mallamaci 2003). The present study revealed several of these that have previously characterized roles, including Tcf4 (Pscherer et al. 1996; Dorflinger et al. 1999) and Nfix (Chaudhry et al. 1997). Along with other basic-helix-loop-helix proteins, (Johnson et al. 1992; Kageyama et al. 1997; Nieto et al. 2001), Tcf4 may also regulate lineage fates in regionalizing the developing brain (Liu et al. 1998).
The novel finding of graded expression patterns of Fhl1 and Fhl2 piqued our interest for further study because they were not previously identified in embryonic brain. We examined whether Fhl2 expression might be impacted by Fhl1 loss because Fhl and Fhl2 appear to compensate for each other in the heart (Chu, Bardwell, et al. 2000). No change in Fhl2 expression was observed in Fhl1 knockouts nor was any change detected in the expression of other genes expressed in known developmental gradients in the dorsal telencephalon. It is notable that Fhl1 is conserved from Caenorhabditis elegans to humans (Hobert et al. 1999; Lee et al. 1999; Ng et al. 2001). Aside from the fact that its sequence contains an RBP-J binding site and a nuclear localization signal (Lee et al. 1999) not much is known about its function in the brain. Here we show that Fhl1 is concentrated mainly in postmitotic pyramidal neurons, suggesting its possible role in the maintenance of a mature neuronal phenotype, rather than influencing patterning gradients per se. Until this study, Fhl2 was also not known to be involved in CNS development. Based on its expression pattern in embryonic and perinatal telencephalon and its association with the Wnt pathway, as well as its known transcriptional regulatory activities outside the CNS (Du et al. 2002; McLoughlin et al. 2002), Fhl2 will be an attractive candidate for further investigation.
Methodological Considerations and Limitations
Although several previously reported and novel genes showing expression gradients in the developing dorsal telencephalon were identified, there are methodological limitations. A number of genes that were identified in the array data analysis were expressed in non-CNS tissue or in neighboring regions of the CNS that were likely the result of imprecise tissue dissection, emphasizing the value of anatomical validation, as performed here. The recent emergence of new techniques for preparing distinct neuronal types from developing brain permits future studies to be able to examine different cell types separately (Arlotta et al. 2005; Lobo et al. 2006). As technologies become available for single cell studies and isolating specific cell types from tissue samples, more definitive array studies can be performed (Dougherty and Geschwind 2005). Still the combination of genomic screening followed by anatomical confirmation (Geschwind et al. 2001; Zirlinger et al. 2001; Karsten et al. 2003) as performed here is valuable, as evidenced by the genes identified in this study.
Probe templates were kind gifts provided by Dr John Rubenstein for Otx2, Emx1, and Emx2; Dr Elizabeth Grove for Cdh6; and Dr Harley Kornblum for GFAP. Authors would like to thank Farah Sheik for providing us with Fhl1 knockout mice, Zugen Chen for providing the clones, and Matt Schibler for assistance with confocal microscopy. We also thank Sam Levitt for his technical assistance with the dissections. This work was supported by grants NIH 5T32 MH19384-08 (L.C.K.), MH60233 (D.H.G.), and NICHD P30 HD15052 to the Vanderbilt Kennedy center (PL). Conflict of Interest: None declared.