


Skip to results
Modify your search
NARROW
1-20 of 50068

Image
MVPA results for distinguishing Chinese character and Japanese Kanji for bo...
in
Cerebral Cortex
>
Phonological properties of logographic words modulate brain activation in bilinguals: a comparative study of Chinese characters and Japanese Kanji
Published: 23 April 2024
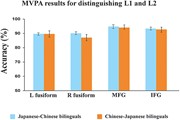
Fig. 5
MVPA results for distinguishing Chinese character and Japanese Kanji for both groups. Classification accuracies for the ROIs were all significantly above chance level of 50% with P < 0.001.
Image
Grand averaged response in mice: Slower dynamics and decreased response in ... Get access
in
Cerebral Cortex
>
Encoding luminance surfaces in the visual cortex of mice and monkeys: difference in responses to edge and center
Published: 23 April 2024
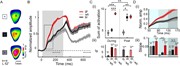
Fig. 2
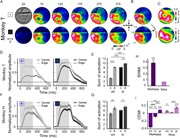
Grand averaged response in mice: Slower dynamics and decreased response in the center of the surface stimuli. A) Grand-average VSD maps in V1 over all recording sessions (see Materials and Methods and Fig. 1B ; maps were time averaged at 150 to 250 ms after stimulus onset). White (top; n = 10),
Image
Suppression in the center of the surface is size dependent and more promine... Get access
in
Cerebral Cortex
>
Encoding luminance surfaces in the visual cortex of mice and monkeys: difference in responses to edge and center
Published: 23 April 2024
Fig. 3
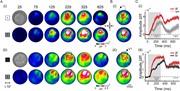
Suppression in the center of the surface is size dependent and more prominent for the white surfaces. Data are from mice. A) Grand average VSD maps over sessions of white (top), black (middle), and grating stimuli (bottom). Stimuli sizes: small, S—12°; medium, M—36°; large, L—52°. VSD maps were aver
Image
Group differences in activation between low- and high-indole stimuli in a) ... Get access
Published: 23 April 2024
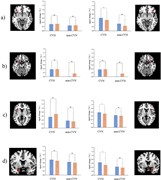
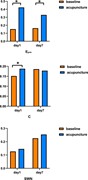
Fig. 3
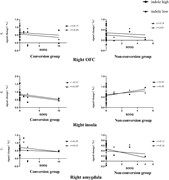
Group differences in activation between low- and high-indole stimuli in a) lateral and b) medial OFC, c) insula, and d) amygdala. The left bar (blue) represents the low-indole condition, while the right bar (orange) represents the high-indole condition (the left hemisphere is on the left). Notes.
Image
The scatterplots show significant correlations between consummatory pleasur... Get access
Published: 23 April 2024
Fig. 6
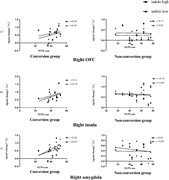
The scatterplots show significant correlations between consummatory pleasure and hedonic traits measured using the TEPS and signal change in the a) right OFC, b) insula, and c) amygdala. The Conversion group is shown on the left, and the Non-conversion group is shown on the right. Notes. OFC: orbi
Image
The scatterplots show significant correlations between SODQ and signal chan... Get access
Published: 23 April 2024
Fig. 8
The scatterplots show significant correlations between SODQ and signal change in the a) right OFC, b) insula, and c) amygdala. The Conversion group is shown on the left, and the Non-conversion group is shown on the right. Notes. OFC: orbitofrontal cortex; SODQ: self-reported olfactory dysfunction
Journal Article
Multi-scale analysis of acupuncture mechanisms for motor and sensory cortex activity based on SEEG data Get access
Cerebral Cortex, Volume 34, Issue 4, April 2024, bhae127, https://doi.org/10.1093/cercor/bhae127
Published: 23 April 2024
Journal Article
Encoding luminance surfaces in the visual cortex of mice and monkeys: difference in responses to edge and center Get access
Cerebral Cortex, Volume 34, Issue 4, April 2024, bhae165, https://doi.org/10.1093/cercor/bhae165
Published: 23 April 2024
Journal Article
The neural representations of valence transformation in indole processing Get access
Cerebral Cortex, Volume 34, Issue 4, April 2024, bhae167, https://doi.org/10.1093/cercor/bhae167
Published: 23 April 2024
Image
The figure illustrates the research framework adopted in this study. The ov... Get access
in
Cerebral Cortex
>
Multi-scale analysis of acupuncture mechanisms for motor and sensory cortex activity based on SEEG data
Published: 23 April 2024
Fig. 1
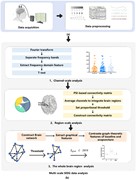
The figure illustrates the research framework adopted in this study. The overall framework consists of three main steps: data acquisition, data preprocessing, and multi-scale analysis. (a) Data acquisition and data preprocessing. The data preprocessing step involves several procedures, including lab
Image
Acupoints and acupuncture experimental paradigm. The acupuncture point targ... Get access
in
Cerebral Cortex
>
Multi-scale analysis of acupuncture mechanisms for motor and sensory cortex activity based on SEEG data
Published: 23 April 2024
Fig. 3
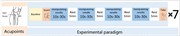
Acupoints and acupuncture experimental paradigm. The acupuncture point targeted was GB34. The experimental protocol encompassed one measurement session, during which multiple phases were conducted. Initially, a baseline state collection was performed before the acupuncture intervention. Subsequently
Image
(a) PSI-based effective brain region network connectivity in the band. ... Get access
in
Cerebral Cortex
>
Multi-scale analysis of acupuncture mechanisms for motor and sensory cortex activity based on SEEG data
Published: 23 April 2024
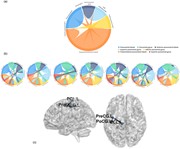
Fig. 5
(a) PSI-based effective brain region network connectivity in the band. Chords represent connectivity between brain regions. Each color represents the specified brain region. Common connectivity between brain regions found in the acupuncture across 7 days. (b) Seven days of brain regional connect
Image
PSI-based effective brain network connectivity. The figure presents the eff... Get access
in
Cerebral Cortex
>
Multi-scale analysis of acupuncture mechanisms for motor and sensory cortex activity based on SEEG data
Published: 23 April 2024
Fig. 6
PSI-based effective brain network connectivity. The figure presents the effective brain network connectivity using the PSI measure, with a threshold of 30 applied to remove insignificant connections. Graph theory features, including , , are examined to explore the cumulative and immedia
Image
Examples of the presentation format in the rhyming judgment tasks with Chin...
in
Cerebral Cortex
>
Phonological properties of logographic words modulate brain activation in bilinguals: a comparative study of Chinese characters and Japanese Kanji
Published: 23 April 2024
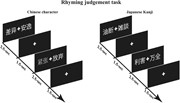
Fig. 1
Examples of the presentation format in the rhyming judgment tasks with Chinese characters and Japanese Kanji.
Image
Brain activation is associated with the rhyming judgment task of Chinese ch...
in
Cerebral Cortex
>
Phonological properties of logographic words modulate brain activation in bilinguals: a comparative study of Chinese characters and Japanese Kanji
Published: 23 April 2024
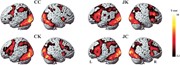
Fig. 3
Brain activation is associated with the rhyming judgment task of Chinese characters and Japanese Kanji in Chinese participants and Japanese participants. The results of one-sample t -tests for brain activation associated with the rhyming judgment task separately for each group and each language. CC
Image
(A) Brain regions showing significant effects of group in the ANOVA analysi...
in
Cerebral Cortex
>
Phonological properties of logographic words modulate brain activation in bilinguals: a comparative study of Chinese characters and Japanese Kanji
Published: 23 April 2024
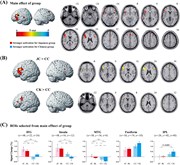
Fig. 4
(A) Brain regions showing significant effects of group in the ANOVA analysis. (B) Brain activation associated with direct within-group and between-group comparisons. (C) Results of ROI analysis. IFG, inferior frontal gyrus; MTG, middle temporal gyrus; IPL, inferior parietal lobule. * P < 0.05;
Image
VSD response at the center of the surface in mice—Example sessions. A) (i) ... Get access
in
Cerebral Cortex
>
Encoding luminance surfaces in the visual cortex of mice and monkeys: difference in responses to edge and center
Published: 23 April 2024
Fig. 1
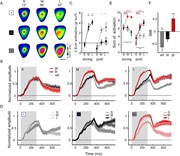
VSD response at the center of the surface in mice—Example sessions. A) (i) Population response maps evoked by a large white square surface (top; L, 52°) or a square moving grating of the same size and contrast (bottom), an example session from one animal. The fluorescence level (Δf/f) is depicted by
Image
Edge vs. center response in mice. A) Latency maps of the VSD response for t... Get access
in
Cerebral Cortex
>
Encoding luminance surfaces in the visual cortex of mice and monkeys: difference in responses to edge and center
Published: 23 April 2024
Fig. 4
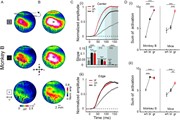
Edge vs. center response in mice. A) Latency maps of the VSD response for the grating, in an example session. The values of response latency are color-coded. Top: latency map denoting all pixels crossing the calculated median latency, enclosed by the black contour. Middle: a fitted ellipse ROI of th
Image
Evoked response in monkey: higher activation in the center for the grating ... Get access
in
Cerebral Cortex
>
Encoding luminance surfaces in the visual cortex of mice and monkeys: difference in responses to edge and center
Published: 23 April 2024
Fig. 5
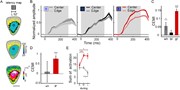
Evoked response in monkey: higher activation in the center for the grating stimulus and similar activation at the edges for the grating and black surface. Data from monkey B. A–C) V1 data for monkey D) Comparison of V1 in monkey B and mice. A) Average VSD maps (100 to 120 ms after stimulus onset) fo
Image
Surface characterizations in monkeys: edge-dominated response and transient... Get access
in
Cerebral Cortex
>
Encoding luminance surfaces in the visual cortex of mice and monkeys: difference in responses to edge and center
Published: 23 April 2024
Fig. 6
Surface characterizations in monkeys: edge-dominated response and transient holes in the center. A–E) Monkey T V1 data. F, G) Monkey H V1 data. H, I) Comparison of V1 in monkeys and mice. A) Population response maps evoked by white square (top) or black square (bottom) surfaces (2°) from an example