


Abstract
Chlorhexidine, a bitter bis-biguanide antiseptic, is the only known blocker of the human salty taste. In order to characterize the effects of chlorhexidine on stimulus identification, taste confusion matrix (TCM) performance was measured for subjects treated with 1.34 mM chlorhexidine gluconate (n = 9) and water controls (n = 9). Ten stimuli [water, 0.1 M NaCl, 0.1 M KCl, 0.1 mM quinine-HCl (QHCl), 0.1 M monosodium glutamate (MSG), 3 mM citric acid, 0.3 M sucrose and mixtures of NaCl, QHCl and citric acid with sucrose] were presented in 10 replicates for identification from a list of 10 stimulus names. T10, a measure of performance consistency from information theory, was lower for chlorhexidine-treated subjects (2.02 ± 0.11 bits) than controls (2.73 ± 0.11 bits) (P < 0.0001). T2, an indirect measure of pairwise stimulus discrimination, approached chance levels (0.40 bit) in chlorhexidine-treated subjects for all possible pairs of NaCl, KCl, QHCl and water, as well as pairs composed of sucrose and the NaCl—sucrose and quinine—sucrose mixtures. In controls T2 values approached perfect scores (1.00 bit) for all stimulus pairs except NaCl—KCl and NaCl—MSG. The results demonstrate a decreased ability to identify taste stimuli that is consistent with alterations in the ability of stimuli to elicit salty and bitter taste perceptions. As a selective, effective, persistent and reversible blocker of taste perceptions, chlorhexidine should prove useful in defining taste mechanisms in humans.
Introduction
The present study examines the taste quality-altering effects of chlorhexidine in humans by analyzing confusions among taste stimuli in an identification task (Gent et al., 1999; Hettinger et al., 1999). Treatment with chlorhexidine, a bis-biguanide antiseptic, produces a profound and lengthy alteration of the salty taste of all salty compounds. It reduces the bitter taste of a subset of bitter compounds, but has little effect on sweet and sour tastes (Lang et al., 1988; Helms et al., 1995; Marinone and Savoldi, 2000; Breslin and Tharp, 2001; Frank et al., 2001). Chlorhexidine is the only known blocker of salty taste in humans, which discloses a great deal about mechanisms because related substances (such as amiloride at concentrations that block epithelial Na+ channels) have little effect on salty taste (Ossebaard and Smith, 1995, 1996). The uniqueness of chlorhexidine action may be due to its bis-biguanide structure and the mechanism may involve reduced paracellular ion movement (Frank et al., 2001). Furthermore, the generality of salty inhibition by chlorhexidine allows us to argue the case for a unitary percept for the salty quality.
The taste confusion matrix (TCM) method, in which a set of stimuli is presented repeatedly for identification from a list of stimulus names, permits objective measurement of the ability to identify tastants. Performance measures calculated from the matrix of correct and incorrect response frequencies include two measures taken from information theory (Attneave, 1959) that quantify response consistency (T10 for a 10 stimulus test) and pairwise stimulus discriminability (T2) as bits of information transferred. In the context of TCM methodology, we use the term `stimulus discrimination' to mean an ability to identify a unique label for a stimulus and thus to distinguish that stimulus from the other stimuli. The term `confusion' is used to mean a failure of discrimination. TCM methodology is an efficient means of data collection: 45 pairwise comparisons (tests of discriminability) can be made using a group of 10 stimuli.
The utility of the TCM and associated information theory measures lies in their sensitivity to experimental alterations of the taste system (Gent et al., 1999) and what this can reveal about the nature of the perceptual experience. The T2 measure in particular can reveal post-treatment quality perceptions by quantifying stimulus similarity. The maximum value of T2 is 1.0 bit, which represents perfect stimulus discriminability, and although 0 bits is the theoretical minimum, 0.40 bits is the value that results from a computer simulation of random performance (Hettinger et al., 1999). In an example from a recent study we found that the mean T2 for the stimulus pair NaCl versus NaCl—sucrose mixture is 0.82 ± 0.05 bits following a water rinse but 0.35 ± 0.06 bits following a gymnemic acid rinse (Gent et al., 1999). The gymnemic acid group not only found it harder to distinguish between these two stimuli compared with a water rinse group but the T2 for this stimulus pair did not differ significantly from random performance. This is exactly what we would expect if gymnemic acid, which obtunds the sweet quality of all classes of sweeteners (Frank et al., 1992), had greatly reduced or eliminated the sweetness of the NaCl—sucrose mixture.
We selected for TCM study stimuli for which effects of chlorhexidine on taste intensity ratings are known (Frank et al., 2001) in order to characterize taste function following treatment with this unique taste-altering compound. We hypothesized that compounds having reduced perceptual intensities following chlorhexidine treatment would be less readily identified. We thus predicted that chlorhexidine treatment would result in reductions in overall percent correct identification, overall degree of performance consistency (T10) and degree of stimulus discriminability (T2) for pairwise comparisons of affected (A) stimuli and A stimuli versus solvents. Results suggest that identification of stimuli that normally involve generation of salty and bitter tastes is severely disrupted by chlorhexidine treatment.
Materials and methods
Subjects
Eighteen subjects recruited from the students and staff of the University of Connecticut Health Center participated. Nine (five women and four men, aged 22-50 years; mean ± SD = 36 ± 12 years) served as a control (water rinse) group and nine (seven women and two men, aged 21-40 years; mean ± SD = 31 ± 7 years) served as the chlorhexidine rinse group. The Institutional Review Board of the University of Connecticut Health Center approved this study. All subjects gave informed consent for participation.
Stimuli and treatment rinse
The stimuli are listed, along with their names (response labels), in Table 1. The stimulus solutions were chosen to include three stimulus compounds that have reduced intensities following chlorhexidine rinses (NaCl, KCl and quinine-HCl), as well as NaCl—sucrose and quinine—sucrose mixtures (Table 1, Group A); and three stimulus compounds that do not [monosodium glutamate (MSG), citric acid and sucrose], as well as a citric acid—sucrose mixture and water (Table 1, Group B). Water and sucrose mixtures were included in order to provide an appropriate response choice for those trials where the subject found a stimulus to be `tasteless' (Helms et al., 1995; Frank et al., 2001). The single component stimuli were chosen to be equi-intense to 0.1 M NaCl (Frank et al., 2001) and although the sucrose—salt mixtures were expected to be more intense (Frank et al., 2001), the small differences in suprathreshold intensity represented by these stimuli do not affect identification performance (Gent et al., 1999).
Stimuli and response labels
| Groupa | Stimulus | Response label |
|---|---|---|
| aPrevious studies showed that perceived taste intensities of stimuli in Group A are reduced by chlorhexidine treatment while those in Group B are not (Helms et al., 1995; Breslin and Tharp, 2001; Frank et al., 2001). | ||
| A | 0.1 M NaCl | salt |
| 0.1 M KCl | salt substitute | |
| 0.1 mM quinine-HCl | quinine | |
| 0.1 M NaCl + 0.3 M sucrose | salt—sugar | |
| 0.1 mM quinine-HCl + 0.3 M sucrose | quinine—sugar | |
| B | 0.1 M MSG | MSG |
| 3.0 mM ctric acid | acid | |
| 0.3 M sucrose | sugar | |
| 3.0 mM citric acid + 0.3 M sucrose | acid—sugar | |
| water (deionized) | water | |
Each treatment consisted of two 1 min rinses with either 5 ml of water (control treatment) or the mouth rinse Peridex (which contains 1.34 mM chlorhexidine), followed by a water rinse. Tests with pure chlorhexidine show that all other ingredients of Peridex (5 mM sodium saccharin and other agents dissolved in 11.6% ethanol) do not affect taste measurements (Frank et al., 2001). Previous studies suggest that the effects of chlorhexidine on perceived intensity last for 30-60 min (Helms et al., 1995; Breslin and Tharp, 2001; Frank et al., 2001) but, with repeated testing, dissipate by 13-20% over the course of 30 min (Frank et al., 2001). Because the experimental session in the current study lasted for ∼1 h, treatment rinses were presented twice, once at the beginning before test replicate 1 and again halfway through the session before replicate 6.
Psychophysical method
Subjects received two replicates (20 trials) of training in which they were told the name of each stimulus prior to sampling. Our previous experience shows that after two training trials per stimulus identification performance improves, then plateaus within one experimental session (Hettinger et al., 1999). Previous experience also suggests, however, that performance may improve dramatically with multiple experimental sessions (Gent et al., 1999). In order to eliminate the possibility of this added variability, we chose a between subjects design.
Within each replicate all 10 stimuli were presented in random order. Following the training, 100 test trials were presented without feedback in 10 replicates of 10 stimuli as in Hettinger et al. (Hettinger et al., 1999). Using the `sip and spit' method, with several water rinses between trials, subjects were asked to taste 5 ml of solution, then, immediately after expectorating and before rinsing, name the solution using only the list of 10 names (response labels) provided (Table 1). Subjects were informed prior to the training trials that every test solution presented was named on the list, to use only labels listed when responding and, if no label on the list seemed to fit the solution just sampled, to choose the best fit. Subjects were also informed that each of the solutions would be presented several times but were not told that all 10 solutions would be presented in a block or that there would be 10 replicates of the block.
Data analysis
A TCM containing the response frequencies was generated for each subject. From each subject's TCM we derived the percent correct responses to each stimulus as well as two measures from information theory, i.e. T10, which is an overall measure of consistency of response in bits of information transferred, and T2, an indirect measure of pairwise stimulus discriminability, also in bits. Each subject's TCM contributed 10 percent-correct values (one for each stimulus presented) and one T10 value to the overall analysis. Each subject's TCM also contributed 45 T2 values, one for each of the 45 possible pairwise comparisons of the 10 stimuli. Examples of TCMs for individual subjects are presented elsewhere (Gent et al., 1999; Hettinger et al., 1999).
For T10, Px = 10/100 and Hx = 3.32, Py = response occurrence/100 and Pxy = stimulus—response occurrence/100. For T2, Px = 10/20 and Hx = 1.00, Px = response occurrence/20 and Pxy = stimulus—response occurrence/20. T10 = 3.32 bits for perfectly consistent performance; T10 = 0.70 ± 0.0025 bits (mean ± SE) for random performance (simulation, n = 1000). T2 = 1.00 bit for perfect stimulus discrimination; T2 = 0.40 ± 0.02 bits (mean ± SE) for random performance. In the TCM context, perfect discrimination means no overlap of labels used for the stimulus pair. The simulations of random performance are specific for a 10 × 10 matrix repeated 10 times (Hettinger et al., 1999).
For some analyses the 10 test stimuli were divided into two groups based on whether they had reduced intensities following chlorhexidine. The `affected' group (A) included the three stimuli whose perceived taste intensity is reduced following chlorhexidine rinse (NaCl, KCl and quinine-HCl) and the two sucrose mixtures (NaCl—sucrose and quinine-HCl—sucrose) that each had one affected component (Helms et al., 1995; Breslin and Tharp, 2001; Frank et al., 2001). The `unaffected' group (B) included stimuli whose intensity is not reduced by chlorhexidine (MSG, citric acid, sucrose, water and an acid—sucrose mixture) (Helms et al., 1995; Breslin and Tharp, 2001; Frank et al., 2001). The effect of chlorhexidine on percent correct responses was initially examined with a three-way repeated measures ANOVA with treatment (water or chlorhexidine) as the between subject factor and stimulus type (A or B) and stimulus (the five stimuli within each type) as within subject factors. Effects of chlorhexidine treatment were further examined with separate two-way ANOVAs for each stimulus type. Factors in each of these analyses included treatment (between subjects) and stimulus (within subjects).
The effect of chlorhexidine on overall consistency of performance as measured by T10 was examined with a one-tailed independent t-test. The 45 T2 values were divided into three groups and the impact of chlorhexidine on the ability to discriminate between any two stimuli as measured by T2 was examined with three separate two-way repeated measures ANOVAs. This approach was based on our hypothesis that T2 for stimulus pairs containing no, one or two `affected' (A) stimuli would be modified differently. As with gymnemic acid treatment (Gent et al., 1999), we expected T2 to be altered for particular stimulus pairs in which at least one member was `affected', i.e. AA or AB pairs, and unaltered for pairs where neither member was `affected', i.e. BB pairs. There were 10 stimulus pairs representing discrimination between the five A stimuli and 25 pairs representing discrimination between one A stimulus and one B stimulus. The remaining 10 stimulus pairs represented discrimination between the five B stimuli. In all analyses factors included treatment (water or chlorhexidine) between subjects and stimulus pair within subjects. Post hoc t-tests (α = 0.05, with Bonferroni correction for multiple comparisons) were used to examine differences in T2 between groups for particular stimuli and differences between experimental group performance compared with random performance (0.40 bits) or perfect performance (1.0 bits).
Results
Percent correct response
The average matrix of identification responses (the TCM) for all subjects in each treatment group in shown in Table 2. In general, the mean (± SE) percent correct identification for all 10 stimuli was 54.2 ± 5.3% for the chlorhexidine rinse group, which was significantly less than the 81.9 ± 4.0% for the water control group [F(1,16) = 17.14, P < 0.001]. As hypothesized, there was a significant A versus B stimulus type × treatment interaction [F(1,16) = 9.75, P < 0.007].
Matrix of responses for subjects in the water (n = 9) and chlorhexidine (n = 9) treatment groups
| Stimulus | Rinse group | Response label | |||||||||
|---|---|---|---|---|---|---|---|---|---|---|---|
| Salt-sub | Salt | Quinine—sugar | Salt—sugar | Qui | Acid | MSG | Sugar | Acid—sugar | Water | ||
| Identification responses are expressed as a percentage of the total number of stimulus presentations. Correct responses are in bold. | |||||||||||
| Group A: `affected' | |||||||||||
| KCl | water | 60.0 | 16.7 | 1.1 | 1.1 | 6.7 | 0.0 | 14.4 | 0.0 | 0.0 | 0.0 |
| chlorhex | 34.4 | 13.3 | 4.4 | 0.0 | 16.7 | 8.9 | 7.8 | 0.0 | 1.1 | 13.3 | |
| NaCl | water | 21.1 | 68.9 | 1.1 | 2.2 | 0.0 | 1.1 | 5.6 | 0.0 | 0.0 | 0.0 |
| chlorhex | 24.4 | 28.9 | 3.3 | 4.4 | 2.2 | 10.0 | 10.0 | 0.0 | 2.2 | 14.4 | |
| Quinine—sucrose | water | 2.2 | 0.0 | 75.6 | 7.8 | 5.6 | 6.7 | 0.0 | 0.0 | 2.2 | 0.0 |
| chlorhex | 0.0 | 0.0 | 35.6 | 16.7 | 2.2 | 1.1 | 0.0 | 35.6 | 8.9 | 0.0 | |
| NaCl—sucrose | water | 1.1 | 1.1 | 1.1 | 76.7 | 0.0 | 0.0 | 0.0 | 16.7 | 3.3 | 0.0 |
| chlorhex | 0.0 | 0.0 | 8.9 | 37.8 | 0.0 | 0.0 | 0.0 | 40.0 | 13.3 | 0.0 | |
| Quinine-HCl | water | 0.0 | 1.1 | 1.1 | 0.0 | 90.0 | 6.7 | 1.1 | 0.0 | 0.0 | 0.0 |
| chlorhex | 15.6 | 2.2 | 1.1 | 1.1 | 38.9 | 2.2 | 11.1 | 0.0 | 0.0 | 27.8 | |
| Group B: `unaffected' | |||||||||||
| Citric acid | water | 0.0 | 0.0 | 1.1 | 2.2 | 10.0 | 84.4 | 0.0 | 0.0 | 2.2 | 0.0 |
| chlorhex | 5.6 | 1.1 | 5.6 | 0.0 | 22.2 | 63.3 | 1.1 | 0.0 | 0.0 | 1.1 | |
| MSG | water | 5.6 | 1.1 | 0.0 | 0.0 | 3.3 | 1.1 | 88.9 | 0.0 | 0.0 | 0.0 |
| chlorhex | 6.7 | 7.8 | 0.0 | 0.0 | 7.8 | 0.0 | 77.8 | 0.0 | 0.0 | 0.0 | |
| Sucrose | water | 0.0 | 0.0 | 1.1 | 5.6 | 0.0 | 1.1 | 0.0 | 88.9 | 3.3 | 0.0 |
| chlorhex | 0.0 | 0.0 | 7.8 | 11.1 | 0.0 | 0.0 | 0.0 | 76.7 | 4.4 | 0.0 | |
| Acid—sucrose | water | 0.0 | 0.0 | 3.3 | 0.0 | 0.0 | 2.2 | 0.0 | 3.3 | 91.1 | 0.0 |
| chlorhex | 0.0 | 0.0 | 8.9 | 8.9 | 0.0 | 1.1 | 0.0 | 1.1 | 80.0 | 0.0 | |
| Water | water | 1.1 | 1.1 | 0.0 | 0.0 | 0.0 | 0.0 | 3.3 | 0.0 | 0.0 | 94.4 |
| chlorhex | 5.6 | 11.1 | 2.2 | 0.0 | 5.6 | 5.6 | 0.0 | 0.0 | 1.1 | 68.9 | |
Chlorhexidine treatment significantly reduced the ability to correctly identify A (`affected') test stimuli [F(1,16) = 28.47, P < 0.0001] (Figure 1A). On average, subjects in the control (water treatment) group were able to correctly identify A stimuli with an accuracy rate of 74.2 ± 5.5% compared with the chlorhexidine treatment group, who performed at a rate of 35.1 ± 4.8% correct. The ability to correctly identify B (`unaffected') stimuli was not significantly (α = 0.05) different for the control (89.6 ± 3.0%) compared with the chlorhexidine group [73.3 ± 7.3%; F(1,16) = 4.21, P = 0.057] (Figure 1B); notable, however, is a tendency to identify B stimuli less accurately after chlorhexidine. Stimuli in the A group were more difficult to identify even without chlorhexidine, as evidenced by the significantly poorer performance of subjects in the water rinse group for A compared with B stimuli (t = 3.00, P < 0.004). This is not unexpected, as results from subjects in water rinse groups in previous studies using a similar set of stimuli and labels have also demonstrated that some stimuli are harder (e.g. NaCl and KCl) to identify than others (e.g. sucrose and acid) (Gent et al., 1999; Hettinger et al., 1999).
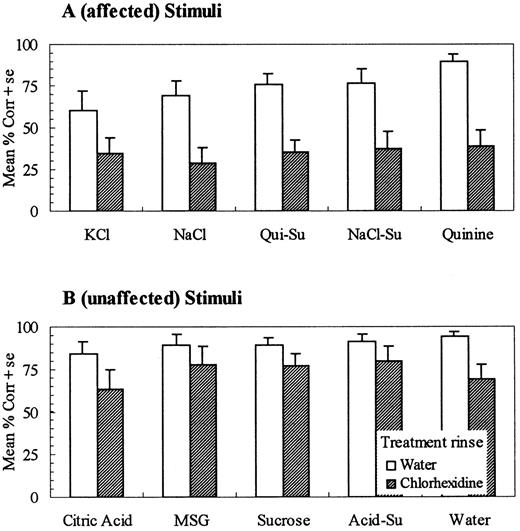
Mean percent correct identification for compounds known to be affected (A) (perceived taste intensity reduced) and unaffected (B) (perceived taste intensity unchanged) following chlorhexidine treatment. On average, chlorhexidine significantly reduced correct identification of affected compounds (P < 0.0001), but not unaffected compounds (P < 0.06).
Information theory measures: T10 and T2
Overall consistency of performance as measured by T10 was also significantly lower for the chlorhexidine group (2.02 ± 0.11 bits) compared with the control group (2.73 ± 0.11 bits; t = 4.48, P < 0.0001). The correlation between consistency (T10) and average percent correct was very high (r = 0.96, P < 0.0001). This means that subjects were using the labels as they were trained to use them.
As hypothesized for discriminations between two A stimuli as measured by T2, there was a significant stimulus × treatment interaction [F(9,144) = 10.54, P < 0.0001]. Post hoc comparisons revealed that for four of the 10 AA stimulus pairs, i.e. NaCl versus quinine-HCl, KCl versus quinine-HCl, NaCl versus KCl and NaCl-sucrose versus quinine-sucrose, the chlorhexidine group was performing at a level (0.36 ± 0.6 compared with 0.81 ± 0.04 bits for the water group) that did not differ significantly from chance performance, i.e. T2 = 0.40 bits (Hettinger et al., 1999; Figure 2). These results suggest that the taste qualities of NaCl, KCl and quinine-HCl are not readily distinguishable following chlorhexidine treatment. The remaining six AA pairs were single component stimuli compared with sucrose mixtures and, as would be expected, discrimination was not degraded with treatment (T2 was 0.91 ± 0.02 and 0.93 ± 0.03 bits for the water and chlorhexidine groups, respectively). For the 25 AB stimulus pairs there also was a significant stimulus × treatment interaction [F(24,384) = 7.18, P < 0.0001]. Post hoc comparisons showed that the chlorhexidine group performed at chance level (T2 = 0.41 ± 0.05 compared with 0.89 ± 0.03 bits for the water group) for the five AB pairs expected to be poorly discriminated, i.e. the solvent water compared with NaCl, KCl or quinine-HCl and sucrose, the unaffected `solvent', compared with the NaCl-sucrose or quinine-HCl—sucrose mixtures (Figure 2). Mean values of T2 for the remaining 20 AB pairs did not differ for the two groups (T2 was 0.94 ± 0.02 and 0.87 ± 0.03 bits for the water and chlorhexidine groups, respectively). Finally, for the 10 BB stimulus pairs treatment rinse was not a significant factor affecting T2 (P = 0.48) nor was there a significant stimulus × treatment interaction (T2 was 0.96 ± 0.01 and 0.94 ± 0.02 bits for the water and chlorhexidine groups, respectively).
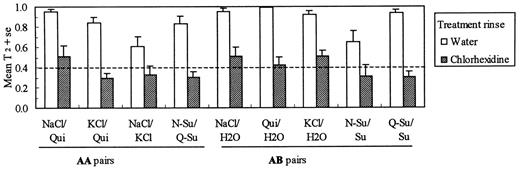
Stimulus discriminability, as measured by T2, for four AA (affected versus affected) and five AB (affected versus unaffected) stimulus pairs. The dashed line represents the mean T2 resulting from a computer simulation of 50 randomly behaving subjects (0.40 ± 0.02) (Hettinger et al., 1999). For these nine stimulus pairings values of T2 for the chlorhexidine treatment group did not differ significantly from random performance.
Pattern of errors
Examination of the pattern of response errors supported our hypothesis that A stimuli would elicit more `solvent' responses following chlorhexidine treatment compared with controls and, in fact, there were significantly more responses of `water' to NaCl, KCl and quinine-HCl and responses of `sugar' to the NaCl—sucrose and quinine—sucrose mixtures [F(1,16) = 24.00, P < 0.0001] (Figure 3). The pattern of response errors to water was also quite different for the two treatment groups, with the chlorhexidine group making significantly more use of response labels for salts, acid and quinine [F(1,16) = 7.22, P < 0.016] (Figure 4).
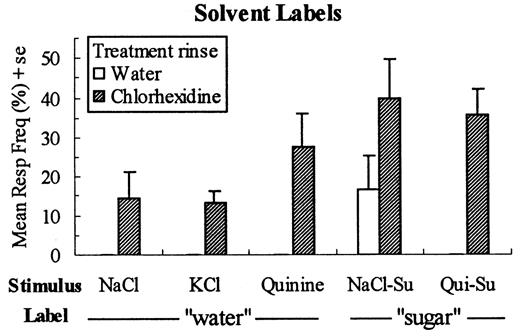
Mean (± SE) frequency (as a percentage of all responses) of solvent label use, i.e. 'water' responses for NaCl, KCl and quinine-HCl and 'sugar' responses for the NaCl-sucrose and quinine—sucrose mixtures for the water and chlorhexidine rinse groups.
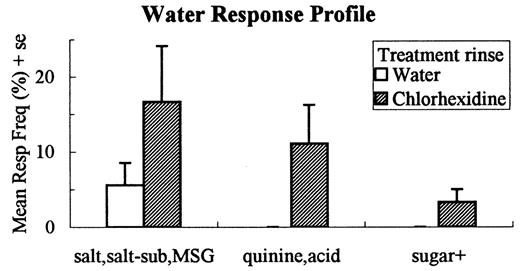
Mean (± SE) frequency (as a percentage of all responses) of 'salt' responses (salt, salt substitute and MSG), quinine and acid responses and 'sugar+' responses (sugar, salt—sugar, quinine—sugar and acid—sugar) to water for the water and chlorhexidine rinse groups.
Discussion
`Stimulus discrimination'
In general, subjects in the water treatment group performed very well both in the ability to correctly identify stimuli and, ipso facto, to discriminate among them. In fact, out of 45 stimulus pairs, T2 was significantly less than a perfect score of 1.0 bit for only two: NaCl versus KCl (0.61 ± 0.10 bits) and NaCl versus MSG (0.82 ± 0.05 bits). We have observed similar evidence of confusions among these same three salts (NaCl, KCl and MSG) in previous confusion matrix studies (Gent et al., 1999; Hettinger et al., 1999).
The subjects in the chlorhexidine treatment group did not perform well either in correctly identifying stimuli or discriminating among them. For this group there were 13 stimulus pairs with values of T2 significantly less than 1.0 bit. Of these, nine were at chance level (0.40 bits) and included single component A stimuli (NaCl, KCl and quinine-HCl) compared with water (three pairs) or each other (three pairs) and the A stimulus—sucrose mixtures (NaCl—sucrose and quinine—sucrose) compared with sucrose (two pairs) or each other (one pair) (Figure 2).
Results from a recent study suggest why these particular discriminations were so difficult. In Frank et al. (Frank et al., 2001) subjects were asked to rate the perceived taste intensity and name the taste quality of NaCl presented as a single stimulus and in a mixture with sucrose before and after chlorhexidine treatment. Results showed that the perceptual intensities of NaCl and the NaCl—sucrose mixture were significantly reduced following chlorhexidine treatment. Furthermore, the quality profiles changed significantly after chlorhexidine (Figure 5) (Frank et al., 2001). Treatment reduced `salty' responses and increased `bitter' responses to NaCl and increased `sweet' responses to the NaCl—sucrose mixture. In the present study, with the reduced intensities of NaCl, KCl and quinine-HCl following chlorhexidine, each would taste more like water (`tasteless') and the sucrose mixtures would taste more like sucrose (`sweet') (Figure 3), thus making discrimination between members of these nine stimulus pairs very difficult. In the next section we elaborate on the relationship between TCM identification measures and results dependent on subjective assessments of taste intensity and quality.
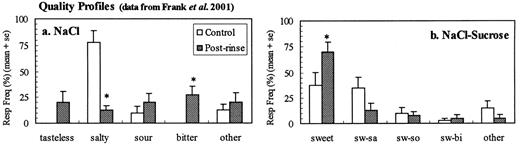
The effect of chlorhexidine on the average quality response frequencies to (A) NaCl and (B) NaCl-sucrose mixture. Responses during a 30 min post-rinse period that differed significantly from control responses are indicated (*) (P 0.01). The `other' category for NaCl includes `sweet' and all response combinations of two or more qualities. The `other' category for the sucrose mixture includes salty, sour, bitter and all response combinations of two or more qualities excluding sweet.
Taste intensity and taste quality
In general, the TCM produced results compatible with those obtained with quality and intensity judgements (Helms et al., 1995; Breslin and Tharp, 2001; Frank et al., 2001). Although the TCM methodology does not explicitly measure perceptual intensity or quality, it provides a powerful objective tool to understanding the processing of taste information. Intensity reductions are reflected in numbers of errors for solvent labels or in random label choice if an appropriate solvent label is not provided (Gent et al., 1999). The TCM explicitly avoids quality labels and thus requires no definition of semantic quality; rather, subjects identify stimuli from a fixed list of labels, one for each stimulus (Hettinger et al., 1999). TCM utility is based on consistent stimulus identification and multiple pairwise comparisons irrespective of actual quality recognition. The perceived quality of any test solution may be inferred from a subject's pattern of labeling errors and pairwise discriminability, as measured by T2, in comparison with responses to standard solutions. Quality prototypes such as NaCl for `salty' and sucrose for `sweet' serve as standards, as in animal studies of generalization of conditioned taste aversions (Frank, 2000).
A stimuli, defined as having reduced taste intensity following chlorhexidine treatment (Lang et al., 1988; Helms et al., 1995; Breslin and Tharp, 2001; Frank et al., 2001), would be expected to be mistaken for `water' (or `sucrose' for A—sucrose mixtures) in the present study. Following chlorhexidine, two-thirds of responses to the A stimulus quinine-HCl were `water' or `quinine' and more than two-thirds of the responses to the A salts NaCl and KCl were `water' or a salt label (salt, salt substitute or MSG) (Table 2), supporting our expectations. However, the chlorhexidine group's errors also include a greater use of salt response labels for quinine-HCl compared with controls [F(1,16) = 10.15, P < 0.006] and greater use of quinine and acid response labels in response to NaCl and KCl compared with controls [F(1,16) = 29.64, P < 0.0001] (Figure 6), suggesting a quality change. When subjects give quality names to test solutions, NaCl is more frequently identified as `bitter-sour' following chlorhexidine treatment (Frank et al., 2001).
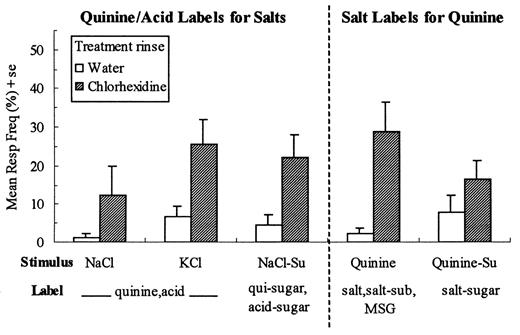
Mean (± SE) frequency (as a percentage of all responses) of quinine and acid responses for NaCl and KCl and salt, `salt substitute and MSG responses for quinine.
In the chlorhexidine group there were four AB stimulus pairs involving the B stimulus citric acid, with values of T2 reflecting greater than chance performance but significantly less than 1.0 bit. The pairs included acid versus quinine-HCl (0.67 ± 0.09), acid versus KCl (0.68 ± 0.06) and acid—sucrose versus NaCl—sucrose (0.69 ± 0.04), as well as acid versus water (0.87 ± 0.04). Lower T2 values for acid versus A ionic stimuli is a consequence of more frequent use of quinine and acid response labels for the A member (Figure 6) and more frequent use of quinine and salt response labels for acid (Table 2) by the chlorhexidine group (47.8 ± 17.3) compared with controls (13.3 ± 6.9) (P < 0.05). Thus, in general, subjects in the chlorhexidine-treated group were less discriminating in their use of labels for ionic stimuli (salts, citric acid and quinine) than controls.
Like sucrose and MSG and as expected, citric acid, an `unaffected' B stimulus, did not evoke greater use of water response labels in the chlorhexidine group compared with controls (Table 2). Lower water versus acid discrimination is explained by greater use of salt, quinine and acid response labels for water by the chlorhexidine group compared with controls (Figure 4 and Table 2). Previous observations, where subjects gave quality names to test solutions, suggested that water may acquire a `bitter-sour' off taste following chlorhexidine treatment (Frank et al., 2001). That `off taste' may also explain a greater use of sugar+ mixture labels for sucrose by the chlorhexidine group (23.3 ± 7.5), compared with the controls (10.0 ± 4.4) (P < 0.07). Infrequent reports of altered taste quality (dysgeusia) for sucrose and citric acid were noted in a recent study of effects of chlorhexidine treatment (Marinone and Savoldi, 2000). This `off taste' may contribute to the trend toward poorer TCM performance to B stimuli in the chlorhexidine group. How the `off taste' may be generated is a matter of speculation.
Number of labels used
It was our expectation that subjects in the chlorhexidine treatment group would not be able to taste some of the stimuli, especially those in replicates 1 and 6, closest to treatment, and thus would not use all of the labels. However, chlorhexidine-treated subjects might have tried to compensate for many tasteless `blanks' by using more of the different labels in replicates 6-10 than in replicates 1-5. To shed some light on this issue, we used ANOVAs to analyze the number of different labels (10 maximum) used in each replicate. The chlorhexidine rinse group used fewer labels on average (7.4 ± 0.2) than the water treatment group (8.8 ± 0.3), as expected (P < 0.001). However, neither the water control group nor the chlorhexidine group used more labels in the second half of the session (replicates 6-10) than the first half of the session (replicates 1-5). This argues against a progressive compensation for `blanks' by subjects in the chlorhexidine group. Yet, a replicate × treatment interaction (P < 0.03) was accounted for by a linear trend in label use from 6.8 ± 0.3 labels at the beginning to 7.7 ± 0.2 labels at the end of a half-session by the chlorhexidine group (P < 0.04). No such trend was seen for the controls. The chlorhexidine group's increase in number of labels used over the course of each 30 min half-session is likely the result of a lessening of the effect of chlorhexidine during that period (Frank et al., 2001), allowing identification of tastes of more of the stimuli they were trained to recognize.
Conclusion
The present study has demonstrated that chlorhexidine severely impairs identification of NaCl, KCl and quinine-HCl, taste stimuli that require appreciation of salty and bitter taste qualities. The damage, quantified in terms of information transferred (T) derived from a TCM, reflect the profound effects of chlorhexidine on salty taste, seemingly a block of all saltiness, and its selective block of the taste of a subset of bitter stimuli (Helms et al., 1995; Breslin et al., 2001; Frank et al., 2001). The mechanism of inhibition of salty taste is unclear; but chlorhexidine may block ion channels in taste receptor cell membranes (Breslin and Tharp, 2001) or interfere with paracellular ion movements (Frank et al., 2001). Molecular, physiological and psychophysical evidence consistent with multiple bitter receptors (Chandrashekar et al., 2000; Matsunami et al., 2000; Caicedo and Roper, 2001; Delwiche et al., 2001) could account for its bitter stimulus selectivity, as chlorhexidine [as bitter as quinine on a molar basis (Lang et al., 1988) but more persistent] may bind to the same subset of bitter receptors that bind quinine. In fact, chlorhexidine's effects on bitterness can be, to a large extent, replicated by a 3 min exposure to quinine (Breslin and Tharp, 2001).
Consistent with its small effects on sweet and sour tastes (Helms et al., 1995; Breslin et al., 2001; Frank et al., 2001), chlorhexidine hardly disrupted identification of sucrose and citric acid. If chlorhexidine were to have a general effect on membrane structure or permeability, the taste of sucrose should also be strongly modified. The enhanced citric acid intensity reported by some subjects may reflect incorporation of a mild, long lasting burning sensation attributable to chlorhexidine itself into the rating (Frank et al., 1993; Frank et al., 2001; Portmann et al., 2001).
Inhibition of salty tastes by chlorhexidine resembles the blocking of sweet tastes by gymnemic acid (Hellekant and van der Wel, 1989). Gymnemic acid, a mixture of bitter acidic glycosides, blocks the sweet taste of all sweet stimuli (Frank et al., 1992) and exposure to purified gymnemic acid may block the taste of quinine (Bartoshuk et al., 1969). Like gymnemic acid for sweet, the generality of salty inhibition by chlorhexidine supports the case for a unitary percept for the salty quality. As an effective, persistent, selective taste inhibitor, chlorhexidine should provide a means for revealing the role of salty taste in human taste discrimination.
We gratefully acknowledge the insightful comments of our colleague, Lawrence E. Marks. This work was supported by NIH grant P50 DC00168 and the University of Connecticut Health Center. This work was previously presented as an abstract (Gent et al., 2000).
References
Attneave, F. (
Bartoshuk, L.M., Dateo, G.P., Vandenbelt, D.J., Buttrick, R.L. and Long, L. (
Breslin, P.A.S. and Tharp, C.D. (
Caicedo, A. and Roper, S.D. (
Chandrashekar, J., Mueller, K.L., Hoon, M.A., Adler, E., Feng, L., Guo, W., Zuker, C.S. and Ryba, N.J. (
Delwiche, J.F. Buletic, Z. and Breslin, P.A.S. (
Frank, M.E. (
Frank, M.E., Gent, J.F. and Hettinger, T.P. (
Frank, R.A., Mize, S.J.S. and Kennedy, L.M. (
Frank, R.A., van der Klaauw, N.J. and Schifferstein, H.N.J. (
Gent, J.F., Hettinger, T.P., Frank, M.E. and Marks, L.E. (
Gent, J.F., Frank, M.E. and Hettinger, T.P. (
Helms, J.A., Della-Fera, M.A., Mott, A.E. and Frank, M.E. (
Hellekant, G. and van der Wel, H. (
Hettinger, T.P., Gent, J.F., Marks, L.E. and Frank, M.E. (
Lang, N.P., Catalanotto, F. A., Knöpfli, R. and Antczak, A.A.A. (
Marinone, M.G. and Savoldi, E. (
Matsunami, H., Montmayeur, J.P. and Buck, L.B. (
Ossebaard, C.A. and Smith, D.V. (
Ossebaard, C.A. and Smith, D.V. (
