-
PDF
- Split View
-
Views
-
Cite
Cite
Faranak Ansari, Mats Erntell, Herman Goossens, Peter Davey, ESAC II Hospital Care Study Group, The European Surveillance of Antimicrobial Consumption (ESAC) Point-Prevalence Survey of Antibacterial Use in 20 European Hospitals in 2006, Clinical Infectious Diseases, Volume 49, Issue 10, 15 November 2009, Pages 1496–1504, https://doi.org/10.1086/644617
Close - Share Icon Share
Abstract
Background. Point-prevalence surveys have been used to document antimicrobial use in hospitals for >20 years. However, published surveys are inconsistent with respect to population, indication, and the details of therapy that were included. We aimed to standardize a method for surveillance of antibacterial use in hospitals from different health care systems and to identify targets for quality improvement.
Methods. We adapted a Web-based reporting system from STRAMA, the Swedish Strategic Programme against antibiotic resistance. One hospital from each of 20 countries took part in the survey, which was completed during 2 calendar weeks during 1 April 2006 through 31 May 2006. The survey included all inpatient beds for adults and children and identified all patients who were receiving systemic antibacterial treatments on the day of survey and all patients who had received antibacterial prophylaxis for surgery on the previous day.
Results. On the day of survey there were 11,571 inpatients in the 20 participating hospitals, of whom 30.1% were receiving antibacterial treatment (range, 19%-59%). The most common anatomic sites of infection for which antibacterials were prescribed were respiratory tract (24%); skin, bone, and joint (18%); intra-abdominal organs (16%); and urinary tract (11%). The following 3 quality indicators were identified: indication documented in case notes (64%), prophylaxis for surgery not continued for >24 h (60%), and therapy for community-acquired pneumonia not including third-generation cephalosporins or quinolones (78.5%).
Conclusion. A Web-based method for a point-prevalence survey was successfully piloted in 20 hospitals across Europe and offers a standardized instrument that can identify targets for quality improvement.
Point-prevalence surveys have been used to provide information about antimicrobial use and to assess the impact of interventions such as antibiotic policies for >20 years [1]. Until recently, these surveys were organized by single hospitals or by regional networks of hospitals (Table 1). Data regarding antimicrobials have also been collected in surveys of hospital-acquired infection. For example, a national survey of 11,608 inpatients in all acute-care hospitals in Scotland during 2005–2006 reported that 32.1% of patients were receiving antimicrobials and provided details about the drugs used but not about dosage, route of administration, or indication [11]. In Sweden, STRAMA (the Swedish Strategic Programme against antibiotic resistance) established a method for national point-prevalence surveys of antibacterial use with Web-based reporting [5]. STRAMA has coordinated 3 national point-prevalence surveys of hospital antibacterial use in 2003, 2004, and 2006 [12]. In addition, regional benchmarking studies have been conducted in Sweden with use of Web-based reporting systems [13].
The European Surveillance of Antimicrobial Consumption (ESAC) was established in 2000. In the first phase of the ESAC project data collection was limited to national sources of information about antibacterial use. Data about antibacterial use in care of ambulatory patients were available from 26 countries [14], whereas only 15 countries could provide data about antibacterial use in hospitals [15]. Moreover, the data did not include reliable information about the number of occupied bed days or admissions for the hospitals; thus, the results were expressed as defined daily doses (DDDs) per 1000 inhabitants. This is a reasonable measure of antibacterial use at the regional level, but it does not provide useful information for comparison of hospitals [15]. In the second phase of the ESAC project from 2004 through 2007, a hospital subproject was established to collect more detailed information from individual hospitals. We aimed to collect data from hospital pharmacies for longitudinal analysis of antibacterial consumption and to establish the first European point-prevalence survey. We selected the STRAMA Web-based data collection form because it included key information about drug doses and routes of administration for prophylaxis and treatment in children and adults, which would facilitate interpretation of data about antibacterial consumption. In comparison, the other published European studies were inconsistent and incomplete (Table 1).
Our point-prevalence survey had 3 objectives. The first objective was to standardize a method for performing a point-prevalence survey of antibacterial use in European hospitals from different health care systems on the basis of the STRAMA data collection and reporting method. The second objective was to collect and make publicly available data about prescribed daily doses (PDDs) of antibacterials in hospital practice for comparison with World Health Organization (WHO) DDDs, to inform the interpretation of data about antibacterial use from hospital pharmacies. The third objective was to identify targets for quality improvement.
Methods
ESAC national representatives were invited to participate in the study and to recruit 1 hospital to perform a point-prevalence survey of all inpatients on a single day. The 20 countries that took part were Austria, Belgium, Croatia, Czech republic, Denmark, England, Estonia, Finland, France, Greece, Latvia, Lithuania, Malta, Netherlands, Northern Ireland, Norway, Poland, Scotland, Slovenia, and Sweden.
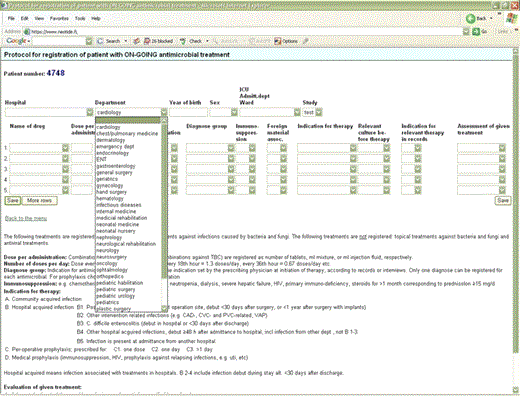
Neotide, the Finnish company that maintains the software for STRAMA, produced an English-language version of the software. The software was customized for each hospital that used it on the basis of their specialties and drug list. All hospitals collected data by review of case notes. A workshop for training on the methods of the point-prevalence survey and use of the Web-based software was organized in January 2006 in Prague. The training meeting reviewed pilot data from each of the participating hospitals and also used specimen cases from 1 hospital for training in data entry, to ensure consistency of interpretation of indications for antibiotic use.
The survey was completed during 2 calendar weeks from 1 April 2006 through 31 May 2006. Surgical wards were surveyed on Tuesday, Wednesday, or Thursday to capture information about prophylaxis during the previous 24 h. Medical wards were surveyed on Monday, Tuesday, Wednesday, or Thursday. Depending on the number of beds, hospitals could decide to complete the survey over ⩾1 days. However, all beds in each administrative unit (eg, internal medicine or general surgery) should have been completed in a single day.
Hospitals were asked to identify survey staff familiar with reading patient notes (eg, infectious disease specialist, microbiologist, pharmacist, or infection control nurse). Hospitals could decide to have the survey completed by a single person or by a team of people with specialist expertise in microbiology or infectious diseases.
All patients who were in the hospital at 8 AMon the days of survey were included in the study. Patients who were receiving antibacterials at 8 AMon the day of the survey were identified, and the details of prophylaxis or therapy administered were recorded on the data sheet. For surgical patients, administration of prophylactic antibacterials was recorded if received during the previous 24 h. The reason for this was to code the duration of prophylaxis as either 1 dose, 1 day, or >1 day.
The diagnosis and indication for prophylaxis or treatment used the same diagnosis group, which was anatomically related to an organ (eg, skin or lungs). In addition to looking at all patient records, staff could request additional information from nurses, pharmacists, or doctors. However, there was no discussion about whether prescriptions were appropriate.
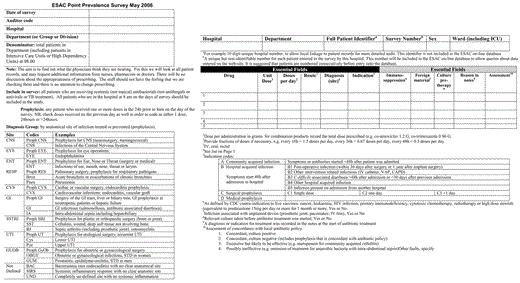
We used the WHO's Anatomical Therapeutic Chemical Classification of medicines [16]. All systemic antibacterials in J01, J04AB (only rifampicin), A07AA (only oral vancomycin and colistin), and P01AB (only oral metronidazole) classes were included. Actual prescribed doses were recorded for both adults and children for single and combination antibacterials (eg, 960 mg of cotrimoxazole). Antibacterials are either presented by group (eg, cephalosporins) or by individual chemical substance (eg, cefazolin). Where necessary, the route of administration has also been specified. The survey form and a print screen of the STRAMA data entry page are provided in Figures 1and 2.
European Surveillance of Antimicrobial Consumption (ESAC) Point-Prevalence Survey form.
Throughout the article, we use 3 denominators: patients, anatomical sites of infection, and antibacterials administered. Each patient may have had >1 anatomical site of infection and may have received >1 antibacterial. It was not always possible to allocate each antibacterial to a site of infection.
Statistical analysis. We used standard methods to calculate 95% confidence intervals (CIs) for the proportion of patients who received antibacterials in any hospital and for the ratio between PDDs and WHO DDDs [17]. We ranked hospitals by the percentage of patients who received antibacterials, and we calculated 95% CIs for the ranks [18]. The method uses a Monte Carlo simulation for repeated sampling from the normal distribution around the observed value for each hospital, as described elsewhere [18]. We performed 10,000 simulations to calculate 95% CIs for the ranking of the 20 hospitals.
Results
The 20 participating hospitals had a total of 15,563 beds (mean, 778 beds; median, 672 beds; range, 243–2459 beds). Detailed information about case mix was returned from 18 hospitals with 14,310 beds, of which 13 were teaching hospitals with 12,469 beds (87% of the total beds in the 18 hospitals) and 9 were tertiary care hospitals with 9373 beds (66% of the total). At least 1 intensive care unit was present in 18 hospitals; 14 hospitals had pediatric units, 9 had a pediatric intensive care unit, 14 had hematology units, 13 had renal dialysis units, and 8 performed organ transplantation. Two hospitals were infectious disease hospitals with 747 beds, and 11 of the remaining hospitals had infectious diseases departments.
On the day of the survey, there were 11,571 patients in the 20 participating hospitals, of whom 3483 (30.1%) were receiving antibacterials. Of the treated patients 1653 (47.5%) were female and 371 (10.7%) were children aged <17 years, of whom 145 (39%) were aged <5 years.
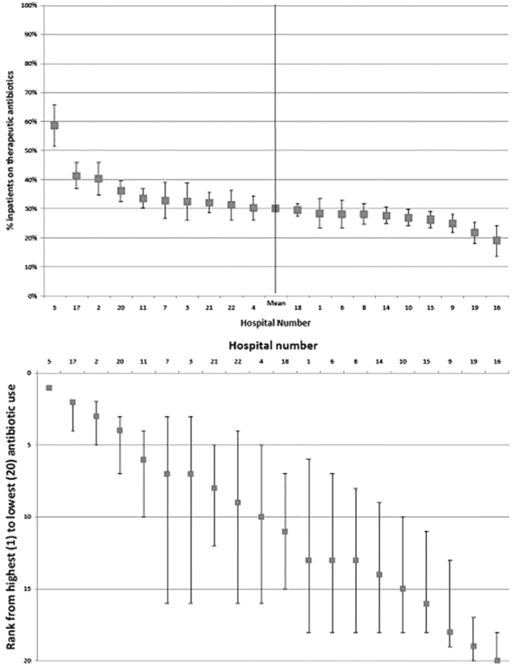
The proportion of patients receiving antibacterials ranged from 19% to 59% (Figure 3, top ). The 95% CIs for the rank of each hospital demonstrate much greater uncertainty than the 95% CIs for the proportion of patients receiving antibacterials (Figure 3, bottom ). For 12 of the hospitals, the 95% CI for their rank crosses the median (10th) position; thus, it is not possible to say with confidence that they are in the upper or lower one-half of the distribution for antibacterial use. However we can be 95% confident that 4 hospitals (numbers 5, 17, 2, and 20) are in the top one-half for antibacterial use and that 4 hospitals (numbers 15, 9, 19, and 16) are in the bottom one-half.
Top, Percentage of patients treated with antibacterials with 95% confidence intervals (vertical bars ) for 20 hospitals in the ESAC point-prevalence survey. Bottom, Estimated true ranks (data points ) from 1 (highest) to 20 (lowest) for users of antibacterials with 95% confidence intervals for ranks of the 20 hospitals in the top panel, demonstrating greater uncertainty associated with ranks ascribed to individual institutions.
The treated patients received a total of 4748 an-ti-bac-te-ri-als. The indications were community-acquired infection in 48.4% (n=2299), hospital-acquired infection in 30% (n=1425), preoperative prophylaxis in 15% (n=707), and medical prophylaxis in 6.7% (n=317). Examples of medical prophylaxis included long-term prevention of recurrent urinary tract infection and prophylaxis in patients who were immunocompromised.
Samples for bacterial culture were obtained before therapy for a similar proportion of adults (1822 [43.0%] of 4242) and children (275 [54%] of 506). There was information about the indication for treatment in the case notes for 3056 (64.4%) antibacterial treatments.
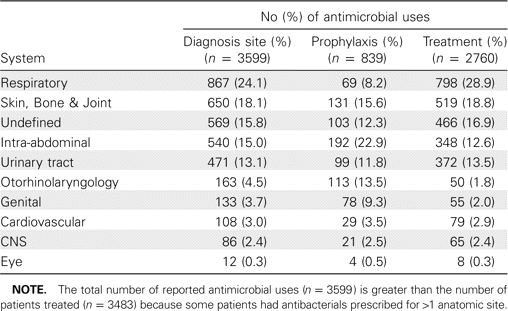
The most common anatomical systems involved were the respiratory tract (28.9%) for treatment and intra-abdominal organs (22.9%) for prophylaxis (Table 2). The anatomical system involved was undefined for 569 (15.8%) antibacterial treatments; 275 of these antibacterial treatments were prescribed for sepsis, and 168 were prescribed for bacteremia with no defined site of origin. However, 126 antibacterials were prescribed to patients with completely undefined site of infection and with no systemic inflammation.
Anatomical Sites Recorded for Antimicrobial Treatment and Prophylaxis
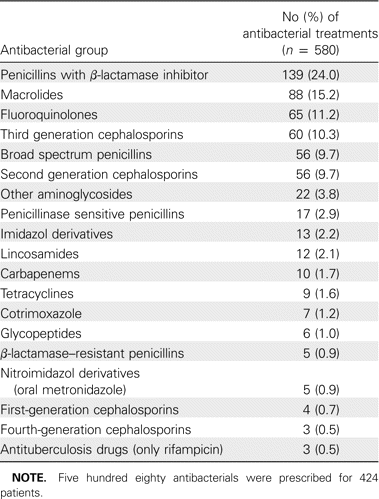
The antibacterials used for treatment of community-acquired pneumonia were mainly broad spectrum; quinolones accounted for 11.2% and third-generation cephalosporins for 10.3% of treatments, whereas β-lactamase-sensitive penicillins only accounted for 3% of treatments (Table 3).
Antibacterials Used for Treatment of Community-Acquired Pneumonia
In surgical departments, 511 patients received 616 antibacterials for surgical prophylaxis. The duration of antibacterial prophylaxis for surgery was >1 day in 57.3% of all patients who received prophylaxis, ranging from 42.9% for pediatric to 90.0% for otorhinolaryngology treatments (Table 4). Single-dose preoperative prophylaxis was used in 25.2% of patients, ranging from 6.7% for otorhinolaryngology to 45.1% for gynecology (Table 4).
Duration of Surgical Prophylaxis for Patients in Surgical Departments
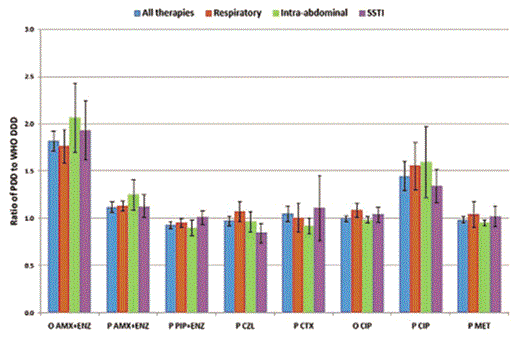
For adult patients, a WHO DDD was available for 59 parenteral and 47 oral antibacterial treatments that were administered in the point-prevalence survey [16]. There was no difference in reported PDDs and WHO DDDs for 5 (10.6%) oral and 11(18.6%) parenteral antibacterial treatments. The PDD exceeded the WHO DDD for 21 (44.7%) oral and 30 (50.9%) parenteral antibacterial treatments. The PDD was less than the WHO DDD for 21 (44.7%) oral and 18 (30.5%) parenteral antibacterial treatments. To identify variables that might explain the relationship between PDD and WHO DDD, we focused on the 10 most commonly prescribed antibacterials for adults. In descending order, these were oral ciprofloxacin (n=328), parenteral cefuroxime (n=307), oral amoxicillin plus enzyme inhibitor (n=285), parenteral metronidazole (n=264), parenteral amoxicillin plus enzyme inhibitor (n=253), parenteral ciprofloxacin (n=198), piperacillin plus enzyme inhibitor (n=160), cefazolin (n=157), ceftriaxone (n=139), and gentamicin (n=104). It was not possible to analyze the relationship between PDD and WHO DDD by hospital, because the range of use of all 10 drugs was 22–291 treatments per hospital, and none of the 10 drugs were recorded in every single hospital. Therefore, we analyzed the relationship between PDD and WHO DDD for the top 3 indications, respiratory, intra-abdominal, and skin or soft-tissue infections (Figure 4). We have only included 8 drugs, because there were <10 treatments for respiratory infections with cefazolin or gentamicin. The data do not show any consistent relationship between indication and the ratio of PDD to WHO DDD. The 95% CIs overlap for all drugs, suggesting that any differences are likely to be attributable to chance variation (Figure 4). Although there are only 2 oral antibacterials represented, the data clearly show that the relationship between PDD and WHO DDD is formulation dependent. However, divergence can go in either direction; for amoxicillin plus enzyme inhibitors, the PDD to DDD ratio is higher for the oral formulation, whereas the opposite applies to ciprofloxacin.
The ratio of prescribed daily dose (PDD) to World Health Organization defined daily dose (DDDs) for 8 formulations of antibacterials that were prescribed to at least 10 adults for each of the 3 most common indications for therapy. The bars show 95% confidence intervals. AMX+ENZ, amoxicillin plus enzyme inhibitor; CIP, ciprofloxacin; CTX, ceftriaxone; CZL, cefazolin; MET, metronidazole; O, oral; P, parenteral; PIP+ENZ, piperacillin plus enzyme inhibitor.
Discussion
This study showed that the Web-based method for collection of point-prevalence survey data with automatic reporting was implemented successfully in all 20 participating hospitals. The dataset that was collected was more limited than the original STRAMA dataset, which also included assessment of the appropriateness of antibacterial therapy with information about implanted devices and immunosuppression. These additional data items were more difficult to collect, and hospitals were concerned about the validity of the information; thus, we have not included these results. However, we were able to establish a consistent method for collection of basic data about antibacterial use that will facilitate comparison between hospitals and countries. At the same time, hospitals and policy makers need to be aware that data collection and processing are too time consuming to make frequent hospital-wide surveys a sustainable solution to the problem of overuse of antibiotics.
Previously published studies show wide variation in the prevalence of antibiotic use, from 16.6% to 49.3% (Table 1). However, this range of use is likely to be explained at least in part by the inconsistency of data collection with respect to the population of patients and the inclusion or exclusion of surgical prophylaxis (Table 1). It is striking that the STRAMA national surveys performed in 2003 and 2004 reported almost identical antibiotic-use prevalence (30.9% and 31.9%), which suggests that prevalence of use may remain stable over time [5].
In our survey, there was wide (3-fold) variation in antibacterial consumption between European hospitals (Figure 3, top ). Nonetheless, there was considerable variation in the ranking of hospitals, and only 8 of the 20 hospitals could be reliably placed in the top or bottom one-half of the ranking by antibacterial use (Figure 3, bottom ). Ranking is a notoriously unreliable method for comparing the performance of hospitals [19]. The purpose of our ranking was to assess the reliability of classifying hospitals as relatively high or low users of antibacterials as a precursor to understanding the hospital characteristics that may explain variation in antibacterial use. For example, 2 of the 4 hospitals that were reliably in the top one-half for antibacterial use were specialist infectious diseases hospitals. Policy makers need to resist the temptation to rank hospitals by antibacterial use as a performance measure for 2 reasons. First, most of the variation in ranking is attributable to chance. Second, genuine variation in ranking is likely to be explained by obvious differences in case mix [20].
We identified 3 targets for quality improvement. First, the duration of preoperative prophylaxis was >24 h for the majority of patients in all surgical specialities. Although there is continuing debate about the effectiveness of single-dose prophylaxis versus additional postoperative doses [21], there is no evidence to support prolonging surgical prophylaxis for >24 h [22]. The target rate for duration of prophylaxis >24 h should be 0% for all specialties [23]. Second, the range of antibacterials used to treat pneumonia was not consistent with evidence-based guidelines that are in place in most European countries [24]. In particular, the use of penicillinase-sensitive penicillins was very low (Table 2). Third, the documentation of antibacterial therapy is still poor. Although the average rate of documentation of indication (64.4%) was higher than that in previous audits [25], it is still unacceptably low. Documentation should be the rule, such that >95% reliability should be expected [23].
The WHO DDD is the single most commonly prescribed daily dose worldwide. Because the use of antibiotics is much more common in care of ambulatory patients than in hospitalized patients, we had expected that doses in ambulatory care would be lower than that in hospitals, such that the WHO DDD would be consistently lower than the PDD, especially for oral drugs. However, we found that the WHO DDD was almost as likely to be greater than the PDD for oral and parenteral medicines. Shifts between drugs could result in substantial changes in DDD that are purely attributable to the change in substance prescribed, not the number of patients treated. For example, a shift in antibiotic policy from parenteral ciprofloxacin to parenteral amoxicillin plus enzyme inhibitor would result in a 50% decrease in DDD, even if the same number of patients were treated for the same number of days (Figure 4). Consequently, the differences between hospitals in terms of antibacterial use measured in DDDs are explained at least in part by differences in the choice of drugs that are used in addition to differences in the number of patients treated and the duration of therapy. These results add to the evidence from ESAC ambulatory care studies, which suggests that the WHO DDD should not be used as the sole measure of antimicrobial use [26].
In conclusion, the strengths of this study are that we have shown that the Web-based point-prevalence survey methodology can be applied successfully to surveillance of antibacterial prescriptions in hospitals from 20 different countries, and that the results identify targets for quality improvement. The weaknesses of the study are that we only included 1 hospital per country and that the hospitals were very heterogeneous in size and specialties. The method will require additional testing with more hospitals to fully assess generalizabilty. In 2006, the ESAC team made a successful bid to the European Centre for Disease Control to continue funding the project. This bid included the method for the point-prevalence survey that we have tested. ESAC has developed and tested an online database in 52 hospitals in 2008 with the aim of conducting a much larger survey in 2009 to investigate hospital characteristics that explain variation in antibacterial use. We are also working closely with the WHO, which recognizes the need for a standardized, global audit tool.
ESAC II Hospital Care Study Group
Lead: Peter Davey and Faranak Ansari in Dundee; ESAC coordinator: Herman Goossens and Matus Ferech in Antwerp; software support: Mats Erntell (STRAMA), Johan Kullas (Neotide, Finland); and members: Austria (Sigrid Metz), Belgium (Hilde Jansens), Croatia (Arjana Tambić Andrašević, Irina Cazin),Czech Republic (René Mach, Jiri Vlcek), Denmark (Birgit Molstad), England (Conor Jamieson), Estonia (Piret Mitt), Finland ( Nina Elomaa), France (Isabelle Patry, Xavier Bertrand), Greece (Anastasia Antoniadou, Helen Giamarella), Latvia (Elina Pujate), Lithuania( Ilma Bertulyte), Malta (Peter Zarb), Netherlands (Margreet Filius, Claire van Nispen tot Pennerden), Northern Ireland(Sheila Maltby), Norway (Cecile Syrrist), Poland (Pawel Grzesiowski), Scotland (Faranak Ansari, Kirsteen Hill), Slovenia (Milan Cizman), and Sweden (Mats Erntell).
Acknowledgments
Neotide ( http://www.neotide.fi/contact_en.html) developed the software and made an English-language version available for this study.
Financial support. The ESAC project was supported by a grant from DG SANCO of the European Union.
Potential conflicts of interest. P.D. has received funding for research studies from Janssen Cilag and Pfizer. All other authors: no conflicts.
References
Members of the study group are listed at the end of the text.





Comments