


Abstract
Human papillomavirus (HPV) vaccination uptake remains lower than other recommended adolescent vaccines in the United States. Parental attitudes are important predictors of vaccine uptake, yet little is known about how they have changed over time.
Participants included US residents aged 13–17 years with documented vaccination status who had received <3 doses of HPV vaccine whose parents responded to the National Immunization Survey–Teen, 2010–2015.
Of the 76971 participants, 63.0% were male, 58.8% were non-Hispanic white, and 14.4 years was the median age. The percentage of unvaccinated teens decreased from 2010 to 2015, yet, annually, parents of unvaccinated teens of both sexes most often reported that they were “not likely at all” to vaccinate their teen. The percentage decreased significantly from 41.5% to 31.2% (P < .001) for parents of unvaccinated females from 2010 to 2015 but did not change among parents of males from 2012 to 2015. Conversely, parents of undervaccinated teens of both sexes reported higher and increasing vaccination intent over time. In 2015, nearly one-third of parents of unvaccinated teens reported that the vaccine was “not needed/necessary.” Concerns about vaccine safety and side effects declined among parents of unvaccinated females but increased among parents of males (7.3% to 14.8%; P < .001).
Although parental vaccination intent and knowledge improved over time, intent remains low and many parents still have significant concerns about HPV vaccination, even after series initiation. Multiple strategies are needed to improve series initiation and completion in the United States.
Human papillomavirus (HPV) vaccine was recommended for routine administration to adolescent females in 2006 and to adolescent males in 2011 in the United States, yet vaccine uptake lags behind other recommended adolescent vaccines [1]. For example, in 2015, only 63% of females aged 13–17 years, and just 50% of males, had received at least 1 dose of HPV vaccine compared with overall coverage of 86% for the tetanus booster (Tdap) vaccine and 81% for the meningococcal ACWY vaccine [2]. Although HPV vaccine uptake has increased over the past decade, series completion rates are still far below the Healthy People 2020 goal of 80%, at 42% among females and 28% among males in 2015 [2, 3].
Despite evidence that HPV vaccines are safe and effective [1, 4–7], and extensive efforts to effectively communicate the value of HPV vaccines [8, 9], parental concerns about HPV vaccination contribute to their delay or refusal to vaccinate their children [10, 11]. Questions remain about whether and to what degree parental vaccination intentions and reasons for HPV vaccine hesitancy have changed over time. Little research has examined the differences between parents of adolescent females and males or between parents of adolescents who are unvaccinated and undervaccinated (ie, those who have initiated, but not yet completed the series). Understanding how vaccination intent and reasons for hesitancy have changed over time can inform healthcare providers’ and public health practitioners’ understanding of the impact of efforts to improve HPV vaccine uptake, why a large proportion of teens remain unvaccinated or undervaccinated against HPV, and how best to tailor messaging to address the changing landscape of concerns going forward. Thus, we aimed to (1) characterize parents’ vaccination intentions and assess the degree to which parental intentions have changed over time; (2) identify the most common reasons for vaccine hesitancy among parents with low intent to vaccinate and assess changes in reported reasons over time; and (3) investigate differences in parental attitudes and concerns between parents of adolescent females and males for both unvaccinated and undervaccinated teens.
METHODS
Data Source
We analyzed the National Immunization Survey–Teen (NIS-Teen) public use data for the 6 surveys conducted between 2010 and 2015 [12–17]. NIS-Teen is an annual cross-sectional survey of parents of noninstitutionalized, US-resident adolescents aged 13–17 years sponsored by the Centers for Disease Control and Prevention. The primary aim of NIS-Teen is to ascertain nationally representative vaccination coverage rates for recommended adolescent vaccines. NIS-Teen also collects data to understand parental knowledge about, intent to receive, and attitudes toward vaccination. Random-digit dialing is used to identify eligible households. Data are collected using phone interviews and linked provider reports to verify vaccination history, weighted to account for the complex sampling design and response rates, and stratified by geographic area of residence. Detailed methods have been published elsewhere [18, 19]. The University of Minnesota Institutional Review Board deemed this research exempt from review.
Participants
Eligible participants included teens whose parents responded to one of the 2010–2015 NIS-Teen surveys and had healthcare-provider confirmed HPV vaccination status (ie, adequate provider data), had not yet completed the HPV vaccination series (ie, received <3 recommended doses), and were residents of one of the 50 US states or Washington, D.C. (Figure 1). Our analysis of parental vaccination intent included all eligible teens except those for whom there was no response to the vaccination intent question. Our analysis of parental reasons for vaccine hesitancy included those whose parents reported low vaccination intent and provided a primary reason for hesitancy.
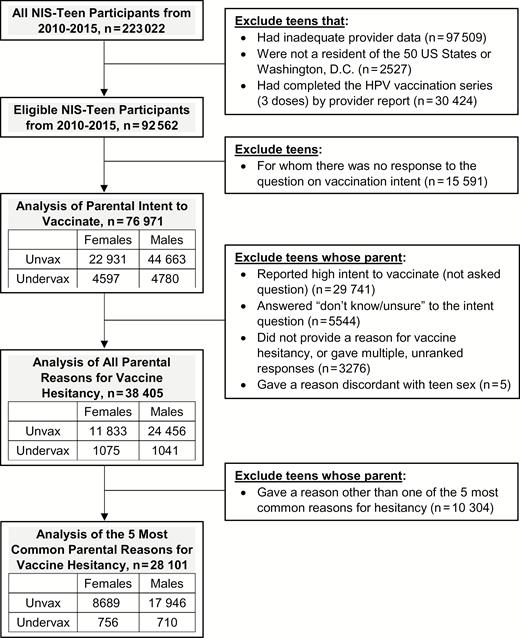
Flow diagram of exclusion criteria and sample sizes by human papillomavirus vaccination status and teen sex. Abbreviations: HPV, human papillomavirus; NIS-Teen, National Immunization Survey–Teen; Undervax, undervaccinated; Unvax, unvaccinated.
Measures
HPV Vaccination Status
HPV vaccination status was determined by healthcare provider documentation. Teens were categorized as unvaccinated if they had not received any HPV vaccine (0 doses) and undervaccinated if they had received 1 or 2 doses of HPV vaccine. Note that during the period all 2010–2015 surveys were conducted, 3 doses were required for teens to be considered fully vaccinated per Advisory Committee on Immunization Practices (ACIP) recommendations [1, 20].
Parental Intent to Vaccinate
Parents who reported that their teen was unvaccinated or undervaccinated against HPV were asked: “How likely is it that [teen] will receive HPV shots in the next 12 months?” Response options included a 4-point Likert-type scale ranging from “very likely” to “not likely at all,” and “not sure/don’t know.” Parents who were “not too likely” and “not likely at all” were classified as expressing low intent, while parents who were “very likely” and “somewhat likely” were classified as expressing high intent.
Reasons for HPV Vaccine Hesitancy
Parents who expressed low or unknown intent to vaccinate their teens against HPV were asked an open-ended question: “What is the MAIN reason [teen] will not receive any HPV shots in the next 12 months?” NIS-Teen coded responses into 26 categories (Supplementary Table 1). Prior to 2012, parents were allowed to give multiple, unranked responses; this small subset of respondents (n = 1756) was excluded from analysis. When aggregating data across all survey years, the 5 most commonly reported parental reasons for vaccine hesitancy were, in rank order, “not needed/necessary,” “not recommended,” “[teen] not sexually active,” “lack of knowledge,” and “safety concerns/side effects.” Each of these reasons accounted for at least 10% of responses, and together represented 73.4% of responses; none of the other 21 reasons accounted for more than 5% of responses (Supplementary Table 1).
Sociodemographic Factors
To account for potential confounding factors identified in previous studies [21], models were adjusted for the following variables categorized as shown in Table 1: teen age in years at interview, teen race/ethnicity, household income, maternal education, teen history of being uninsured since age 11, and US census region.
Participant Characteristics
| Characteristic | Intent Analysis (n = 76971) | Reason Analysis (n = 28101)a | ||||||
|---|---|---|---|---|---|---|---|---|
| Unvaccinated | Undervaccinatedb | Unvaccinated | Undervaccinatedb | |||||
| Females | Males | Females | Males | Females | Males | Females | Males | |
| Total sample size | (n = 22931) | (n = 44663) | (n = 4597) | (n = 4780) | (n = 8689) | (n = 17946) | (n = 756) | (n = 710) |
| Participant characteristics | No. (Wgt %)c | No. (Wgt %)c | No. (Wgt %)c | No. (Wgt %)c | No. (Wgt %)c | No. (Wgt %)c | No. (Wgt %)c | No. (Wgt %)c |
| NIS-Teen survey year | ||||||||
| 2010 | 4217 (19.7) | 9671 (23.1) | 270 (8.0) | 44 (0.8) | 1651 (20.8) | 4087 (23.9) | 62 (7.5) | 10 (1.8) |
| 2011 | 4804 (17.8) | 10906 (21.3) | 342 (7.3) | 213 (5.5) | 1794 (18.7) | 4398 (21.0) | 77 (8.0) | 48 (8.1) |
| 2012 | 3599 (17.0) | 7312 (17.1) | 375 (10.7) | 357 (9.7) | 1454 (17.7) | 3050 (17.7) | 95 (14.5) | 87 (12.0) |
| 2013 | 3183 (15.5) | 5714 (13.9) | 373 (10.3) | 462 (12.3) | 1202 (15.2) | 2178 (13.6) | 79 (13.7) | 79 (12.3) |
| 2014 | 3679 (15.6) | 5887 (13.1) | 1505 (31.9) | 1756 (34.8) | 1352 (14.5) | 2252 (12.7) | 191 (23.1) | 230 (33.0) |
| 2015 | 3449 (14.4) | 5173 (11.4) | 1732 (31.9) | 1948 (36.9) | 1236 (13.2) | 1981 (11.1) | 252 (33.1) | 256 (32.9) |
| Teen age at interview, y | ||||||||
| 13 | 5848 (24.4) | 9277 (20.1) | 1179 (24.7) | 1147 (22.0) | 2057 (22.3) | 3510 (19.0) | 149 (21.7) | 163 (19.7) |
| 14 | 5173 (21.3) | 9247 (20.2) | 1062 (21.2) | 1069 (21.3) | 1896 (20.7) | 3605 (19.6) | 156 (17.5) | 149 (18.9) |
| 15 | 4426 (20.3) | 8917 (20.2) | 865 (18.8) | 941 (20.8) | 1702 (19.9) | 3630 (20.2) | 161 (23.9) | 155 (20.5) |
| 16 | 4074 (18.6) | 8993 (20.5) | 822 (19.3) | 874 (19.3) | 1658 (19.9) | 3766 (20.9) | 170 (22.9) | 124 (18.0) |
| 17 | 3410 (15.4) | 8229 (19.1) | 669 (15.9) | 749 (16.7) | 1376 (17.1) | 3435 (20.2) | 120 (14.0) | 119 (22.9) |
| Teen race/ethnicity | ||||||||
| Non-Hispanic white | 16066 (61.7) | 31435 (61.0) | 2407 (43.4) | 2436 (42.5) | 6335 (66.6) | 13528 (67.8) | 431 (56.4) | 381 (44.4) |
| Hispanic | 2738 (16.6) | 5514 (17.7) | 1001 (28.1) | 1158 (30.5) | 867 (12.7) | 1619 (12.4) | 127 (16.8) | 134 (25.7) |
| Non-Hispanic black | 2143 (13.2) | 3938 (13.1) | 648 (18.9) | 636 (17.7) | 767 (12.3) | 1394 (11.8) | 106 (18.7) | 105 (19.4) |
| Other/multiracial | 1984 (8.6) | 3776 (8.2) | 541 (9.7) | 550 (9.3) | 720 (8.4) | 1405 (8.0) | 92 (8.1) | 90 (10.5) |
| Household incomed | ||||||||
| <100% FPL | 2750 (17.0) | 5735 (17.8) | 1174 (30.8) | 1228 (31.2) | 837 (12.8) | 1633 (12.6) | 179 (24.3) | 163 (31.0) |
| 100%–199% FPL | 3951 (19.6) | 7390 (19.2) | 860 (20.3) | 922 (21.5) | 1529 (19.4) | 2891 (18.4) | 158 (20.7) | 146 (23.5) |
| 200%–299% FPL | 3853 (15.8) | 6996 (15.1) | 584 (10.5) | 558 (10.4) | 1604 (18.0) | 3103 (17.3) | 116 (15.2) | 95 (10.0) |
| ≥300% FPL | 11075 (40.2) | 21933 (40.4) | 1717 (28.6) | 1816 (30.4) | 4198 (42.3) | 9304 (44.7) | 264 (32.9) | 270 (30.0) |
| Don’t know/missing | 1302 (7.3) | 2609 (7.5) | 262 (9.8) | 256 (6.5) | 521 (7.6) | 1015 (7.0) | 39 (6.9) | 36 (5.5) |
| Maternal education | ||||||||
| Less than high school | 1822 (9.9) | 3780 (11.0) | 800 (22.4) | 848 (20.2) | 499 (6.7) | 980 (6.2) | 102 (12.2) | 107 (16.8) |
| High school graduate | 4091 (23.4) | 8313 (25.1) | 977 (27.8) | 879 (24.1) | 1479 (21.7) | 3198 (23.9) | 169 (26.6) | 153 (27.2) |
| Some college | 6757 (28.5) | 12725 (26.7) | 1172 (22.3) | 1220 (23.9) | 2793 (31.9) | 5276 (28.3) | 234 (27.9) | 202 (28.8) |
| College graduate or more | 10261 (38.2) | 19845 (37.3) | 1648 (27.5) | 1833 (31.8) | 3918 (39.7) | 8492 (41.6) | 251 (33.3) | 248 (27.2) |
| History of being uninsured since age 11 | ||||||||
| Yes | 1615 (8.2) | 2905 (7.6) | 363 (9.7) | 361 (7.3) | 569 (8.0) | 1169 (7.8) | 59 (8.4) | 59 (8.6) |
| No | 19660 (82.3) | 38881 (84.4) | 3829 (78.8) | 4066 (83.0) | 7548 (84.2) | 15773 (86.1) | 644 (82.8) | 608 (77.1) |
| Don’t know/missing | 1656 (9.4) | 2877 (8.0) | 405 (11.5) | 353 (9.7) | 572 (7.9) | 1004 (6.1) | 53 (8.7) | 43 (14.2) |
| US census region | ||||||||
| Midwest | 5336 (23.2) | 10106 (23.0) | 944 (20.3) | 924 (19.7) | 2109 (25.0) | 4341 (24.7) | 157 (22.0) | 138 (18.4) |
| Northeast | 3903 (16.3) | 7957 (16.3) | 776 (13.7) | 1013 (16.0) | 1374 (15.8) | 3004 (15.8) | 103 (11.3) | 116 (13.5) |
| South | 8623 (40.2) | 16303 (38.2) | 1743 (38.3) | 1755 (36.7) | 3161 (39.5) | 6232 (37.9) | 290 (40.5) | 281 (43.0) |
| West | 5069 (20.2) | 10297 (22.5) | 1134 (27.7) | 1088 (27.5) | 2045 (19.7) | 4369 (21.7) | 206 (26.2) | 175 (25.1) |
Abbreviations: FPL, federal poverty level; NIS-Teen, National Immunization Survey–Teen; No., unweighted frequency; Wgt %, weighted percentage.
aSample is a subset of those included in the intent analysis.
bUndervaccinated indicates teens who had initiated human papillomavirus vaccination but had not yet received all 3 doses.
cDue to rounding, column percentages may not sum to exactly 100.0% for a particular variable.
dHousehold income was derived from the continuous income-to-poverty ratio variable included in the original datasets.
Statistical Analyses
We fit multinomial logistic regression models for both outcomes (parental intent and parental reason), separately by teen sex and HPV vaccination status, adjusting for multiple sociodemographic factors. We used marginal standardization to estimate weighted, adjusted, predicted percentages for categories of parental intent and the 5 most common reasons for parental hesitancy by teen sex and vaccination status strata [22]. We used the delta method to estimate 95% confidence intervals (CIs) and to assess whether changes in the weighted, adjusted, predicted percentages between 2010 and 2015 for parents of females and between 2012 and 2015 for parents of males (corresponding to the years during which HPV vaccination was recommended for routine administration for males) were significant. We used the same approach to determine whether the model-based estimates from 2015 significantly differed between parents of males and females. All hypothesis tests were 2-sided, with an a priori significance level of P < .05. SAS version 9.4 software (SAS Institute, Cary, North Carolina) was used for data management and crude estimation of weighted percentages. Multivariable models and hypothesis tests were run using Stata version 14 software (StataCorp, College Station, Texas). Figures were generated using R version 3.4.1 software (R Foundation for Statistical Computing, Vienna, Austria).
RESULTS
Participant Characteristics
Of the 76971 teens who were eligible for the parental intent analysis, 63.0% were male, 58.8% were non-Hispanic white, 86.7% had not received any doses of HPV vaccine, and their median age was 14.4 years. Of the subset of 28101 teens who were eligible for the reasons analysis (ie, whose parent had low intent to vaccinate and reported 1 of the 5 most common reasons for hesitancy), the teens were 65.1% male, 66.4% non-Hispanic white, 94.2% unvaccinated, and had a median age of 14.5 years. Additional demographic characteristics are shown in Table 1 for each analysis, by teen sex and HPV vaccination status.
Among unvaccinated and undervaccinated teens who were eligible for the intent analysis, the percentage of unvaccinated teens decreased between 2010 and 2015, from 91.7% to 66.9% among females and from 99.6% to 72.7% among males. In each year, a larger percentage of males were unvaccinated compared with females.
Analyses Among Parents of Unvaccinated Teens
Vaccination Intent
In each year, the percentage of parents of unvaccinated teens reporting that they were “not likely at all” to vaccinate their teen against HPV was significantly higher than any other reported level of intent (Figure 2). Between 2010 and 2015, there was a significant decrease in the percentage of parents of females who were “not likely at all” to vaccinate (from 41.5% to 31.2%; 10.3 percentage point decrease [95% CI for the difference, –13.9 to –6.6]), and a significant increase in those “somewhat likely” to vaccinate their teens (from 16.3% to 22.0%; 5.7 percentage point increase [95% CI, 2.7–8.7]) (Table 2). Between 2012 and 2015, there were no statistically significant changes in parental intent to vaccinate among parents of males (Table 2). In 2015, parents of females (vs males) were significantly more likely to report that their teen was “very likely” to be vaccinated (3.5 percentage point difference [95% CI, .1–6.8]), and parents of males (vs females) were significantly more likely to report that their teen was “not too likely” to be vaccinated (4.4 percentage point difference [95% CI, 1.2–7.6]) (Table 3).
Comparison of Changes in Parental Intent to Vaccinate and Reasons for Hesitancy Among Parents of Females (2010 Versus 2015) and Parents of Males (2012 Versus 2015)
| Intent/Reason | Unvaccinated | Undervaccinated | ||||||||||
|---|---|---|---|---|---|---|---|---|---|---|---|---|
| Females | Males | Females | Males | |||||||||
| Diffa | (95% CIb) | P Valueb | Diffa | (95% CIb) | P Valueb | Diffa | (95% CIb) | P Valueb | Diffa | (95% CIb) | P Valueb | |
| Parental intent to vaccinate | ||||||||||||
| Very likely | 2.9 | (–.2 to 6.0) | .07 | 1.3 | (–1.4 to 3.9) | .35 | 12.8 | (1.2–24.4) | .03 | 11.9 | (2.7–21.1) | .01 |
| Somewhat likely | 5.7 | (2.7–8.7) | <.001 | 0.7 | (–2.1 to 3.4) | .64 | –1.9 | (–12.6 to 8.8) | .73 | –7.8 | (–17.1 to 1.4) | .10 |
| Not too likely | 0.6 | (–2.5 to 3.7) | .71 | 0.0 | (–2.8 to 2.8) | >.99 | –1.1 | (–7.1 to 4.8) | .71 | –4.3 | (–12.0 to 3.5) | .28 |
| Not likely at all | –10.3 | (–13.9 to –6.6) | <.001 | –0.9 | (–3.8 to 1.9) | .52 | –2.7 | (–10.2 to 4.8) | .48 | 2.5 | (–4.3 to 9.3) | .47 |
| Not sure/don’t know | 1.2 | (–3.1 to 2.0) | .39 | –1.0 | (–2.8 to .8) | .28 | –7.1 | (–15.0 to .8) | .08 | –2.3 | (–7.9 to 3.4) | .43 |
| Parental reason for vaccine hesitancy | ||||||||||||
| Not recommended | 1.8 | (–1.6 to 5.3) | .30 | –6.3 | (–10.7 to –1.9) | .005 | 9.1 | (–3.1 to 21.3) | .14 | –10.7 | (–30.8 to 9.4) | .30 |
| Not needed/necessary | 6.9 | (1.1–12.6) | .02 | 1.0 | (–3.9 to 5.8) | .70 | 10.9 | (–5.7 to 27.5) | .20 | 2.1 | (–18.1 to 22.3) | .84 |
| Lack of knowledge | 2.1 | (–2.1 to 6.3) | .32 | –3.8 | (–7.4 to –.1) | .04 | –6.3 | (–24.0 to 11.4) | .49 | 2.8 | (–10.7 to 16.2) | .68 |
| Not sexually active | –1.6 | (–6.9 to 3.7) | .56 | 1.7 | (–1.6 to 4.9) | .32 | –21.5 | (–37.2 to –5.7) | .008 | 3.0 | (–4.8 to 10.9) | .45 |
| Safety concerns/side effects | –9.2 | (–14.6 to –3.9) | <.001 | 7.5 | (4.5–10.5) | <.001 | 7.8 | (–5.7 to 21.2) | .26 | 2.7 | (–12.2 to 17.7) | .72 |
Abbreviations: CI, confidence interval; Diff, percentage point difference for 2010 vs 2015 (females) and 2012 vs 2015 (males).
aPercentage point differences predicted using multinomial logistic regression and marginal standardization; weighted using National Immunization Survey–Teen provider-phase weights; adjusted for categorical teen age in years, race/ethnicity, household income, maternal education, history of being uninsured, and US census region; positive values indicate that 2015 values were larger than 2010 or 2012 values, and negative values indicate that 2010 or 2012 values were larger than 2015 values.
bConfidence intervals and P values derived using the delta method.
Comparison of Parental Intent to Vaccinate and Reasons for Hesitancy Between Parents of Females and Parents of Males in 2015
| Intent/Reason | Unvaccinated | Undervaccinated | ||||
|---|---|---|---|---|---|---|
| Diffa | (95% CIb) | P Valueb | Diffa | (95% CIb) | P Valueb | |
| Parental intent to vaccinate | ||||||
| Very likely | 3.5 | (.1–6.8) | .04 | 3.3 | (–2.8 to 9.3) | .29 |
| Somewhat likely | 0.3 | (–2.9 to 3.5) | .86 | 1.9 | (–4.0 to 7.8) | .52 |
| Not too likely | –4.4 | (–7.6 to –1.2) | .007 | –1.5 | (–5.7 to 2.6) | .48 |
| Not likely at all | 0.1 | (–3.3 to 3.5) | .94 | –2.0 | (–6.8 to 2.7) | .40 |
| Not sure/don’t know | 0.5 | (–2.0 to 3.1) | .67 | –1.7 | (–4.7 to 1.3) | .27 |
| Parental reason for vaccine hesitancy | ||||||
| Not recommended | –11.3 | (–15.6 to –7.0) | <.001 | –8.2 | (–19.7 to 3.3) | .16 |
| Not needed/necessary | 0.2 | (–5.6 to 6.0) | .95 | 6.4 | (–6.3 to 19.2) | .32 |
| Lack of knowledge | –2.4 | (–6.6 to 1.8) | .26 | –7.0 | (–15.9 to 2.0) | .13 |
| Not sexually active | 7.2 | (2.4–12.0) | .003 | –0.9 | (–7.9 to 6.0) | .79 |
| Safety concerns/side effects | 6.3 | (2.1–10.5) | .003 | 9.7 | (–.5 to 19.8) | .06 |
Abbreviations: CI, confidence interval; Diff, difference.
aPercentage point differences predicted using multinomial logistic regression and marginal standardization; weighted using National Immunization Survey–Teen provider-phase weights; adjusted for categorical teen age in years, race/ethnicity, household income, maternal education, history of being uninsured, and US census region; positive values indicate that 2015 values were larger among parents of females, and negative values indicate that 2015 values were larger among parents of males.
bConfidence intervals and P values derived using the delta method.
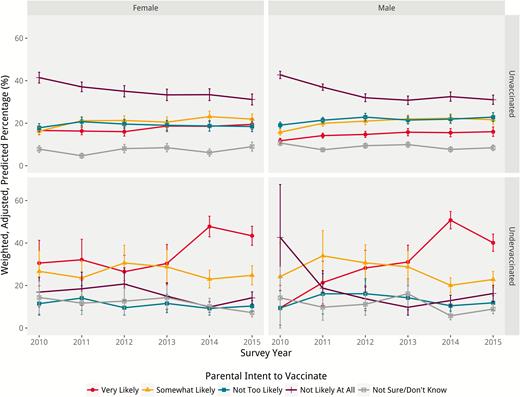
Parental intent to vaccinate, 2010–2015. Weighted, adjusted, predicted percentages and 95% confidence intervals by teen sex and human papillomavirus (HPV) vaccination status. For males, 2010–2011 surveys were before HPV vaccination was routinely recommended.
Reasons for Hesitancy
Among parents of both male and female unvaccinated teens, the most prevalent reason for HPV vaccine hesitancy in 5 of the 6 years analyzed was due to the belief that the vaccine was not needed or necessary, including in 2015 (Figure 3). The percentage of parents of females citing this reason significantly increased from 25.8% in 2010 to 32.7% in 2015 (6.9 percentage point increase [95% CI, 1.1–12.6]) (Table 2). While “safety concerns/side effects” was the first (2010) or second (2011–2015) most prevalent reason for vaccine hesitancy among parents of females, the percentage citing this reason significantly decreased from 30.3% to 21.1% from 2010 to 2015 (9.2 percentage point decrease [95% CI, –14.6 to –3.9]) (Figure 3 and Table 2). The percentage of parents of males reporting “safety concerns/side effects” as their main reason significantly increased from 7.3% to 14.8% between 2012 and 2015 (7.5 percentage point increase [95% CI, 4.5–10.5]) (Figure 3 and Table 2). Of note, parents of males were significantly less likely to cite a lack of provider recommendation or a “lack of knowledge” as their primary reason for hesitancy over the time period examined (Table 2). Parents of females were significantly less likely to cite a lack of a provider recommendation as their primary reason and significantly more likely to report that that their teen was “not sexually active” or that they had safety concerns than parents of males (Table 3). Weighted percentages for all 26 reasons for hesitancy among parents of unvaccinated teens are included in Supplementary Table 2.
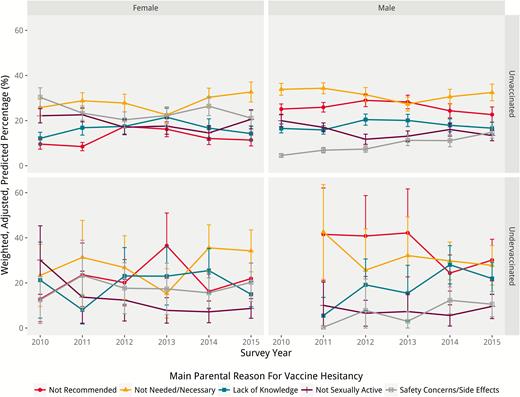
Parental reasons for vaccine hesitancy, 2010–2015. Weighted, adjusted, predicted percentages and 95% confidence intervals by teen sex and human papillomavirus (HPV) vaccination status. For males, 2010–2011 surveys were before HPV vaccination was routinely recommended; values for undervaccinated males in 2010 were inestimable given sparse data.
Analyses Among Parents of Undervaccinated Teens
Vaccination Intent
Parents of undervaccinated females most commonly reported that they were “very likely” to vaccinate their teens in all years except 2012, when “somewhat likely” was more prevalent (Figure 2). Among undervaccinated males, parents were most likely to report that they were “very likely” to vaccinate their teen between 2013 and 2015, “somewhat likely” in 2011 and 2012, and “not likely at all” in 2010. Over time, the percentage of parents that were “very likely” to vaccinate significantly increased, from 30.6% to 43.4% for females (12.8 percentage point increase [95% CI, 1.2–24.4]) and from 28.2% to 40.1% for males (11.9 percentage point increase [95% CI, 2.7–21.1]) (Table 2). There were no statistically significant differences in vaccination intent between parents of undervaccinated males vs females in 2015 (Table 3).
Reasons for Hesitancy
Among parents of undervaccinated teens, for both males and females, the most prevalent reason for hesitancy varied over time without a consistent pattern (Figure 3). In 2015, the 2 most commonly reported reasons for parents of either sex were that the HPV vaccine was “not needed/necessary” or that it was “not recommended,” though the CIs for these and other reasons overlapped. The proportion of parents of undervaccinated females reporting that their teen was “not sexually active” as their main reason for vaccine hesitancy decreased significantly between 2010 and 2015, dropping from 30.1% in 2010 to 8.7% in 2015 (21.5 percentage point decrease [95% CI, –37.2 to –5.7]) (Table 2). There were no statistically significant differences in reasons for hesitancy between parents of undervaccinated males vs females in 2015 (Table 3). Weighted percentages for all 26 reasons for hesitancy among parents of undervaccinated teens are shown in Supplementary Table 3.
DISCUSSION
Understanding changes in parents’ HPV vaccination intentions and reasons for hesitancy is key to assessing the impact vaccine uptake interventions have had and providing evidence for the design of future interventions to increase uptake. In our analysis of multiple years of a large, nationally representative survey, we found that among teens who had not completed the 3-dose HPV vaccination series (as recommended for all teens at the time of the surveys), the majority remained completely unvaccinated, though the percentage that had initiated but not completed the vaccination series increased from 2010 to 2015. Of particular concern is that a large proportion of parents of unvaccinated teens reported that they were “not likely at all” to vaccinate their teen against HPV in the future. While this response declined significantly over time among parents of females, it remained the most common response across all years for both males and females, suggesting that, despite national recommendations, many parents are not likely to initiate the HPV vaccine series without additional intervention. Parental intent, however, was somewhat higher among parents of unvaccinated females than among males, with a statistically higher percentage of parents of females (vs males) reporting they were “very likely” to vaccinate.
Several of the most prevalent parental reasons for HPV vaccine hesitancy identified in this study are similar to those described in previous studies [23–27]. However, our analysis presents the most comprehensive and nuanced longitudinal assessment to date. By quantifying how and the degree to which reasons for hesitancy have varied over time for both parents of unvaccinated and undervaccinated teens and by teen sex, we present evidence directly relevant to understanding how best to increase intent to vaccinate and to improve HPV vaccine uptake among these groups. Among unvaccinated teens, the belief that the vaccine was not needed was the most often reported reason for parental hesitancy in most years analyzed, and the percentage of parents of unvaccinated females citing this specific reason significantly increased over time. This finding suggests that parental misconceptions about the importance of vaccination against HPV persist and are not adequately addressed by ongoing efforts. We noted 2 parallel trends among reasons for not vaccinating males, a decrease in the percentage of parents citing a lack of a provider recommendation, and a decrease for “lack of knowledge.” These changes are likely due largely to greater parental awareness of HPV recommendations and benefits for males. However, consistent with previous research, we also found that parents of unvaccinated females reported a lack of a provider recommendation much less frequently than parents of unvaccinated males, suggesting that providers continue to more consistently make recommendations to females than males, even in 2015—4 years after the ACIP recommendation [9, 28]. Parents of unvaccinated females more commonly voiced concerns about vaccine safety and side effects and a perceived lack of need due to their teen not being sexually active, and concerns about safety significantly increased among parents of males over time, offering opportunities to address these concerns.
Our study is the first to report changes in reasons for vaccine hesitancy among parents of undervaccinated teens. Interestingly, the most commonly reported reasons among these parents were similar to those seen among parents of unvaccinated teens. While previous research finds that follow-up counseling among parents who have declined HPV vaccine is associated with secondary acceptance [29], our findings highlight the additional importance of follow-up HPV vaccination counseling with parents even after initiation, as these parents may still have concerns that should be addressed to support vaccination series completion. Of particular note is that a substantial proportion of parents cited HPV vaccine not being recommended as their main reason for hesitancy. This could reflect gaps in knowledge about vaccination recommendations and logistics, as others have found that the number and timing of doses are often missing components in provider–parent HPV vaccination discussions [9]. Proactively discussing HPV vaccination with parents after initiation [30], providing reminders by mail, phone, and electronically, scheduling visits for subsequent doses at the time of series initiation [30, 31], and reducing missed opportunities to administer HPV vaccine during other types of healthcare visits (eg, acute care) [32] could reduce parental hesitancy and emphasize that additional doses are recommended, thus increasing series completion. The change in 2016 from a 3-dose to 2-dose HPV vaccine recommendation for adolescents <15 years of age will also help with these efforts [20].
We analyzed a large, robust, nationally representative survey that combined individual parental reports with documented vaccination status. Our study was limited, however, in that NIS-Teen only assesses reasons for vaccine hesitancy among parents with low intent to vaccinate, and thus findings may not be generalizable to parents with high intent who may still have concerns that impede series initiation or continuation. In addition, we focused our analysis on the 5 most common reasons for parental hesitancy, though future interventions may need to consider a wider range of reasons to develop comprehensive interventions to address concerns. Because parents identified a single reason for hesitancy, we were only able to consider parents’ self-reported primary reason, though secondary reasons may also contribute to individual decisions. Future studies should investigate the relative contribution of multiple concerns in HPV vaccine decision making.
CONCLUSIONS
We demonstrate that parental intent to initiate HPV vaccination for their adolescents remains low and, despite improvements in coverage over time, some parents still have significant—yet largely addressable—concerns about HPV vaccination. Our results suggest that parental attitudes may be a larger barrier to HPV vaccination initiation than to series completion, and that different interventions are needed to address both. Many of the common reasons for hesitancy that parents report have persisted over time and reflect modifiable factors that can be addressed [33]. Strong, quality provider recommendations are critical for series initiation [9, 34], but should be paired with additional strategies such as follow-up counseling and reminder/recall systems to bolster series completion [29–31]. Additionally, messages to parents should convey the importance of vaccination, including the benefits of on-time vaccination at the recommended age and of series completion, to best protect adolescents from HPV-related cancers.
Supplementary Data
Supplementary materials are available at Clinical Infectious Diseases online. Consisting of data provided by the authors to benefit the reader, the posted materials are not copyedited and are the sole responsibility of the authors, so questions or comments should be addressed to the corresponding author.
Notes
Acknowledgments. We thank Andrew B. Becker for the design of Figures 2 and 3.
Financial support. This work was supported by the University of Minnesota Grand Challenges Research Grant; the National Institutes of Health (grant number DP5 OD009162); the Centers for Disease Control and Prevention (grant number U48 DP000063), and the Minnesota Population Center (grant number P2C HD041023) through a grant from the Eunice Kennedy Shriver National Institute for Child Health and Human Development (NICHD).
Potential conflicts of interest. All authors: No reported conflicts of interest. All authors have submitted the ICMJE Form for Disclosure of Potential Conflicts of Interest. Conflicts that the editors consider relevant to the content of the manuscript have been disclosed.


Comments