


Background: The aim of this study was to investigate specific bleeding volume after percutaneous renal biopsy (PRB) and the correlation between bleeding volume and clinical parameters.
Methods: A retrospective study of 252 consecutive patients (153 male patients and 99 female patients) who underwent PRB at the Department of Nephrology, Japanese Red Cross Ishinomaki Hospital, between July 2013 and January 2016 was conducted. PRB was performed under ultrasound guidance using an automated spring-loaded biopsy device and a 16-cm, 16-gauge needle. Patients underwent computed tomography (CT) the day after PRB. Bleeding volume after PRB was evaluated using reconstructed CT data.
Results: The median bleeding volume after PRB was 38 mL (25th–75th percentile, 18–85 mL), with ≥4 punctures identified as a risk factor for massive bleeding. The incidence rates of macrohematuria, transient hypotension and bladder obstruction were 14.3, 8.7 and 4.7%, respectively. Post-PRB blood transfusion and intervention were required in 4.7 and 0.8% of patients, respectively.
Conclusion: Although it is difficult to assess the risk for massive bleeding prior to PRB, we do provide evidence of a specific increased risk with ≥4 puncture attempts, and recommend careful follow-up of these patients.
Introduction
Percutaneous renal biopsy (PRB) is indispensable for the diagnosis and management of renal diseases. However, PRB carries the risk for a number of complications. Among these, bleeding is the most common complication, which can range from asymptomatic bleeding to life-threatening bleeding [1]. Among patients who experience PRB-associated bleeding, <0.1% die, while 0.1–0.5% require nephrectomy or surgical hemostasis, 0.1–0.5% require invasive intervention, including arteriovenous fistulas, and 0.3–7.4% require blood transfusion. The majority of patients (10–90%) experience only an uncomplicated hematoma and 1–10% show transient macroscopic hematuria [2–4]. High blood pressure (BP), the gauge of the needle, sex, decreased glomerular filtration rate (GFR), low platelet count, anemia and the rate of hospitalization have been reported to be risk factors for bleeding after PRB [1]. Although the severity and frequency of bleeding complications associated with PRB have been previously reported [5, 6], the specific bleeding volume after PRB, as well as the correlation between bleeding volume and clinical parameters, have not been fully investigated.
There is no standard method to calculate bleeding volume after PRB. Although ultrasound imaging provides an easy and safe method to evaluate bleeding complications, its clinical application is limited by ‘blind’ spots produced the effects of tissue depth and density on ultrasound wave propagation and penetration, and the dependence of detecting bleeding on the skill and experience of the operator. To address these limitations, Ralls et al. proposed that computed tomography (CT) imaging could provide a more sensitive alternative to ultrasound for the detection of ‘bleeding’ after PRB [7]. Multidetector CT imaging has been effectively used in practice to predict post-nephrectomy renal function by providing a measure of the preserved volume of renal cortex [8]. In our study, we evaluated bleeding volume after PRB using reconstructed CT data and investigated the correlation between bleeding volume and clinical parameters.
Materials and methods
We conducted a retrospective study of 254 consecutive patients (155 males and 99 females) who underwent PRB at the Department of Nephrology of the Japanese Red Cross Ishinomaki Hospital, between July 2013 and January 2016. PRB was performed in cases with abnormal urinalysis results and with a definitive diagnosis of renal dysfunction. PRB was also performed in patients with a level of proteinuria >0.5 g/gCre, urinary red blood cells (RBC) >10–19/High Power Field (HPF), or identification of an RBC cast on urinary sediment. PRB was also indicated for patients with chronic kidney disease (CKD) with no obvious cause, having kidneys of normal size and no obstruction, as well as in those with unexplained acute renal failure.
Contraindications to PRB included an inability to provide informed consent, multiple bilateral cysts, uncorrected bleeding diathesis, uncontrolled hypertension, hydronephrosis, urinary tract infection, pyelonephritis, perirenal abscess or infection, horseshoe kidney, solitary or atrophy of a unilateral kidney, severe obesity [body mass index (BMI) ≥40 kg/m2] and an uncooperative patient. Two other patients were excluded owing to lack of CT data after PRB. Therefore, the data from 252 patients (153 males and 99 females) were included in the analysis.
The estimated circulating volume of blood was calculated using Ogawa’s method, with the formula adapted for a Japanese population as follows [9]: estimated circulating blood volume = <{0.168 × [height (m)]3} + [0.050 × weight (kg)] + 0.444> for males, and < {0.250 × [height (m)]3} + [0.0625 × weight (kg)] − 0.662> for females. The estimated GFR (eGFR) was used to evaluate kidney function, again using an estimation formula specific for Japanese patients [10]: eGFR (mL/min/1.73 m2) = 194 × serum creatinine−1.094 × age−0.287 (× 0.739 for females). Laboratory tests were performed within 1 week prior to PRB. Antiplatelet agents and anticoagulants were discontinued prior to the biopsy, according to the Japanese Circulation Society 2009 Guidelines for the Management of Anticoagulant and Antiplatelet Therapy in Cardiovascular Disease [11].
For the PRB procedure, if the systolic BP was >160 mmHg before puncture, the calcium channel blocker nicardipine was administered intravenously, at a concentration of 0.1 mg/mL, until the systolic BP was lowered to ≤160 mmHg. PRB was performed under ultrasound guidance, using an automated, spring-loaded biopsy device and a 16-cm, 16-gauge needle (Tru-Core II, Angiotech Pharmaceuticals Inc., Gainesville, FL, USA). The procedures were performed according to our hospital’s guidelines and previously reported recommendations [12]. Following the PRB, patients rested in hospital overnight, with frequent monitoring of BP, pulse rate, urine volume and body temperature. Blood tests and CT imaging were performed in the morning following the PRB.
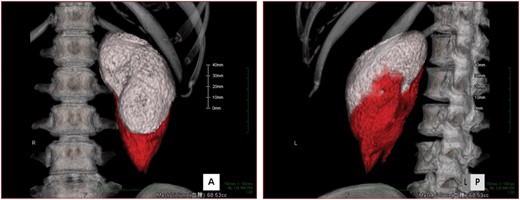
Calculation of the renal volume and bleeding volume after biopsy. The renal area (white) and bleeding area (red) are shown in 3D volume rendering in (A) frontal view and (B) left-posterior view.
Informed consent was obtained from all participants. This study was approved by the Ethical Committee of Japanese Red Cross Ishinomaki Hospital (approval no. 14-22).
Statistical analysis
Normally distributed data are presented as the mean ± standard deviation (SD), with nonparametric data presented as the median and 25th–75th percentile. Statistical analyses were performed using the t-test for parametric data and Mann–Whitney test for nonparametric data. P < 0.05 was regarded as significant. All statistical analyses were performed using EZR (Saitama Medical Center, Jichi Medical University, Saitama, Japan), which is a graphical user interface for R (The R Foundation for Statistical Computing, Vienna, Austria), with modification to include statistical functions frequently used in biostatistics [13].
Results
Relevant characteristics of the patients forming our study group are presented in Table 1. The mean age of the patients was 62 ± 17 years (range 15–91 years) and the mean BMI 24.8 ± 4.2 kg/m2 (range 14.5–39.2 kg/m2). The mean estimated circulating blood volume was 3840 ± 745 mL (range 1732–6027 mL). Systolic BP, diastolic BP and heart rate (HR) were measured immediately after waking in the morning. The mean systolic BP was 139 ± 25 mmHg, diastolic BP was 78 ± 14 mmHg and HR was 71 ± 12 beats/min. The mean eGFR was 44 mL/min/1.73 m2 (25th–75th percentile, 25–60 mL/min/1.73 m2). The hemoglobin level prior to PRB was 12.3 ± 2.4 g/dL, with a platelet count of 25.2 ± 10.5/μL, a prothrombin time of 101% (25th–75th percentile, 89–116%) and activated partial thromboplastin time was 30 s (25th–75th percentile, 27–34 s). Among the 252 patients, 41 patients were on antiplatelet therapy and 26 were on anticoagulant therapy.
Patient characteristics
| Characteristic | Value |
|---|---|
| Number of patients | 252 |
| Background information | |
| Age (years) | 62 ± 17 |
| Male sex (%) | 153 (61) |
| BMI (kg/m2) | 24.8 ± 4.2 |
| Estimated circulation blood volume (mL) | 3840 ± 745 |
| Systolic BP (mmHg) | 139 ± 25 |
| Diastolic BP (mmHg) | 78 ± 14 |
| Heart rate (bpm) | 71 ± 12 |
| eGFR (mL/min/1.73 m2) | 44 (25–60) |
| Hb before RBx (g/dL) | 12.3 ± 2.4 |
| Plt (×104/µL) | 24.1 (19–30) |
| PT (%) | 101 (89–116) |
| APTT (s) | 30 (27–34) |
| Antiplatelet therapy | 41 (16) |
| Anticoagulant therapy | 26 (10) |
| Parameter during PRB | |
| Use of nicardipine (%) | 74 (29) |
| Number of punctures | 3 (3–4) |
| Average systolic BP during PRB (mmHg) | 141 ± 18 |
Data are presented as mean ± standard deviation, number (percentage) or median (25th–75th percentile); BMI, body mass index; BP, blood pressure; eGFR, estimated glomerular filtration rate; RBx, renal biopsy; Hb, hemoglobin; PT, prothrombin time; APTT, activated partial thromboplastin time; Plt, platelet; PRB, percutaneous renal biopsy.
We used nicardipine to control BP during PRB in 74 patients. On average, 3.0 (25th–75th percentile, 3.0–4.0) punctures were performed. The average BP during PRB was 141 ± 18 mmHg.
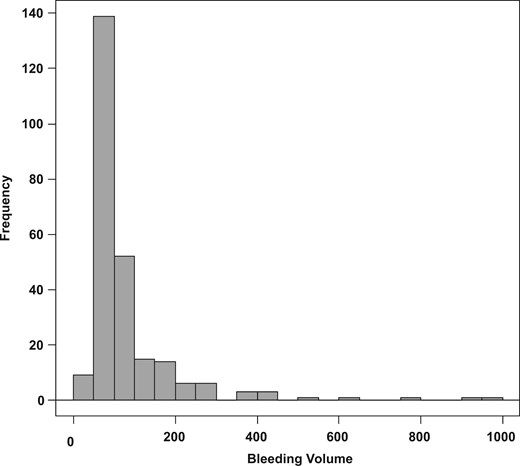
Distribution of the bleeding volume.
Details of bleeding complications
| Value | |
|---|---|
| Bleeding volume (mL) | 38 (18–85) |
| Percentage of bleeding volume per estimated circulating blood volume (%) | 1.1 (0.4–2.2) |
| Kidney volume (mL) | 157 (130–191) |
| Height-adjusted kidney volume (mL/m) | 99 (83–112) |
| Change of hemoglobin (g/dL) | −0.4 ± 0.9 |
| Complications | |
| Macrohematuria (%) | 36 (14.3) |
| Transient hypotension (%) | 22 (8.7) |
| Blood transfusion within 1 week from biopsy (%) | 12 (4.7) |
| Bladder obstruction (%) | 4 (1.6) |
| Intervention (%) | 2 (0.8) |
Data are presented as mean ± standard deviation, median (25th–75th percentile) or number (percentage).
Histological diagnoses among the patients forming the study group
| Hypertensive nephrosclerosis | 49 |
| Diabetic nephropathy | 41 |
| IgA nephropathy | 35 |
| Focal segmental glomerulosclerosis | 24 |
| Minimal change nephrotic syndrome | 15 |
| Crescentic Glomerulonephritis (GN) | 15 |
| Tubulointerstitial nephritis | 15 |
| Membranous nephropathy | 11 |
| Membranoproliferative GN | 6 |
| Mesangial proliferative GN (non-IgA type) | 5 |
| Lupus nephritis | 2 |
| Purpura nephritis | 2 |
| Endocapillary GN | 1 |
| Amyloidosis | 1 |
| Others | 30 |
Patients were classified into three groups based on bleeding volume, with patients in the first tertile classified as the ‘high’ bleeding volume group, those in the second tertile as the ‘medium’ bleeding volume group and those in the third tertile as the ‘low’ bleeding volume group. Between-group differences in patient characteristics, with the exception of the number of punctures performed and the use of nicardipine, were evaluated (Table 4). Episodes of transient hypotension and the requirement for blood transfusion needed to manage complications of PRB were significantly higher among patient in the high bleeding volume group, compared with the medium and low groups. A second analysis was performed with patients stratified into three groups based on average systolic BP. Again patients in the first tertile were classified into the ‘high’ group, those in the second tertile in the ‘medium’ group and those in the third in the ‘low’ group. BP was not recorded during the PRB procedure for six patients who were, therefore, excluded from this second analysis. Patient characteristics were comparable between the three BP groups, with the exception of age and eGFR (Table 5). Although there was no between-group difference in bleeding volume, the incidence of transient hypotension was higher among patients in the low BP group, while the use of nicardipine to manage PRB-related complications was more frequent among patients in the high BP group.
Comparison of the clinical characteristics among the different bleeding volume groups
| Bleeding volume groups | ||||
|---|---|---|---|---|
| Characteristic | High | Intermediate | Low | P-value |
| Number of patients | 84 | 84 | 84 | |
| Age (years) | 61 ± 17 | 64 ± 16 | 63 ± 17 | 0.497 |
| Male sex (%) | 48 (57) | 53 (63) | 52 (62) | 0.705 |
| Systolic BP (mmHg) | 140 ± 29 | 139 ± 23 | 138 ± 23 | 0.782 |
| Diastolic BP (mmHg) | 80 ± 13 | 80 ± 15 | 75 ± 14 | 0.081 |
| Heart rate (bpm) | 71 ± 13 | 71 ± 12 | 69 ± 11 | 0.424 |
| BMI (kg/m2) | 25.4 ± 4.1 | 24.6 ± 4.1 | 24.5 ± 4.5 | 0.368 |
| Hb (g/dL) | 12.4 ± 2.6 | 12.2 ± 2.4 | 12.5 ± 2.5 | 0.682 |
| Plt (×104/μL) | 24.2 (17.9–30.3) | 22.9 (17.9–28.8) | 24.5 (20.9–30.2) | 0.729 |
| Renal volume (mL) | 160 (133–186) | 155 (133–197) | 155 (125–190) | 0.907 |
| Height-adjusted renal volume (mL/m) | 102 (82–113) | 97 (83–121) | 97 (125–190) | 0.844 |
| eGFR (mL/min/1.73 m2) | 38 (25–62) | 37 (25–55) | 35 (25–61) | 0.893 |
| Anticoagulant (%) | 11 (13.1) | 8 (9.5) | 7 (8.3) | 0.573 |
| Antiplatelet (%) | 17 (20.2) | 12 (14.3) | 12 (14.3) | 0.483 |
| Parameter during PRB | ||||
| Use of nicardipine (%) | 32 (38.1) | 15 (17.9) | 27 (32.1) | 0.013 |
| Number of punctures | 3.0 (3.0–4.0) | 3.0 (2.0–3.0) | 3.0 (2.8–3.0) | <0.001 |
| Average systolic BP during PRB | 143 ± 18 | 140 ± 27 | 139 ± 20 | 0.317 |
| Complications | ||||
| Bleeding volume (mL) | 126 (85–203) | 38 (30–34) | 12 (6–17) | <0.001 |
| Change of Hb | −0.9 ± 1.0 | −0.2 ± 0.7 | −0.2 ± 0.8 | <0.001 |
| Macrohematuria (%) | 12 (14.3) | 14 (16.7) | 10 (11.9) | 0.678 |
| Transient hypotension (%) | 13 (15.5) | 5 (6.0) | 4 (4.8) | 0.026 |
| Blood transfusion (%) | 8 (9.5) | 4 (4.8) | 0 (0.0) | 0.015 |
| Bladder obstruction (%) | 2 (2.4) | 1 (1.2) | 1 (1.2) | 0.776 |
| Intervention (%) | 2 (2.4) | 0 (0.0) | 0 (0.0) | 0.133 |
Data are presented as mean ± standard deviation, number (percentage) or median (25th–75th percentile); BP, blood pressure; BMI, body mass index; Hb, hemoglobin; eGFR, estimated glomerular filtration rate; PRB, percutaneous renal biopsy.
Comparison of the clinical characteristics among the three average systolic BP during PRB groups
| Average systolic BP during PRB groups | ||||
|---|---|---|---|---|
| Characteristic | High | Middle | Low | P-value |
| Number of patients | 82 | 82 | 82 | |
| Age (years) | 65 ± 15 | 64 ± 15 | 59 ± 20 | 0.040 |
| Male sex (%) | 49 (60) | 48 (59) | 53 (65) | 0.699 |
| BMI (kg/m2) | 25.5 ± 8.0 | 24.7 ± 3.9 | 24.3 ± 4.4 | 0.203 |
| Systolic BP (mmHg) | 155 ± 23 | 138 ± 23 | 125 ± 18 | <0.001 |
| Diastolic BP (mmHg) | 82 ± 15 | 80 ± 13 | 73 ± 13 | <0.001 |
| Heart rate (bpm) | 70 ± 12 | 72 ± 12 | 70 ± 12 | 0.302 |
| Hb (g/dL) | 12.0 ± 2.5 | 12.4 ± 2.4 | 12.6 ± 2.4 | 0.350 |
| Plt (×104/μL) | 24.2 (18.5–30.1) | 23.7 (18.0–29.6) | 25.0 (21.0–29.2) | 0.468 |
| Renal volume (mL) | 153 (121–191) | 159 (127–210) | 160 (139–180) | 0.625 |
| Height-adjusted renal volume (mL/m) | 99 (81–118) | 100 (81–127) | 100 (85–113) | 0.789 |
| eGFR (mL/min/1.73 m2) | 30 (19–44) | 37 (28–64) | 41 (29–65) | 0.001 |
| Anticoagulant (%) | 6 (7.3) | 11 (13.4) | 8 (9.8) | 0.429 |
| Antiplatelet (%) | 16 (19.5) | 13 (15.9) | 11 (13.4) | 0.567 |
| Parameter during PRB | ||||
| Average BP during PRB (mmHg) | 160 ± 8 | 142 ± 4 | 121 ± 11 | <0.01 |
| Number of punctures | 3.0 (3.0–4.0) | 3.0 (3.0–3.8) | 3.0 (2.0–3.0) | 0.014 |
| Use of nicardipine (%) | 51 (62.2) | 11 (13.4) | 11 (13.4) | <0.001 |
| Complications | ||||
| Bleeding volume (mL) | 42 (21–101) | 34 (21–79) | 36 (16–69) | 0.351 |
| Change of Hb (g/dL) | −0.6 ± 1.0 | −0.4 ± 0.8 | −0.4 ± 0.8 | 0.231 |
| Macrohematuria (%) | 16 (19.5) | 10 (12.2) | 9 (11.0) | 0.239 |
| Transient hypotension (%) | 4 (4.9) | 5 (6.1) | 13 (15.9) | 0.026 |
| Blood transfusion (%) | 5 (6.1) | 4 (4.9) | 3 (3.7) | 0.769 |
| Bladder obstruction (%) | 1 (1.2) | 1 (1.2) | 1 (1.2) | 1 |
| Intervention (%) | 1 (1.2) | 1 (1.2) | 0 (0.0) | 0.604 |
Data are presented as mean ± standard deviation, number (percentage) or median (25th–75th percentile); BP, blood pressure; BMI, body mass index; Hb, hemoglobin; eGFR, estimated glomerular filtration rate; PRB, percutaneous renal biopsy.
Patients were also reclassified into three groups based on the number of puncture attempts: 1–2, 3 and 4–7. Patient characteristics were comparable between groups, with the exception of platelets and eGFR (Table 6). Bleeding volume and changes in hemoglobin level were significantly higher among patients who had undergone 4–7 punctures, compared with patients in the other groups. Based on logistic multivariate analysis, a bleeding volume ≥85 mL, the upper quartile of bleeding volume among patients in our study group, was predicted by ≥4 puncture attempts (Table 7).
Comparison of the clinical characteristics among the different number of punctures
| Number of punctures | ||||
|---|---|---|---|---|
| Characteristic | 1–2 | 3 | 4–7 | P-value |
| Number of patients | 54 | 131 | 67 | |
| Age (years) | 62 ± 17 | 62 ± 17 | 64 ± 16 | 0.750 |
| Male (%) | 36 (67) | 76 (58) | 41 (61) | 0.546 |
| Systolic BP (mmHg) | 136 ± 19 | 137 ± 27 | 145 ± 25 | 0.09 |
| Diastolic BP (mmHg) | 79 ± 15 | 78 ± 13 | 79 ± 15 | 0.774 |
| Heart rate (bpm) | 71 ± 12 | 70 ± 12 | 72 ± 12 | 0.090 |
| BMI (kg/m2) | 24.1 ± 4.0 | 24.7 ± 4.4 | 25.7 ± 4.0 | 0.177 |
| Hb (g/dL) | 12.3 ± 2.5 | 12.5 ± 2.5 | 12.1 ± 2.3 | 0.569 |
| Plt (×104/μL) | 25.8 (20.9–31.5) | 24.5 (19.5–30.6) | 22.6 (16.2–26.6) | 0.047 |
| Renal volume (mL) | 162 (140–190) | 157 (126–190) | 154 (120–195) | 0.499 |
| Height-adjusted renal volume (mL/m) | 100 (87–120) | 100 (81–195) | 97 (79–122) | 0.67 |
| eGFR (ml/min/1.73 m2) | 40 (24–62) | 38 (27–65) | 31 (18–44) | 0.007 |
| Anticoagulant therapy (%) | 8 (14.8) | 13 (9.9) | 5 (7.5) | 0.408 |
| Antiplatelet therapy (%) | 7 (13.0) | 20 (15.3) | 14 (20.9) | 0.453 |
| Parameter during PRB | ||||
| Use of nicardipine (%) | 12 (22.2) | 27 (28.2) | 25 (37.3) | 0.178 |
| Average systolic BP during PRB (mmHg) | 138 ± 18 | 140 ± 18 | 144 ± 18 | 0.101 |
| Number of punctures | 2.0 (2.0–2.0) | 3.0 (3.0–3.0) | 4.0 (4.0–5.0) | <0.001 |
| Complications | ||||
| Bleeding volume (mL) | 32 (12–49) | 39 (17–93) | 46 (22–124) | 0.007 |
| Change of Hb (g/dL) | −0.1 ± 0.7 | −0.4 ± 0.8 | −0.7 ± 1.0 | 0.002 |
| Macrohematuria (%) | 6 (11.1) | 18 (13.7) | 12 (17.9) | 0.550 |
| Transient hypotension (%) | 7 (13.0) | 11 (8.4) | 4 (6.0) | 0.392 |
| Blood transfusion (%) | 3 (5.6) | 6 (4.6) | 3 (4.5) | 0.953 |
| Bladder obstruction (%) | 1 (1.9) | 3 (2.3) | 0 (2.2) | 0.468 |
| Intervention (%) | 0 (0.0) | 2 (1.5) | 0 (0.0) | 0.394 |
Data are presented as mean ± standard deviation, number (percentage) or median (25th–75th percentile); BP, blood pressure; BMI, body mass index; Hb, hemoglobin; eGFR, estimated glomerular filtration rate; PRB, percutaneous renal biopsy.
Relative risks influencing bleeding volume after renal biopsy evaluated using logistic multivariate analysis
| Background | Relative risk (95% CI) | P-value |
|---|---|---|
| Hypertension (sBP >140 mmHg) | 1.7 (0.9–3.0) | 0.09 |
| Age (>60 years) | 0.7 (0.4–1.4) | 0.31 |
| Antiplatelet therapy | 1.6 (0.7–3.5) | 0.10 |
| Angicoagulant therapy | 2.1 (0.9–3.0) | 0.24 |
| Puncture (≥4) | 2.1 (1.1–3.9) | 0.03 |
sBP, systolic blood pressure; CI, confidence interval.
Discussion
Our study identified a median bleeding volume after PRB of 38 mL, with performance of ≥4 punctures being a significant risk factor for massive bleeding (≥85 mL). Our incidence rate of complications was comparable to previously reported rates [1–7]. These previous studies evaluated post-PRB complication based on the size of the hematoma and on the requirement for blood transfusion after the intervention or change in hemoglobin level. A novel contribution of our study is the use of a CT-based reconstruction method to quantify bleeding volume after PRB.
Previous studies have largely quantified bleeding volume from the thickness of the hematoma. However, as hematomas can occur in various forms (Figure 1), a single measure of hematoma thickness, based on ultrasound imaging, is likely to be insufficient to reliably determine bleeding volume. Furthermore, the amount of time after biopsy can influence the detection of bleeding. As an example, although assessment for hematoma is commonly performed immediately after biopsy, in some cases, a hematoma may not be observable at this point and is likely to be more appropriately detected by CT imaging performed on the day after biopsy. In fact, Simard-Meilleur et al. reported that 94% of complications, including bleeding, occur within the first 24 h after biopsy [6].
In our study group, 79% of patients who underwent PRB had a bleeding volume <100 mL, with 90% of our patients losing <5% of their estimated circulation blood volume. Blood transfusion was used to manage decreased hemoglobin levels, as per usual medical guidelines. It is important to note that changes in hemoglobin level are not determined only by the amount of bleeding, but also by the circulating blood volume and baseline hemoglobin level. As the circulating blood volume is implicitly linked to body surface area, a patient’s physical build should be considered when determining bleeding volume, particularly as patients of smaller stature will implicitly have a lower circulating volume of blood and, therefore, a reduced capacity to overcome excessive bleeding. This effect of a smaller stature, and of the associated lower volume of circulating blood, is likely to explain the higher risk for PRB-related blood transfusion in females. Anemia is also a risk factor for post-PRB blood transfusion likely due to a low baseline hemoglobin level. Although BMI was not specifically related to the volume of bleeding post-PRB, an increase in BMI did increase the likelihood of a greater number of punctures performed that, indirectly, may increase the volume of bleeding (Table 6). A higher BMI also increases the distance from the skin to the target location on the kidney for biopsy, which increases the risk for bleeding. Therefore, a patient’s stature is a very important factor to consider for a safe PRB procedure.
Previous studies have provided evidence of high BP, needle gauge, sex, low GFR, low platelet count, anemia and acute kidney injury as risk factors for bleeding post-PRB. However, we did not identify high BP, anemia, sex, low eGFR and low platelet count to be associated with bleeding volume post-PRB in our study group. In fact, the number of punctures being 4–7 was identified as the only risk factor of the volume of post-PRB bleeding. As this was a single-center study, we were not able to evaluate the effects of different needle gauges as a specific risk factor. We also did not identify any association between bleeding volume and pathology. Eiro et al. reported that amyloidosis can increase the incidence of post-PRB complications [4]. Our study group, however, included only one patient with amyloidosis and, therefore, it is likely that a low representation of amyloidosis, and other specific pathologies, could have contributed to our negative findings between renal pathology and bleeding volume.
Previous studies have also reported on the relationship between the number of puncture attempts and bleeding, providing no evidence of a specific number of punctures on complications [5, 6, 14]. Eiro et al. did report that a frequency of puncture ≥6 increased the risk for PRB-related complication [4]. However, bleeding volume in Eiro et al.’s study was evaluated from the thickness of a hematoma and change in hemoglobin. In our study, we identified that patients who had undergone 4–7 punctures were at a higher risk for massive bleeding. Kidney volume and height-adjusted kidney volume did not influence the number of puncture attempts and, therefore, kidney atrophy is not likely to be a risk factor for increased bleeding volume. However, we did identify a higher systolic BP in patients who had undergone 4–7 punctures, compared with those who underwent 1–2 punctures. Although a clear indication for this between-group difference could not be identified, uncontrolled hypertension might have been an issue in patients who underwent 4–7 punctures. While we did maintain systolic BP below 160 mmHg before the PRB procedure, it is possible that a stricter control of BP is required to reduce bleeding complications. Future studies are warranted to clarify the role of BP control in the development of complications after PRB.
We noted 22 cases of transient hypotension. Among these cases, nicardipine had been administered to 8.1%, with the remaining 9.0% not receiving nicardipine. The bleeding volumes in these two patient groups were not significant: 39 mL (25th–75th percentile, 19–66 mL) for patients having received nicardipine and 43 mL (25th–75th percentile, 15–126 mL) for those who did not receive it. Therefore, we conclude that although transient hypotension and the use of nicardipine may have contributed to the increased volume of bleeding, a vagal reflex was most likely to have played a role in the transient hypotension.
The limitations of our study need to be acknowledged in the interpretation and application of our results for practice. Foremost, our study only included patients over the age of 15 years, and in fact, only two patients were between the ages of 15 and 18 years. Therefore, we did not assess PRB-related complications in pediatric patients. Moreover, we were unable to assess the effects of desmopressin, a drug that has been shown to lower the risk of bleeding and, therefore, the size of the puncture-associated hematoma, when administered prior to PRB [15]. However, in Japan, this preventative use of desmopressin is not covered by our insurance system. Our study was conducted at a single site, using standardized procedures and only a 16-gauge needle. Therefore, effects of procedure and needle size on the incidence rate of complications and bleeding volume could not be evaluated. Due to the limited number of patients meeting the inclusion and exclusion criteria over the study period (n = 252), our evaluation of the relationship between histological diagnoses and bleeding complications was limited, with a low detection power for specific conditions, such as amyloidosis, which has previously been shown to be a specific risk factor for post-PRB bleeding [4]. Our distribution of histologically determined pathologies was different than in previously reported studies, with nephrosclerosis and diabetic nephrotic syndrome the most common diseases in our study group. It is important to note that diabetic nephrosclerosis and hypertensive nephrosclerosis are the two most common indications for renal replacement therapy in Japan, as well as increasing the likelihood for cardiovascular disease and mortality, with odds ratios of 2.87 and 11.88, respectively [16].
Despite these limitations, our study provides evidence of the successful use of CT-based reconstruction to assess bleeding volume after PRB. In addition, although it might be difficult to assess the risk for massive bleeding prior to renal biopsy, we provide evidence of a specific risk of ≥4 puncture attempts for post-PRB bleeding and recommend careful observation for these patients. Therefore, we provide accurate evidence to assist physicians in making safe decisions regarding the performance of PRBs.
Acknowledgements
We thank Kenji Kamata (clinical radiologist) and Keisuke Osamoto (clinical radiologist) for their assistance in image analysis.
Conflict of interest statement
None declared.


Comments