


Abstract
The Saccharomyces Genome Database (SGD) is compiling and annotating a comprehensive catalogue of functional sequence elements identified in the budding yeast genome. Recent advances in deep sequencing technologies have enabled for example, global analyses of transcription profiling and assembly of maps of transcription factor occupancy and higher order chromatin organization, at nucleotide level resolution. With this growing influx of published genome-scale data, come new challenges for their storage, display, analysis and integration. Here, we describe SGD's progress in the creation of a consolidated resource for genome sequence elements in the budding yeast, the considerations taken in its design and the lessons learned thus far. The data within this collection can be accessed at http://browse.yeastgenome.org and downloaded from http://downloads.yeastgenome.org.
Database URL:http://www.yeastgenome.org
Introduction
Since its inception in 1993, Saccharomyces Genome Database (SGD) (1) has been dedicated to annotating and characterizing the budding yeast genome, serving as a comprehensive resource for yeast biology to the scientific research community: from genes, to gene products and their interactions. All data presented within the database are carefully collected, summarized and integrated by knowledgeable PhD-level scientific staff from peer-reviewed literature. Additionally, as a publicly funded service organization, SGD provides free and open access to all its data and annotations in their entirety to all its users. With the effort described here SGD aims to extend the scope of its coverage to all aspects of genome function.
In the post-genomics age, increasing emphasis has been placed on understanding genome function beyond the limits of protein-coding regions, to areas where sequences with regulatory functions are thought to lie (2–6). We have taken great strides over the years towards providing accurate and detailed functional annotations for all genes, resulting in <10% of the ∼6000 budding yeast genes currently lacking Gene Ontology (GO) annotations (7). With the advent of large-scale experimental methods, researchers have been able to interrogate genome organization and cellular function systematically and quantitatively with relative ease—charting the structure and dynamics of the transcriptome, epigenome, proteome and interactome at high resolution. As a model eukaryote with a compact genome, the budding yeast was integral in the pioneering of many high-throughput techniques, including DNA microarrays (8), chromatin immunoprecipitation coupled with microarrays (ChIP-chip) (9), genome-scale nucleosome position mapping (10), high-resolution transcriptome mapping (RNA-seq) (11) and continues to be an important testing ground for new innovations.
Applications of these methods not only produce a great bounty of data and potential for enhancing our understanding of the budding yeast and other organisms, but also pose a considerable data analysis and interpretation challenge. Most notably, different feature types (e.g. transcription factor binding sites, histone modification marks, transcript boundaries and expression levels) are generally produced by different experimental and analysis methods, and result in varied output formats that must be integrated in an intuitive and straightforward manner for use by the greater research community. Other large-scale projects, particularly the analogous human (ENCODE) (12), worm and fly (modENCODE) Encyclopedia of DNA Elements (13) face similar challenges and have given considerable thought to dealing with the growing landslide of data produced. These projects share the common goal of interrogating genome function through exhaustive cataloguing of functional elements and serve as excellent models for the organization and execution of SGD's ENCODE-like project.
Typically, large collaborative projects rely on open communication and strong relationships between the participating laboratories (data producers) and a centralized Data Collection Center (DCC). The DCC is charged with the task of collecting, inspecting, storing, integrating and presenting the data to the end-users in an informative and expedient manner. Of particular importance is the collection of metadata, as experimental details not only frame the interpretation of data results, but also provide the grounds for others to repeat independently. This would include collection and storage of descriptions of the samples, reagents, technology platforms, protocols and analysis methods in an indexed, standardized, structured format. To achieve this, the DCCs of the ENCODE and modENCODE projects worked closely with the data providers, developing guidelines and stipulating the metadata required at the point of data submission by participating labs (14). Following the submission step, the DCC performs checks and processes the data for storage and formatting of data tracks for display and download via a genome browser and database. The modENCODE implementation of this approach has enabled the project to provide complex data search and filtering capabilities via integration with the modMine (http://intermine.modencode.org/) tool allowing for data retrieval and display in GBrowse (15) by for example, particular experimental conditions or reagents. This level of access and ability to retrieve different slices of the large data pie greatly enhances the utility of the resource.
This Genome Map project is structured around similar founding principles and goals to that of the ENCODE projects and strives to provide a comparable resource for budding yeast using the same methodologies whenever possible. However, unlike those projects, ours is not consortium-based and our position as a third party to the data producers imposes additional considerations that must be addressed:
Data identification and collection. What are the data sources? How can they be identified and selected?
Data processing and curation. How to deal with the mountain of data sets in the absence of common consortium-mandated guidelines, manpower and infrastructure?
Maintenance of data consistency. How to maintain consistency and coherence between data sets from potentially disparate data sources?
Completeness and coverage of resource content. How to achieve a comparable breadth and depth of data to that of the ENCODE projects?
Data presentation and accessibility. How will the data be stored, managed and accessed?
Consideration 1: data identification and collection
The Genome Map is meant to serve as a centralized data repository for cataloging genome features in the budding yeast. It is heavily modelled after the design principles and goals of the ENCODE and modENCODE projects, but with a primary difference at the level of data acquisition. Whereas members of the ENCODE and modENCODE consortia act as the data producers, SGD does not actively participate in data generation. Instead, SGD acts as a DCC and actively solicits and gathers data in accordance with SGD's historical stance in the community, whereby all data provided in the database are collected from published literature in a non-judgmental manner by PhD-level scientific staff.
Identifying relevant data sources
SGD has provided the research community with access to high-quality biological information and experimental results for almost two decades, through the efforts of knowledgeable, scientific biocurators who identify, extract and integrate information in the published literature pertaining to all aspects of budding yeast biology. Literature curation at SGD is typically done with a gene-centric view on a paper-by-paper basis. Relevant publications are first identified by automated PubMed searches that query for mention of ‘yeast’, ‘cerevisiae’ or existing gene or feature names within the title or abstract and assigned for manual screening by scientific biocurators. Papers are tagged for the type(s) of information they contain (Literature Guide Topics) and associated with gene names and prioritized for curation. Since 2005, as part of the general literature curation pipeline, SGD biocurators have been classifying papers describing genome-wide studies into data type specific topics, including large-scale proteomic, genomic and computational analyses. However, as these global studies often do not investigate individual gene/gene product function to the level required to make specific annotations, most of the data associated with these studies have not been incorporated into the database.
SGD aims to capture these data using the existing literature screening system as a starting point. As of September 2011, 4637 papers dating from 1984 to 2011 have been placed under the ‘Genome-wide Analysis papers’ topic, of which 244 were placed under the ‘Genomic co-immunoprecipitation study’ subtopic and 346 under ‘Other genomic analysis’, with possible positive papers also buried inside ‘Computational analysis’ (2378) ‘Genomic expression study’ (1068) and ‘Comparative genomic hybridization’ (48). Although these literature classification topics lack specificity and may not be wholly suitable for the needs of this project as they were implemented years before the conception of this current initiative, they nevertheless narrow down the total pool of papers we need to screen likely by an order of magnitude.
Using this pool of papers, we manually screened the titles and abstracts for papers describing the identification of features genome wide. We were specifically interested in those containing sequence data that could be mapped to and displayed visually against the genome, such as transcription factor binding sites, locations of chromatin with specific histone modifications or collections of expressed ncRNAs. As of this writing we initially selected 33 papers, spanning topics such as chromatin structure and organization, transcription profiling and regulation, replication and recombination, with additional papers added since, emphasizing cutting edge high-impact studies (Table 1). As manual literature screening is a time-consuming process, we also have been exploring the use of automated methods (‘Discussion and future directions’ section).
Summary of collected Yeast Genome Map data sets, as of September 2011
| Data type | Description | Number of publications |
|---|---|---|
| Chromatin conformation capture | Capture of chromatin interactions using 3C, 4C, 5C and other related technologies | 1 |
| ChIP-chip | DNA fragments from ChIP purifications, measured by tiling microarrays | 12 |
| ChIP-seq | DNA fragments from ChIP purifications, measured by sequencing | 1 |
| DNase-chip | Measurement of DNase-digested DNA by tiling microarrays | 0 |
| DNase-seq | Sequencing of DNase-digested DNA | 0 |
| FAIRE | Formaldehyde-assisted isolation of regulatory elements | 0 |
| Curated features | Genome feature annotations manually curated by SGD | a |
| Nucleosome profiles | Genome-wide organization of nucleosomes | 6 |
| Other | Other techniques, including DNA-chip and DNA-seq | 3 |
| RNA-chip | RNA expression measured by tiling microarrays | 4 |
| RNA-seq | RNA expression measured by sequencing | 4 |
| SAGE | Serial analysis of gene expression | 2 |
| Total | 33 |
aEleven SGD curated feature tracks available in GBrowse were collected from multiple sequencing projects and publications by SGD biocurators over the course of the SGD project. Zero-numbered data types represent identified gaps that will be filled within our collection.
Consideration 2: data processing and curation
Curation and analysis of reported datasets from high-throughput studies is typically very different from SGD's regular curation duties. For example, GO (16) curation at SGD begins with a review of the current literature associated with the gene(s) of interest by scientific curators who possess a broad knowledge base of yeast biology. They evaluate the published experimental evidence in the full text, tables and figures and make annotations that capture the processes gene products are directly and specifically involved in, in accordance with the GO hierarchy and evidence code system. In contrast, large-scale studies are often not gene-centric (e.g. ChIP-seq), and report chromosome or genome-wide trends (e.g. protein binding at particular promoters), which are often supported by focused, small-scale experiments at particular loci of interest (e.g. known targets) as validation of the reported global trends. While biocurators may be able to make specific functional annotations to some genes using the supporting small-scale validation experiments as evidence, results from individual high-throughput experiments generally lack the required level of exactness and certainty to make specific functional annotations to all regions surveyed, in our current practice. Moreover, the results of sequencing-based high-throughput experiments are often reported in very large tables of genomic positions associated with numerical measurements or genomic positions ascribed with particular features from which specific functional annotations cannot be readily made. These data types are more appropriately interpreted as a description of global trends and hence, need to be summarized and transformed into visual representations such as graphs overlaying a genomic map. This is the task of the bioanalysts at SGD. They are PhD-level staff with a strong working background in high-throughput biology, bioinformatics and statistics and are the workforce behind the inclusion of these nucleotide resolution chromosomal data into SGD.
Curation of literature flagged for incorporation begins with a quick scan of the ‘Materials and Methods’ section of each selected paper for mention of techniques producing sequence-based data, such as tiling microarrays and next-generation sequencing, and for verification that the scope of the study is indeed genome wide or multiloci (>500). In addition, any accession numbers and links to external data sources are gathered, along with all supplementary materials and data depositions to external repositories such as EBI's ArrayExpress (17) (http://www.ebi.ac.uk/arrayexpress/), NCBI's Gene Expression Omnibus (GEO) (18) (http://www.ncbi.nlm.nih.gov/geo/) and Sequence Read Archive (SRA) (19) (http://www.ncbi.nlm.nih.gov/sra/). Papers lacking these pieces of information are either tagged as not relevant or low priority, particularly if no data are provided or is only available in raw form. At this point, depending on the needs of the community, the novelty of the data and the current annotation space, the bioanalyst will prioritize the paper for processing accordingly. The typical data processing pipeline is illustrated in Figure 1 and is discussed in detail in the following sections.
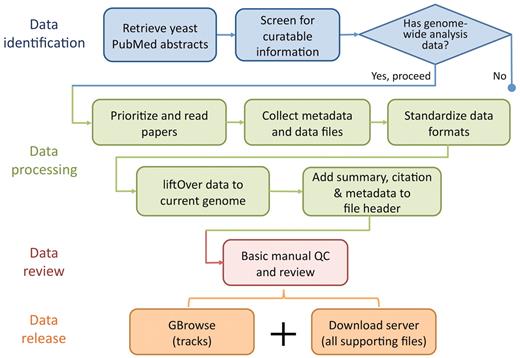
Flowchart showing the basic data identification, processing, review and release procedure performed by SGD biocurators (blue) and bioanalysts (some blue and all other colours). SGD biocurators perform the first 3 steps in blue as part of their regular literature triage, whereas SGD bioanalysts perform steps 2 and 3 in blue following the biocurators, with an eye for collectible data to integrate (all other colours).
Consideration 3: consistency and uniformity of content
To date, SGD has collected data sets from 33 publications representing >500 data tracks, covering a diverse range of feature types and data formats (Table 1). In addition to a mounting volume of data to manage, the different origins, reagents, methodologies, experimental platforms and data formats pose a major challenge to maintaining consistency and clarity in the processing and presentation of the collected data. The ENCODE project for example, has extensively studied and compared common platforms and reagents used for functional element identification (http://genome.ucsc.edu/ENCODE/platform_characterization), developing uniform guidelines for performing the project experimental procedures (http://genome.ucsc.edu/ENCODE/experiment_guidelines.html). While we cannot impose this level of uniformity in the execution of experiments within our collected data sets, we can strive to make available the collected data in a consistent manner. Our goal is to provide data to our users in the same standardized formats (e.g. GFF, BED, wiggle, bedGraph) that are familiar to users of the ENCODE projects, genome browsers and bioinformatians to ensure tool compatibilities and to facilitate cross-project/species comparisons.
As there is no submission process, but rather, active data post-publication collection on our part, we find an unsurprising level of variability in the types and format across the incoming data. For example, large data tables containing normalized ChIP-binding ratios or sequence read densities often come in Excel spreadsheets (.xls or .xlsx), delimited tables (tab or comma), or worse, embedded within PDF files, making it very difficult to extract the necessary information. These tables can be found among the supplementary materials provided with the journal article at the publisher’s website or on supplementary websites set up by the authors. Likewise, table formats tend to be inconsistent between studies, even those reporting similar data types and originating from the same laboratory, with variability in row and column numbers and content. Occasionally, the supplied files contain ambiguously labelled information, missing data or are not supplied altogether, requiring communication and clarification with the authors via email. For these reasons, automating the data extraction process is extremely difficult—how can we consolidate heterogeneous inputs into homogeneous outputs?
Presently, the task of data extraction is an ad hoc manual process performed by the SGD bioanalysts, customized for each study. Each incoming data set is examined for experiment details (Table 2), broken down into constituent experiments (e.g. each condition assayed, each transcription factor ChIP'd) and classified as having sequence segment, continuous quantitative, or other data. Sequence segment-based data are reformatted into GFF3 and BED formats (http://genome.ucsc.edu/FAQ/FAQformat.html), associating each genomic segment defined with suitable feature types using a controlled vocabulary (Sequence Ontology (20), http://www.sequenceontology.org/) and attribute ‘tag=value’ pairs such as ‘class=novel’, ‘confidence=high’, ‘read_count=[value]’, as appropriate, based on the depth of detail provided. Continuous quantitative data are reformatted into wiggle, bedGraph and bigWig formats (21), linking genomic positions with measured or calculated values into standardized formats fit to display in genome browsers commonly in use. Data that describe neither genomic segments nor density graphs are made available to users for download as is.
Data types currently collected from each study, where applicable
| Data class | Data type | Description |
|---|---|---|
| General info | Free text | The general goal and outcome of the study |
| General info | Free text | The goal and outcome of each experiment performed |
| Metadata | Protocol | Experimental technique(s) used (e.g. ChIP-chip, RNA-seq, SAGE) |
| Metadata | Protocol | Experimental platform(s) used (e.g. microarray manufacturer and type, sequencing method) |
| Metadata | Protocol | Experimental conditions (e.g. growth media, temperature, chemical treatments) |
| Metadata | Protocol | Experimental control(s) (e.g. controls used to normalize data in two-colour arrays, ChIP-chip/ ChIP-seq binding ratios) |
| Metadata | Reagents | Cell type population (e.g. asynchronous, cell cycle phase-arrested, cell cycle phase enriched) |
| Metadata | Reagents | Antibody information where applicable (e.g. the molecule the antibody was raised against, the catalogue number or identifier of the source) |
| Metadata | Free text | Accession numbers for database repositories (e.g. GEO, ArrayExpress, SRA, GenBank) |
| Metadata | Free text | URLs to supplementary websites |
| Metadata | Free text | Genome sequence version number, date and source (e.g. UCSC sacCer2 June 2008) |
| File | Link | Supplementary files (e.g. supplementary methods, figures and tables provided by the publisher, if applicable) |
| File | Link | Additional files (e.g. Additional data, methods, figures and tables provided by the authors, if applicable) |
Common sources of variability, uncertainty and error
On occasion, the data files provided by the authors will appear to already be in a standardized file format. In such cases, it is still prudent to ensure that that is true, as formats are similar and are common sources of confusion. A routine example is a filename and file format mismatch. Four-column bedGraph formatted files are often misnamed by authors as wiggle files which contain at most, two columns of data. Some mislabelled files even contain a ‘track type=wiggle_0’ declaration in the header, when a ‘track type=bedGraph’ declaration is more appropriate. Moreover, these seemingly innocuous mistakes can carry larger consequences, as wiggle and bedGraph coordinate systems differ. Like the GFF format, wiggle format uses a 1-based, end-inclusive system to denote genomic feature locations, whereas the BED and bedGraph formats use a 0-based, open-ended coordinate system. Hence, mislabelling and uncertainty in file formats easily allow ‘off by 1’ errors to perpetuate throughout the data if not caught during the processing step.
Accurate mapping of detected features and measurements to reference genomes is of paramount importance to the interpretation of data from high-throughput sequencing studies. Since its inception, SGD has become the authority on the Saccharomyces cerevisiae genome sequence, gene names and annotation. Historically, genome sequence updates were made available on our website as individual chromosome updates. In February 2011, we released a new reference genome resulting from the sequencing of strain AB972, a direct descendant of S288C. Sequence discrepancies between this version and the previous were resolved by manual inspection, affecting a total of 194 protein sequences (Engel, S.R. et al., in preparation). Concomitant with this new reference sequence release, SGD has also implemented a genome versioning system to clearly distinguish each genome sequence change since the original 1996 assembly (22) (v1) to the most recent (v64). Consequently, the lack of a versioning system in the past has introduced more sources of uncertainty in published data sets. Savvy users who have downloaded the genome sequence and annotations from SGD for feature mapping typically record the full date of the download (month, day, year), which would allow one to deduce the exact version of the sequence used. Less savvy users do not, or report only a partial date (e.g. month, year), making it difficult to trace the original mapped genome version. For example, it is unclear without comparing feature coordinates at changed regions, whether a reported analysis based on a genome sequence downloaded in ‘February 2004’ would have considered the large 220-bp insertion added by SGD on 18 February 2004. Furthermore, although updated information is regularly submitted to the Reference Sequence collection (RefSeq) at NCBI, other commonly used genome sequence resources, such as the UCSC genome browser, house only three assemblies: October 2003 (SGD/sacCer1), June 2008 (SGD/sacCer2) and April 2011 (SGD/sacCer3), despite a total of 106 individual chromosome X sequence updates made by SGD between 1996 and 2011.
Some sources of error and uncertainty are trickier to deal with and require a sensitive approach. For example, some authors analyze and report their data separately for reads mapping to each genomic DNA strand. However, standard RNA-seq library generation protocols do not preserve strand specificity, as reads synthesized from the first-strand cDNA cannot be distinguished from the second strand (23–26). As a result, the mapped reads should be roughly evenly distributed on both strands by the read mapper, which becomes obvious when the purported strand-specific data plotted against the genome sequence look nearly identical on both strands. Hence, it is possible that the reported data could have been improperly analyzed if the conclusions rest on strand-specificity.
Commitment to faithful data representation
All collected data are assumed to be valid by virtue of the peer review process and are provided as is. Although some data manipulation is necessary in the reformatting process, care is taken to maintain the integrity of the original data. Any ambiguities, such as mislabelling, missing values, mapped genome version or discordance with reported results in the main text, figures or tables are resolved through email communication with the authors. Data transformations or other operations that alter the published values are prohibited, with the exception of coordinate value translations via UCSC's liftOver tool (27) (http://genome.ucsc.edu/cgi-bin/hgLiftOver). This is to allow each data set made available by SGD to be comparable with each other against the same (most recent) version of the genome. Should subsequent genome sequence changes arise, each data set would be lifted over to maintain comparability and consistency. All data presented in the GBrowse genome browser (15) are displayed relative to the same and most current version of the genome sequence.
Transparency of process and documentation of practices
SGD's efforts to standardize our repository go beyond processing and transforming data files to the use of file formats like GFF3 and bedGraph, its metadata collection practices and provision of file inventories and help documents. The modENCODE project DCC was the first to our knowledge, to implement a detailed scheme to collect and query details of experimental samples and protocols in a defined, structured manner (14). Details of each experiment, protocol steps and regents are submitted to the DCC by data producers through a custom form-based system, using a combination of controlled vocabulary and free text that are collected using the project wiki. These details are associated and checked against the submitted files using a file format called BIR-TAB (Biological Investigation Reporting Tab-delimited), which describes their relationships and also links the data producers to the submission, through an automated pipeline.
The lack of a data producer-driven submission step from yeast projects places the onus on SGD to collect, format and store all experimental metadata in a manner that enables easy search and retrieval for users. These details are typically buried in published texts and must be extracted by a biocurator or bioanalyst familiar with the methods reported. Moreover, this information must then be structured in a clear and consistent format for a diverse array of assays and data types, a time and labour intensive process. Given these constraints in addition to the smaller scale of our project in data, resources and personnel, implementing a simpler manual approach appears to be a good compromise. Borrowing similar design principles from modENCODE, experiment and sample characteristics are manually captured using a combination of free text and reserved tags and keywords, sacrificing some depth and detail.
First, SGD bioanalysts gather and synthesize from the published text, a general description of each experiment performed and the ‘Experiment type’, such as ‘high-throughput sequencing’ or ChIP-chip’. Second, reagent-specific details such as the experimental ‘Platform’ used (e.g. GS20 pyrosequencer, Illumina Genome analyzer II, Affymetrix S. cerevisiae tiling 1.0R microarrays), strain, genotypes and antibodies are all collected and stored in a reserved ‘tag=value’ format. All accession numbers from external databases such as GEO, SRA and ArrayExpress, referring to the technology platforms used and the data submissions are similarly stored under ‘External data source’ and ‘External data source accession’ reserved tags. Lastly, this information is arranged in the text file header of each data file in a consistent style, human-readable and readily accessible across all data files (Figure 2). Any assumptions made by the bioanalyst leading to changes or transformations to the data are also noted in this text header where applicable, to ensure that the data could be clearly traced back to the original form. Verbose protocol descriptions such as strain construction, growth conditions, isolation and purification of molecules, analysis methods or scoring schemes are presently not collected or stored. Users are instead directed to the linked published supplementary methods for further detail. The use of reserved tags to refer to specific pieces of metadata affords flexibility as new tags can be introduced to describe new types of information, whereas existing tags impose restrictions on what can be recorded. The placement of this information in the file header, along with the publication citation and PubMed identifier absolves the need for additional BIR-TAB format files that describe investigator and metadata relationships to data files as they can be found in the same file header within each data file. This simplified system of storing free text and reserved tag and value pairs hence provides a consistent way to summarize the associated experimental metadata for each data file, and give sufficient details for any user to understand the enclosed data.
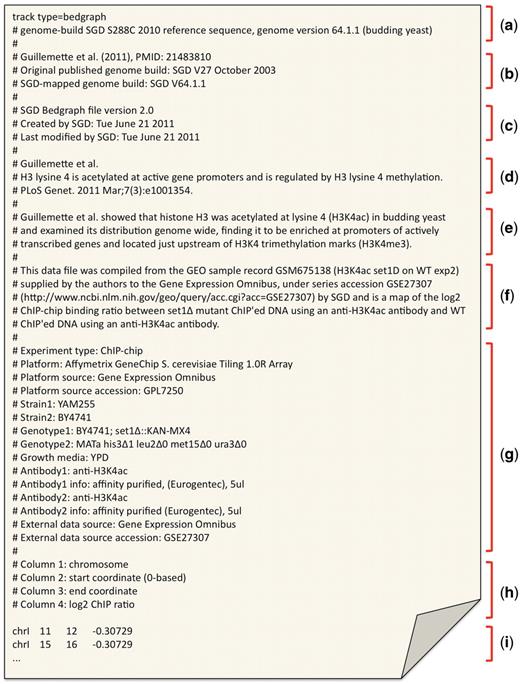
An example file header from a bedGraph file, containing the associated metadata collected from Guillemette et al. (28). The header is consistent across different standardized file types and generally contains the following sections: (a) track header (bed, wiggle and bedGraph) or GFF3 directives; (b) abbreviated publication reference and genome version information; (c) file version and modification dates; (d) publication citation from which the enclosed data is collected; (e) brief summary of the publication goal and/or findings; (f) brief summary of origin of enclosed data; (g) reserved ‘tag=value’ pairs containing experimental metadata details; (h) column descriptors for the enclosed standardized formatted data (bedGraph, in this example); and (i) bedGraph-formatted data values.
Consideration 4: collection coverage and completeness
A major challenge of the Genome Map project is to attain a comparable level of completeness and coverage of gene function determination to that of the ENCODE projects in its compilation. Those projects are backed by large consortia and are by design, exhaustive. Different facets of genome function are assayed by complementary techniques across multiple cell lines, tissue, time points and conditions to maximize the number of functional elements that can be found. Each data set may provide a different view or snapshot of cellular function and their integration has the potential to offer a more complete understanding of the whole system.
While the nature of the SGD project does not afford us the luxury of stipulating the depth and scope of the studies performed, we are taking a mindful approach to attaining a useful level of completeness and coverage in our data collection process. Our plan is to collect everything that is available in the public domain, prioritizing for high impact studies, comprehensive resource studies, and research areas where coverage is low within our collection (Table 1). Authors are invited to cooperate with SGD pre-publication to ensure accurate representation, expedient display and integration into the resource.
Suppose one wished to map a transcription regulatory network in budding yeast involving several genes of interest, where would one start? Using the SGD Genome Map collection, one might begin with identifying the position of transcription start sites (29,30) in the list of genes and determine whether different isoforms exist by searching genome-wide transcriptome data sets (11,31–33). Next, one might look at RNA polymerase II (RNAP II) occupancy (34,35) at the genes of interest, to determine whether they are actively transcribed under the assayed condition and corroborate those results with marks of histone H3 trimethylation at lysine 4 (H3K4me3) and histone H3 acetylation at lysine 4 (H3K4ac) and lysine 9 (H3K9ac), which mark active promoters (28,36,37). To connect target genes with their regulators, one might then consult genome-wide chromatin immunoprecipitation data (ChIP-seq and ChIP-chip) to identify transcription factor binding events in promoters that may be involved in recruiting RNAP II (3,38,39) and cross-reference the bound sequences with those identified by DNaseI protection (40). Network dynamics can then be examined by applying the same integrative analysis under different conditions, providing different viewpoints. Backed by a small genome and the powerful array of genetic tools available to study this model eukaryote, the value of a comprehensive resource for yeast genome function for integrative analysis and testing of new models is self-evident.
Consideration 5: data availability and accessibility
SGD is the authoritative resource for S. cerevisiae. Its dedication to comprehensive and accurate curation of yeast literature, service to the needs of the research community and open and easy access to a large body of information has made SGD a leader and an example amongst the model organism databases (MODs). These same principles guide our efforts in providing these high-throughput chromosomal data to our users.
Accessing the data
SGD offers two avenues for accessing the Genome Map data: the GBrowse genome browser (15) (http://browse.yeastgenome.org), and our data downloads page (http://downloads.yeastgenome.org). GBrowse is an open-source web application created by the GMOD project (http://www.gmod.org) and adopted by many MODs, such as dictyBase (41), WormBase (42), FlyBase (43), Rat Genome Database (44), TAIR (45) and ZFIN (46), for the display of genomic annotations and sequence features. GBrowse allows for easy visualization and manipulation of data tracks within the context of the basic SGD annotated features, such as ORF positions, Ty elements and tRNA genes. The downloads page enhances the FTP access historically provided by SGD, by offering an HTML interface for accessing and downloading individual data tracks and supplementary materials (e.g. supplementary files from publishers and lab websites).
Visualizing Yeast Genome Map data in GBrowse
SGD first implemented the GBrowse genome viewer (http://browse.yeastgenome.org) on its website in 2004. At the time, only a few tracks were available, consisting of basic genome feature annotations (e.g. ORFs, tRNA and rRNA genes, centromeres) and reagents (clones and primers). Today, GBrowse serves as the main gateway for accessing the rich functional data mapped to the yeast chromosomes. GBrowse has a wide assortment of customizable glyphs for displaying features and continuous data plots (Figure 3), is open-source, frequently updated with new features, and already familiar to most of our users.
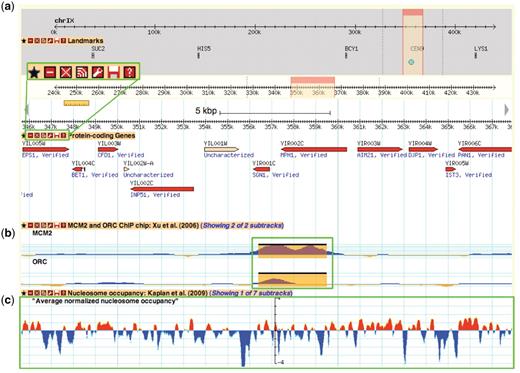
A Yeast Genome Map screenshot. Box (a) magnifies the tool bar present on each displayed data track. This tool bar can be used to customize one's browsing experience. From left to right, the buttons are ‘favourite’, ‘minimize’, ‘close’, ‘share track’, ‘edit track display’, ‘save track’ and ‘about this track’. The ‘favourite’ button selects the track as a favourite for easy future access. The minimize’ and ‘close’ buttons perform those respective actions on the selected data track. The ‘share track’ button provides URL links that can be copy and pasted into the address bar of another web browser or other GBrowse instances. The ‘edit track display’ button allows one to change the track properties, including glyph shapes, colours and scale. The ‘save track’ button allows for the data track to be saved for the displayed region, the entire chromosome, or the entire dataset. Lastly, the ‘about this track’ button provides a pop-up box with information on the originating data, including the publication citation, the strain(s) used and links to supplementary data files and documentation on the SGD download page. Box (b) and (c) show examples of different glyph types that can be used to display different data types. In this instance, box b shows ORC and MCM2 ChIP-chip data from Xu et al. (47) using the ‘vista_plot’ glyph, which allows superimposition of segment data such as peak calls over continuous data values. Box (c) shows normalized nucleosome occupancy as determined by Kaplan et al. (48) using the ‘wiggle_whiskers’ glyph, which standardizes display of continuous data as z-scores about the mean (x-axis).
Data tracks are organized within GBrowse by publication and grouped under the categories and data types listed in Table 1 under the track selection tab. Some publications report data from multiple related experiments, such as genome-wide chromatin immunoprecipitation assays (i.e. ChIP-chip, ChIP-seq) that can be grouped and displayed as subtracks, allowing for toggling of track display by experimental attributes such as the binding factor of interest and growth conditions. Each data track is accompanied by a short description of the track contents, a citation from the originating publication and a link to the standardized data track files, supplementary files and documentation on our downloads server (Figure 3). Pertinent metadata stored as ‘tag=value’ attributes in column 9 of the GFF file format associated with each displayed feature can be seen by mousing-over the feature.
Genome browsers such as GBrowse are valuable and necessary tools as next-generation sequencing-based techniques become more commonplace. They serve as the first step for data validation, allowing even the bench biologist to easily load and check general trends in their data, without the need for programming skills or complex statistical analysis. Users can upload their custom data tracks from a file or URL or just by copying and pasting the values within the ‘Custom Tracks’ tab on the GBrowse interface (Figure 3). Fast image rendering and track panning enable simultaneous viewing of data tracks for quick visual validation and comparison against curated SGD sequence features and multiple genomic data sets. For more in depth and rigorous comparisons, such as asking how often peak calls from multiple experiments overlap and agree within a specified window size, users may download the underlying data track files for computational analysis.
Bulk downloads of data
SGD provides original and formatted processed data files such as density graphs and peak calls via the data downloads page (http://downloads.yeastgenome.org) and the GBrowse interface. Raw data such as sequence reads and unnormalized microarray intensities are not provided but are instead linked in the accompanying documentation to external repositories (e.g. GEO, ArrayExpress, SRA) where they can be retrieved. Downloadable files from the Genome Map are stored under ‘Published datasets’ section of the data downloads page (http://downloads.yeastgenome.org/published_datasets/) and organized alphabetically by the last name of the first author in the following format: [Last name of first author]_[publication year]_PMID_[Pubmed ID]. Track data files that can be loaded into GBrowse or the UCSC genome browser (49) are stored within the /track_files subdirectory, whereas collected files from web supplements and publisher websites are placed in the /supplementary_files subdirectory. Track data from each listed publication are provided against multiple genome versions: the original published and the newest version at the time of release. Subsequent updates to the genome sequence trigger corresponding updates of all coordinate data track file mappings using UCSC's liftOver tool (27). Data files containing sequence feature mappings to outdated genome versions are placed in an /archive subdirectory under /track_files. Each data collection contains an accompanying README document that lists the available downloadable files with short descriptions of their contents and any URL links to additional supplementary information.
From data processing to display
Data display configuration and basic quality control of Genome Map data are first tested across several internal instances of GBrowse by SGD bioanalysts before deployment to the public production version at SGD. Local GBrowse instances installed on the bioanalysts’ personal desktops allow test-driving of new GBrowse builds, SGD-developed customizations, new display configurations and loading of pre-release Genome Map data without conflict with other bioanalysts, minimizing possible points of failure for the public version.
Next, working changes and data additions are introduced to an internal development version of GBrowse of the same build as the public version. This development version allows bioanalysts to consolidate their updates and ensure functionality of the genome browser before migration to the production version of GBrowse. GBrowse configuration files are also version controlled to allow for rollbacks to the last working version if necessary. Because all collected published data are assumed to be valid, only basic checks are done to ensure the data is formatted and presented correctly within the GBrowse display. Random positions within the genome are checked within GBrowse to ensure the loaded data tracks appear as expected. If related data sets are already available the Genome Map collection the newly loaded data can be compared against, then visual inspection of plot shape (continuous data) or presence/absence of features (segment data) is also performed. Furthermore, if the original publication contains a figure of reported features mapped against the genome, the loaded data are checked against it for consistency. Customized GBrowse features are also examined to ensure they contain the tailored information entered, such as metadata tag values within mouseovers, hyperlinks for each data track to the SGD publication reference page, and publication citations, summary information and download server links within the citation pop-up (the ‘?’ button on each data track toolbar in the browser window in Figure 3). SGD biocurators then independently browse and check the data at their favourite and random genomic locations as the final quality control step in the process.
Upon release, new tracks are announced in the ‘New and Noteworthy’ section of the main SGD website (http://www.yeastgenome.org), in our quarterly newsletter to SGD colleagues and on our Twitter stream (@yeastgenome). All collected data are immediately available for free and unrestricted use by users upon processing and loading into our production GBrowse and download server. No incubation period restricting data use and release is required, as the underlying data have already been published.
Discussion and future directions
Improving feature annotations at SGD
With the large cache of high-throughput data we have and will continue to compile, come new opportunities for improving and enriching annotations of current gene-based features (i.e. SGD Locus Summary pages) and the creation of new feature types to annotate. Gene annotations at SGD have historically been manually curated and centred around the open reading frames (ORFs), with little or no information on the full transcription unit, including untranslated regions (UTRs). In the past 5 years, several studies have used complementary techniques to explore the budding yeast transcriptome [cDNA libraries (29), tiling microarrays (31,32), RNA-sequencing (11,33)]. These studies have revealed the complexities of transcript architecture, from 5′- and 3′-end heterogeneity to overlapping transcripts and novel transcribed regions. In some cases, new transcript boundaries have uncovered possible misannotations in ATG start codons, examples where they are upstream or downstream of where the new data suggests they lie (11). Because these changes lengthen or shorten the amino acid sequence, they would be of utmost interest to confirm with alignments against orthologous fungal proteins and peptide libraries [e.g. NCBI's non-redundant protein database: ftp://ftp.ncbi.nih.gov/blast/db/, Swissprot (50)] and revise annotations as necessary. Additionally, repeated detection of unannotated transcripts and other ncRNAs by multiple platforms and studies may warrant their addition to SGD as new feature types of an unknown class for other researchers to confirm and characterize. Using transcriptome data to identify anomalies and refine gene structure annotations has long been part of Wormbase's regular annotation practice (51) and we plan to evaluate and adapt their methods in combination with resources such as YEASTRACT (52) and the Yeast Promoter Atlas (53) to improve gene models at SGD in the near future.
Enhancing access and searchability of data
As the Genome Map data collection grows, we must ensure ease of access is maintained and scale data search capabilities accordingly. Presently, metadata are tied as free text and ‘tag=value’ pairs to the headers of the data files they describe, with no capability for searching across different data files to find experiments containing similar attributes (e.g. synchronized cells, same microarray platform, same factors ChIP'ed). Hence, we are exploring options for enabling a search feature, such as using Apache Lucene API (http://lucene.apache.org) and/or InterMine (http://intermine.org).
Lucene is an open source, state-of-the-art text search engine library from The Apache Software Foundation. It is fast, scalable and portable, with powerful query capabilities, allowing keywords, Boolean operators, wildcards, fielded searching and much more. SGD has already been experimenting with the Solr Lucene interface as a replacement for the current Quick Search feature on the website. Data can be easily indexed by formatting them as ‘tag=value’ XML documents containing whatever fields we wished to search, including free text. A simple script could reformat the project metadata text headers into XML to be indexed and allow Lucene to retrieve search results sorted by relevancy and data fields.
InterMine is an open source data warehousing system upon which SGD's multifaceted, customizable search and retrieval tool YeastMine (http://yeastmine.yeastgenome.org) is built. YeastMine (Balakrishnan, R. et al., submitted to Database for the Biocuration 2012 conference) allows users to perform complex queries that can intersect diverse data types such as phenotypes, GO annotations, pathway information, genetic and protein interactions with ease. GFF files containing sequence segment data from the Genome Map collection can be loaded into YeastMine for search and retrieval of experimentally identified or newly defined sequence features relative to curated reference genomic features. Similarly, modMine, the metadata warehousing solution for the modENCODE project, is also built upon InterMine. modMine provides the interface for accessing modENCODE data files and querying metadata, which are loaded as converted ChadoXML from the BIR-TAB format (14).
Each access and search solution has advantages and disadvantages—whereas Lucene is easier to implement, it lacks the integration with other data types that YeastMine affords. Our current metadata text file header system also does not make use of the extensive and verbose BIR-TAB format, and would likely require a customized storage solution in YeastMine. But because both tools are active areas of development at SGD, we will continue to explore them as search options and evaluate their suitability as our Genome Map data collection and community usage increases.
Keeping up with the times: new and changing data types and technologies
Nearly all data in SGD originate from published literature that is largely acquired, screened and curated by a team of biocurators. To maintain efficiency and depth of coverage in our practices, whereas facing an increasing volume and complexity of information, SGD is continually exploring computational text mining and natural language processing methods such as Solr Lucene, Textpresso (54) and Support Vector Machines (55) to aid in literature screening. Initial observations from a SGD pilot study suggest that text-mining methods would be particularly fruitful for identification of publications of systematic genome-wide surveys of yeast function and organization through direct keyword searches in full-text (data not shown). This study was premised on the assumption that the genome-wide sequence-based features we wish to identify and collect tend to be produced by a small number of well-defined, large-scale experimental techniques and research papers describing the use of these techniques in budding yeast would likely contain data of interest to our Genome Map project. For instance, high-throughput sequencing-based methods such as RNA-seq and ChIP-seq necessarily produce sequence reads that are mapped to the genome to define features. Similarly, tiling microarrays produce for example, readouts of hybridization signals of ChIP'd, or DNaseI hypersensitive regions tiled across entire chromosomes or the entire genome. Additionally, public databases (e.g. GEO, ArrayExpress, SRA) support the deposition of these data types to grant uninhibited access to raw and processed data from these experiment types to users, providing identifiers and accession numbers that have characteristic features that make them amenable to discovery via text searches.
Functional sequence discovery using comparative genomics is a common method for annotating newly sequenced genomes and identification of putative functional sequence outside of protein-coding genes (2,4,6). SGD plans to increase its coverage to include the annotation of all major budding yeast genomes in the near future, requiring new tools to accommodate their storage and facilitate comparison and display. Mapped cross-strain and cross-species features can be displayed relative to the S288C reference using GBrowse_syn (56) (http://gmod.org/wiki/GBrowse_syn), a generic synteny viewer with similar look and feel to GBrowse. New sequence data types such as single nucleotide polymorphisms (SNPs) and copy number variations (CNVs) will require new customized GBrowse display glyphs, for example, the allele_column_multi glyph used by the Human HapMap project (57) (http://hapmap.ncbi.nlm.nih.gov/).
User feedback and outreach
SGD exists as a service organization for the yeast scientists and greater research community. We regularly communicate with our users and data providers through email and at conferences and meetings to ensure data accessibility, accuracy and availability is maintained at a favourable level. Video tutorials on accessing, browsing and downloading the Genome Map data collection are now available (http://yeastgenome.org/video_tutorials.shtml#GBT) to help users explore the data with ease. SGD encourages users of the Genome Map resource to provide feedback through our web form (http://www.yeastgenome.org/cgi-bin/suggestion) to voice any suggestions, data inaccuracies and data requests. Authors interested in submitting data to the collection are invited to contact us pre-publication to expedite the release and availability of their data on SGD following publication.
Summary and perspective
The Genome Map project at SGD is aimed at compiling a large library of data towards functionally annotating the entire budding yeast genome. But, it is more than just that – it serves as a platform for systems-level experimental design, allowing users to visualize, analyze and intersect diverse data through a common gateway, towards developing explanatory integrative models of cellular function. Although the project is at its infancy and the collection is still growing, anecdotal feedback from the research community has been very positive and encouraging. We anticipate the continual growth and expansion of coverage of our resource will help the research community illuminate gaps in the collective knowledge and direct new studies into unexplored areas of yeast research in the foreseeable future.
Funding
National Human Genome Research Institute: Saccharomyces Genome Database project (grant number P41 HG001315, American Recover and Reinvestment Act subaward). The content is solely the responsibility of the authors and does not necessarily represent the official views of the National Human Genome Research Institute or the National Institutes of Health. Funding for open access charge: Saccharomyces Genome Database project (grant number P41 HG001315, American Recover and Reinvestment Act subaward).
Conflict of interest. None declared.
Acknowledgements
We thank Edith Wong and Benjamin Hitz for their assistance in track setup and GBrowse configuration; Gail Binkley and Stuart Miyasato for adding the Genome Map data files to the downloads server; Dianna Fisk for assistance in defining dataset metadata; Craig Amundsen for aid with the UCSC liftOver tool; Shuai Weng and Kalpana Karra for helpful discussions and the SGD biocurators for their work in classifying the literature and their assistance in defining the workflow for the Genome Map data sets.
