


Abstract
The Rat Genome Database (RGD) is the premier repository of rat genomic and genetic data and currently houses over 40 000 rat gene records, as well as human and mouse orthologs, 1857 rat and 1912 human quantitative trait loci (QTLs) and 2347 rat strains. Biological information curated for these data objects includes disease associations, phenotypes, pathways, molecular functions, biological processes and cellular components. RGD uses more than a dozen different ontologies to standardize annotation information for genes, QTLs and strains. That means a lot of time can be spent searching and browsing ontologies for the appropriate terms needed both for curating and mining the data. RGD has upgraded its ontology term search to make it more versatile and more robust. A term search result is connected to a term browser so the user can fine-tune the search by viewing parent and children terms. Most publicly available term browsers display a hierarchical organization of terms in an expandable tree format. RGD has replaced its old tree browser format with a ‘driller’ type of browser that allows quicker drilling up and down through the term branches, which has been confirmed by testing. The RGD ontology report pages have also been upgraded. Expanded functionality allows more choice in how annotations are displayed and what subsets of annotations are displayed. The new ontology search, browser and report features have been designed to enhance both manual data curation and manual data extraction.
Database URL:http://rgd.mcw.edu/rgdweb/ontology/search.html
Introduction
The pace and volume of genomic and genetic research has increased dramatically over the past decade, due to technical advances in DNA sequencing and decreasing costs of such research. Many biological databases exist to organize and store either the sequencing data or associated biological data or both.
Organization of the tremendous amount of biological data has demanded the use of controlled vocabularies and ontologies that provide consistent and computable language to represent the information. Standardization of knowledge representation allows easy comparisons between different datasets and better communication of the knowledge.
An ontology is a structure of precisely defined terms that describes what exists (entities and relationships) in a particular domain. Scientific ontologies and other controlled and structured vocabularies provide a shared language between scientists for the purpose of consistent and accurate communication of experimental results, data analysis and hypotheses. Biomedical Ontologies are often built by a collaboration of ontology expertise and biological expertise (1), and sometimes by automated techniques based on mathematics of information theory (2).
Biocuration at the Rat Genome Database (RGD) involves the use of many different ontologies for annotating biological information to data objects [genes, strains and quantitative trait loci (QTLs)]. Most of the biological annotations are based on experimental data published in peer-reviewed journals. Currently, this data is compiled at RGD both manually by curators and automatically by software pipelines, which download annotations from other databases (3). In an effort to improve the quality and quantity of manual biological curation through the use of ontologies, RGD’s team of biocurators and software developers has created several new ontologies, a new ontology search tool, new ontology browser and new ontology report pages. These new ontologies, tools and report pages support manual curation of genes, strains and QTLs in the biological areas of molecular function, process, cellular component, disease, phenotype and molecular pathways. The intent of the enhanced ontologies, tools and pages is to improve ontology-based searching for data discovery at RGD.
Ontologies at RGD
RGD has used ontologies for many years to standardize curated data and provide that data to end users in an organized manner. Over time, the ontologies used at RGD have grown in number to provide more comprehensive data. One recent change for ontologies/vocabularies at RGD was the conversion from a MeSH (Medical Subject Headings)-based disease vocabulary to a disease vocabulary based on a combination of MeSH terms (‘C’ branch and terms from supplementary concept data) and OMIM terms (Online Mendelian Inheritance in Man, http://www.omim.org, http://www.ncbi.nlm.nih.gov/omim). This new disease vocabulary was developed at the Comparative Toxicogenomics Database (CTD, http://ctd.mdibl.org). The CTD disease vocabulary incorporates a larger number of terms than the disease vocabulary previously used at RGD, which increases the granularity of the vocabulary, so more specific information can be leveraged. Although the disease vocabulary discussed here is not technically an ontology, when ontologies in general at RGD are mentioned in this article, it should be understood that the disease vocabulary is included. A second change in ontology/vocabulary use at RGD was conversion from the MeSH-based behavior vocabulary to the Neuro Behavior Ontology (http://www.obofoundry.org/cgi-bin/detail.cgi?id=neuro_behavior_ontology) developed at the University of Cambridge (http://www.gen.cam.ac.uk/research/personal/gkoutos.html). In addition, a significant expansion of ontologies at RGD has been made to serve as the basis of phenotype curation for rat strains. Four ontologies have been created at RGD (Clinical Measurement Ontology, Measurement Method Ontology, Experimental Condition Ontology, Rat Strain Ontology; Shimoyama,M., Nigam,R., McIntosh,L. S. et al., unpublished data) to be able to curate and display quantitative phenotype data in a standardized manner in the recently developed RGD PhenoMiner tool (Shimoyama,M., Nigam,R., de Pons,J. et al., unpublished data).
The new ontology search
The original ontology search tool at RGD (Figure 1) provided both end users and curators a way to find terms in the Gene Ontology (GO) (4), Disease Vocabulary (‘C’ branch of MeSH), Behavior Vocabulary (‘F’ branch of MeSH), Mammalian Phenotype Ontology (MP) (5) and Pathway Ontology (PW) (6). The search allowed the user to choose which ontology is searched with a choice of search parameters (Contains, Equals, Begins With or Ends With). One major drawback of the original ontology search tool was that terms were searched, but not synonyms of those terms. That shortcoming was the main reason for needing to rebuild the ontology search tool. The new tool searches term fields, synonym fields and ID fields using words, portions of words or database IDs. In addition to improving the search algorithm, many more ontologies have been added to the ontology search tool (Figure 1). The additional ontologies help increase the efficiency of previous curation workflows by allowing all ontology term searching to be done in one browser at RGD, instead of curators needing to use multiple off-site browsers for ontologies not previously available at RGD. The new tool allows searching all, one or a combination of ontologies.
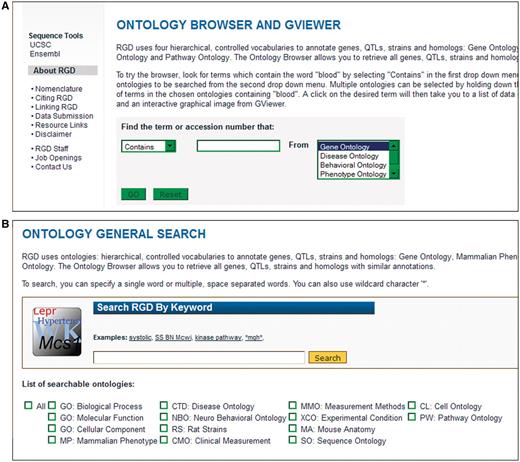
Old and new ontology search. (A) Old ontology search with choice of ‘Contains, Equals, Begins With, or Ends With’ for searching terms in one ontology at a time. (B) New ontology search interface with options of searching all or a combination of 14 different ontologies/vocabularies for terms, synonyms or accession numbers.
The new search first returns a list of ontologies in which the searched word(s) appears, along with a count of target terms found in each ontology (Figure 2). Each ontology name is linked to a term results page listing all target terms found in that ontology. The term results page provides the accession number for each term and annotation counts for each term and its children. The term results page has links to both the ontology report page for any term in the list for which annotations exist at RGD, and the ontology browser, where the selected term is highlighted. The ontology annotation report pages have reciprocal links with the ontology browser (Figure 2). All results pages, ontology report pages and browser pages have ontology term search boxes, so the maneuverability is maximized among all the various pages for searching and viewing ontology terms.
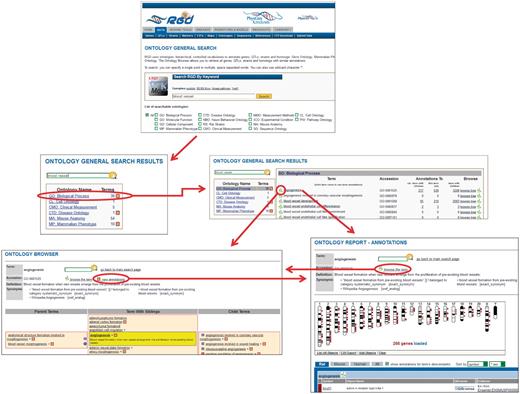
New ontology term search process at RGD. In this example, a search is done for ‘blood vessel’. From the ontologies returned, the user selects ‘GO: Biological Process’. From the terms returned, the user selects ‘angiogenesis’. Via convenient links the user has the option of viewing the term in the ontology browser or viewing the annotations for the term on the ontology report page. The user also has the option of following a link from the browser to the annotations or the reverse.
The new ontology browser
The format of the old RGD browser was similar to many publicly available term browsers (http://www.informatics.jax.org/searches/GO_form.shtml, http://amigo.geneontology.org/cgi-bin/amigo/search.cgi), meaning that the terms are displayed in an expandable tree format with multiple cascades of terms to represent multiple term paths in the ontology. That type of display typically generates a long web page that requires much scrolling to access all the different branches that include the searched term (Figure 3).
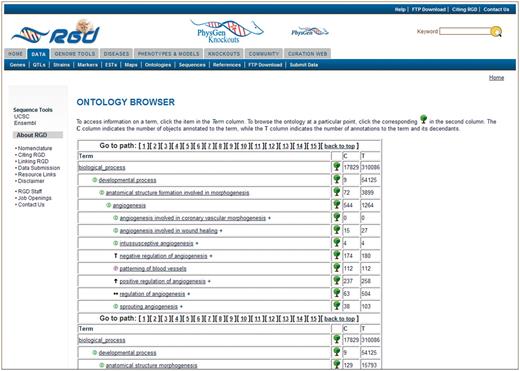
Old RGD ontology browser. Terms are displayed in an expandable tree format with each term being a link to an ontology report page listing all RGD annotations using that term. This example has 15 paths for the term ‘angiogenesis’, with most of the paths not visible without scrolling. The ‘C’ column contains the number of objects annotated to the term on each line, and the ‘T’ column contains the total number of annotations to the term and its children. Clicking the tree icon on each line resets the view to show that line’s term with all its children.
The new browser is much more compact in its presentation of ontology terms. It minimizes page scrolling by grouping parent terms, sibling terms and child terms of the searched or selected term. The selected term is presented in a center column together with all of its siblings (Figure 4). All parent terms of the selected term are listed in a column left of the center. All child terms of the selected term are listed in a column right of the center. The three column arrangement allows for rapid drilling up and down the term tree, regardless of how many branches contain the selected term. When a parent, child or sibling term is selected, the driller columns are redrawn with the selected term placed in the center column with its siblings, and new parent and child terms listed in the adjacent columns.
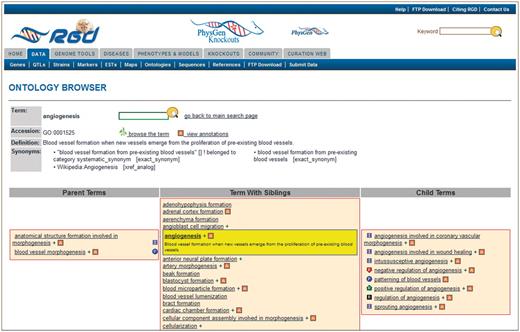
New RGD ontology browser. Terms are displayed in a driller format with each term being selectable such that the selected term is highlighted and placed in the center column with all of its sibling terms. The selected term’s definition is shown both highlighted under the term in the center column and also at the top of the page. All parent terms of the selected term are listed in the left column and child terms of the selected term are listed in the right column. For any term that has annotations to it in RGD, the ‘A’ icon is a link to an ontology report page listing all RGD annotations to that term.
An additional view of the selected term is shown at the bottom of the browser page (Figure 5). It is a graph view showing the selected term and all its antecedent terms. It allows the user or curator to see the overall view of all term paths from the selected term up to the top node of the ontology tree. All the terms in the graph tree are links to the browser, such that a term clicked in the graph view becomes the selected browser term and the page is redrawn accordingly.
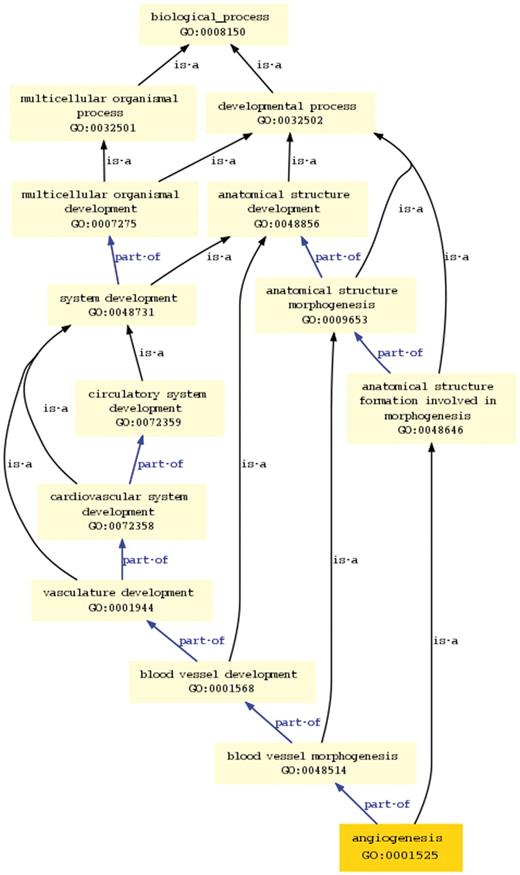
Graph view in new ontology browser. This view shows all the paths and parent terms between the selected term ‘angiogenesis’ and the top-level term ‘biological process’.
To compare the new RGD ontology browser with expandable tree format browsers, testing was done with both experienced browser users and inexperienced volunteers. Browsing up and down ontology trees was performed on four different tree format browsers (Mesh browser - http://www.nlm.nih.gov/mesh/2012/mesh_browser/MBrowser.html for Disease Vocabulary, MP browser - http://www.informatics.jax.org/searches/MP_form.shtml for Mammalian Phenotype Ontology, GO browser - http://www.informatics.jax.org/searches/GO_form.shtml for Gene Ontology, and PW browser - http://bioportal.bioontology.org/ontologies/46237?p=terms for Pathway Ontology) and the RGD driller-type browser. Subjects were timed while browsing sets of terms from four different ontologies/vocabularies. On average, subjects performed browsing significantly faster across all tested ontologies/vocabularies (disease vocabulary, Mammalian Phenotype Ontology, Gene Ontology and Pathway Ontology) using the new RGD browser as compared with the other browsers. Paired t-tests on all the browser comparisons (Table 1) covered a range of P-values from a high of P < 0.007 for phenotype term browsing by inexperienced users to a low of P < 6 × 10⁻⁸ for gene ontology browsing by experienced users. The new RGD browser efficiently guides users through ontology searching, regardless of amount of previous experience.
Comparison of browsing speed in various ontology/vocabulary browsers
| RGD browser compared with: | Subject Experience class (number of subjects) | Time saved using RGD browser (s) | Probability (P) that browsers tested as equally fast |
|---|---|---|---|
| MeSH | Inexperienced users (3) | 21 ± 3.3 | <0.002 |
| Experienced users (6) | 6.5 ± 2.0 | <0.007 | |
| MP | Inexperienced users (3) | 26 ± 6.7 | <0.007 |
| Experienced users (6) | 8 ± 2.6 | <0.002 | |
| GO | Inexperienced users (3) | 65 ± 12.5 | <0.00006 |
| Experienced users (6) | 49 ± 6.7 | <6 × 10⁻⁸ | |
| PW | Inexperienced users (3) | 16 ± 2.2 | <0.00005 |
| Experienced users (6) | 19.5 ± 3.2 | <0.00002 |
The subjects were timed while browsing 8 term sequences (for disease vocabulary) or 10 term sequences (for the other ontologies) in each of the two browsers for each ontology category. This was repeated for three sets of terms in each ontology/vocabulary. Values are means (± SEM). All browsers are publicly available (see text for URLs). P-values are based on paired t-test. MeSH, disease vocabulary; MP, Mammalian Phenotype Ontology; GO, Gene Ontology; PW, Pathway Ontology.
New ontology report pages
The new ontology report pages at RGD display upgraded features from the old report pages and new additional features. One feature kept from the old report pages is the GViewer [an embedded DHTML (dynamic HTML) application], which is displayed on the page directly below the basic term information (accession number, definition and synonyms; Figure 6). The GViewer gives a genomic view of the annotated genes, QTLs and congenic strains for the ontology term which is the subject of the report page. The strain information is new to the GViewer, where congenic strains are now mapped via the position of the flanking markers on the genome. Each annotated object is represented by a color-coded marker adjacent to the appropriate chromosomal location: genes—brown, QTLs—blue and strains—green. Clicking on a chromosome or object marker causes a scrollable ‘slider’ (gray box on X chromosome in Figure 6B) to appear on the chromosome ideogram and a scrollable ‘zoom pane’ to appear below the chromosome pane. The zoom pane provides gene, QTL or strain symbols as labels for the objects’ genomic position markers. Those labels are links to individual report pages for genes, QTLs or strains. The GViewer has both data upload and download functions on the bottom bar of the chromosome pane.
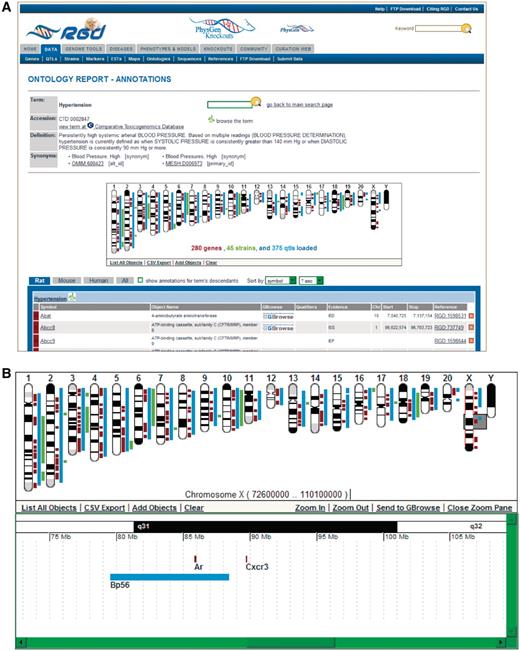
New ontology report page. (A) This example of an ontology report page is for the disease term ‘hypertension’. The GViewer shows that RGD annotations to ‘hypertension’ have been made to genes, QTLs and strains. Part of the list of annotations is shown below the GViewer. (B) This display of the GViewer shows a scrollable slider (gray box) on chromosome X. The zoom pane shows an enlarged view of the part of the chromosome that the slider covers. Two genes (Ar and Cxcr3) and a QTL (Bp56) are identified in the zoom pane.
All annotations made to the report page’s ontology term are listed by species in the table immediately below the GViewer (Figure 6A). A new tab feature allows users to view rat, mouse or human annotations separately or all together by selecting the appropriate tab. A second new feature for the annotation list is a toggle button to switch between annotations to the report page term alone and the report page term plus its children. An additional new feature is the ability to sort the lists by any of the columns of data in the list. All of these new features allow users more options to retrieve and view data than on the old report pages.
The bottom of the new ontology report page shows two different views of the report page’s term within the context of the ontology (Figure 7). The first display is a tree view of the term with parents and children displayed. That view is configurable through a dropdown menu that allows the user to choose how many paths to the root node are displayed. The tree format gives the user an alternate way to browse the ontology. The second display is a graph view, similar to the one shown at the bottom of the ontology browser page. Any of the terms shown in the tree or graph view may be clicked to go to the ontology report page featuring that term. Also, any term may be displayed in the ontology browser by clicking on the ‘branch’ icon to the right of the term in the tree view.
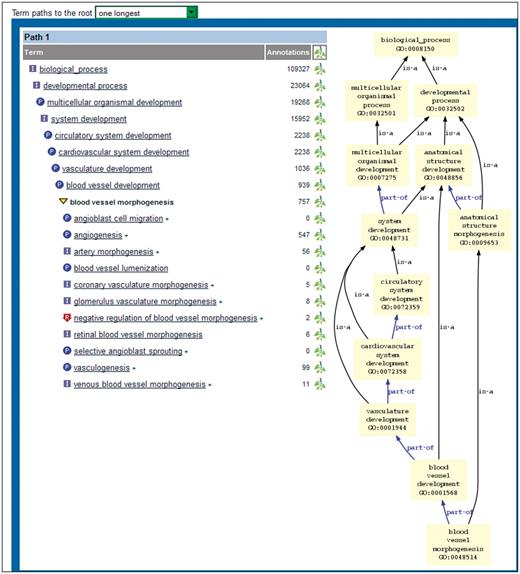
Bottom portion of new ontology report page. The tree view on the left shows the selected term in boldface. The parent and child terms are shown above and below the selected term, respectively. A single path (the longest one) is displayed because ‘one longest’ has been chosen in the dropdown menu above the display. The graph view on the right shows all paths from the selected term to the root node.
Software development
All tools mentioned below are built on J2EE technologies (http://java.sun.com/j2ee/overview.html) and driven off the RGD Oracle database. The tools can be run on any Java container that implements the Java Servlet 2.5 and JSP (JavaServer Pages) 2.1 specification or above. The popular Spring (7) framework’s MVC (model-view-controller) architecture streamlines the application web development. The user interface relies heavily on the DOM (Document Object Model) technology along with CSS (Cascading Style Sheets). Supported browsers include Internet Explorer 7+, Firefox 3+, Chrome 13+ and Safari 5+.
Building the new ontology search
All ontologies being used are stored in the Oracle database and updated weekly. The ontology loading pipeline uses an FTP (file transfer protocol) to download the latest versions of ontology files in ‘.obo’ format from external sources. The SearchIndexer pipeline, run on a weekly basis, examines all ontology terms and their synonyms, and builds an index that is stored as a table in RGD’s Oracle database. The index is then used by the ontology search tool to perform efficient searches across multiple ontologies.
Building the new ontology browser
Graph views are generated by the ‘dot’ module of the open source Graphviz package (http://www.graphviz.org). First, the document in dot language is built with the definitions of all paths from the selected term to the root term. After being passed to the Graphviz service, both the image and the corresponding image map are produced and presented on the term browser page. The developer can supply optional parameters to this graph generation service so the output can be customized to specific needs.
Building the new ontology report pages
GViewer is written in DHTML (dynamic HTML), taking advantage of CSS3, HTML5, AJAX (8) and recent improvements in DOM technology. This technology allows the viewer to be platform independent without requiring browser plug-ins. Banding pattern and chromosome definitions are fed in via XML files, allowing the flexibility to display chromosome structure from any species. Genomic object tracks are also fed in via XML and plotted to their base pair location. Loose coupling of the configuration information allows for flexibility when embedding the tool into other applications. Once implemented in a web site, the existence of XML configuration is transparent to the end user.
To show ontology term trees on the report pages, the tools send hierarchical data queries to the Oracle database for optimum performance. Ontology data aggregates are computed after every ontology load once a week. This background job precomputes several pieces of information for every ontology term, such as count of immediate child terms, count of annotations for given species for all child terms, etc. RGD stores this data in a separate table in the Oracle database. This information is subsequently used on ontology report pages to significantly reduce page loading time.
Summary
The Rat Genome Database curates many types of data (disease, phenotype, pathway, molecular function, biological process, cellular component and nomenclature) for a variety of objects (genes, QTLs, strains). To represent these data in a standardized manner, RGD uses more than a dozen different ontologies or controlled vocabularies. To perform biocuration more efficiently and to provide end users with a more robust interaction with the data, RGD has recently expanded its use of ontologies by both development of new ontologies and increased use of externally available ontologies. The ontology term search has been improved in both scope and quality. To accelerate the ontology term search process for both curators and end users of RGD, a ‘driller’ type browser has been built to replace the old expandable tree format browser. Additional tree and graph views of ontology terms have been added to both browser and ontology report pages to allow users to see the ontologies from different perspectives. Finally, the ontology report pages have been rebuilt to make the ontology annotations more accessible through more user options for data display. Through the concentrated effort of biocurators and software developers, RGD has executed a dramatic improvement in the use and presentation of ontologies.
Funding
The National Heart, Lung, and Blood Institute on behalf of the National Institutes of Health (HL64541). Funding for open access charge: The National Heart, Lung and Blood Institute on behalf of the National Institutes of Health [HL64541].
Conflict of interest. None declared.
