


Abstract
The Gene Ontology (GO) has proven to be a valuable resource for functional annotation of gene products. At well over 27 000 terms, the descriptiveness of GO has increased rapidly in line with the biological data it represents. Therefore, it is vital to be able to easily and quickly mine the functional information that has been made available through these GO terms being associated with gene products. QuickGO is a fast, web-based tool for browsing the GO and all associated GO annotations provided by the GOA group. After undergoing a redevelopment, QuickGO is now able to offer many more features beyond simple browsing. Users have responded well to the new tool and given very positive feedback about its usefulness. This tutorial will demonstrate how some of these features could be useful to the researcher wanting to discover more about their dataset, particular areas of biology or to find new ways of directing their research.
Database URL:http://www.ebi.ac.uk/QuickGO
Introduction
High-throughput sequencing and experimental methodologies have meant that there is an ever-increasing amount of biological data available to researchers, which must be effectively managed, analysed and interpreted. The Gene Ontology (GO) has proven highly useful in helping researchers find biological significance in high-throughput data by supplying a consistent and structured nomenclature for biological concepts. These terms have been employed by a large number of biological database groups to describe the functionality of specific gene products; the combination of a highly descriptive, structured vocabulary and associated gene product annotations has proven effective in ordering and interpreting large data sets.
GO and the Gene Ontology Annotation group
GO is a controlled vocabulary describing three functional attributes of gene products: molecular function, biological process and cellular component. The terms within these three ontologies have unique identifiers and are organized as a directed acyclic graph (DAG), a hierarchical structure where each term can have one or many parent (less-specific) terms and zero, one or many child (more-specific) terms (Figure 1). Relationships between terms are indicated in the key to the right of the graph in Figure 1. There are currently five relationship types: is a, meaning that the term is a subclass of its parent, e.g. ‘transferase activity’ is a type of ‘catalytic activity’; part of, meaning that the term is part of the parent term, e.g. ‘nucleolus’ is part of ‘nuclear lumen’; regulates, meaning that the term is a process that modulates its parent process, e.g. ‘regulation of apoptosis’ describes the modulation of ‘apoptosis’; the final two relationships are positively regulates and negatively regulates, each describing the relevant modulation of a parent process term.
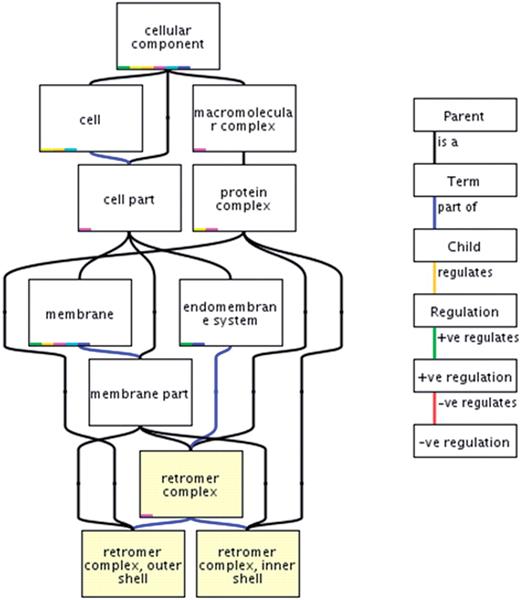
A section of the Cellular Component part of the Gene Ontology showing the term ‘retromer complex’. The term has three parent terms; ‘membrane part’, ‘endomembrane system’ and ‘protein complex’ and two child terms; ‘retromer complex, outer shell’ and ‘retromer complex, inner shell’. Relationships between the terms are indicated by coloured lines (edges) joining the terms, the different relationships are displayed in the key in the right panel.
Associations between these terms and gene products are made by several biological databases producing detailed functional descriptions of gene products. The Gene Ontology Annotation (GOA) group is one of 20 databases that form the GO Consortium. Each of these databases uses the common vocabulary of GO to annotate a range of gene products from different species in a consistent way. These associations, or annotations, can be made manually or computationally (electronically). Manual annotation is carried out by highly trained biologists reading published experimental literature, whereas electronic annotation involves the automatic assignment of GO annotations to gene products. To read more about GOA's annotation methods, please see the ‘Annotation methods’ link on our website (http://www.ebi.ac.uk/GOA/). Gene products can have many GO annotations in each of the ontologies such that well-studied genes or proteins may have hundreds of annotations assigned either by manual or computational methods, for example, human p53 (http://www.ebi.ac.uk/QuickGO/GProtein?ac=P04637) protein has over 200 GO annotations.
QuickGO and other GO browsers
As the number of genomes being sequenced, and gene products being characterized increases, the GO annotations made from this data concomitantly increases (the GOA database contains over 45 million GO annotations as of July 2009) so there is a need for researchers to be able to sort and view these annotations and quickly retrieve relevant information to direct their research. All GO annotations from the GO Consortium member groups are available as Gene Association Files which are downloadable from the GO Consortium website (http://www.geneontology.org/) and the individual database websites. Such files have a very simple tab-delimited format; however, these files are large and somewhat cryptic to a biologist, requiring some computational knowledge in order to obtain from them subsets of information they are interested in. QuickGO was developed by the GOA group in August 2001 as a fast, web-based browser of GO term information and all GO annotations assigned to UniProt Knowledgebase (UniProtKB) accessions. In 2007, the GOA group was awarded a grant from the BBSRC Tools and Resources Development Fund to redevelop QuickGO by adding extensive new features. In March 2008, following this redevelopment, the new version of QuickGO was released. The GO annotations contained within the GOA database are now at the centre of QuickGO, users are able to customize annotation sets by using the extensive filtering options provided, these include being able to filter on protein accession, evidence code, taxonomic identifier and GO term. The latter functionality also means that users can create GO slims, subsets of GO terms used to simplify the view of annotations to a set of gene products (Binns,D. et al., submitted for publication).
A number of different web-based GO browsers are publicly available (see the GO Consortium Tools website: http://www.geneontology.org/GO.tools.browsers.shtml), and the vast majority provide equivalent detail on the terms and structure of the GO, it is in the display and manipulation of associated annotations where the main difference between browsers can be seen. A number of GO browsers are provided by model organism groups, which display the full set of electronic and manual GO annotations for individual species, such as the MGI GO browser (http://www.informatics.jax.org/searches/GO_form.shtml) (1), whereas the GO Consortium browser, AmiGO (http://amigo.geneontology.org/cgi-bin/amigo/go.cgi) (2), provides a comprehensive display of manual annotations provided by the groups in the GO Consortium. AmiGO is the most comparable GO browser to QuickGO in that the ontology can be searched and browsed, terms and their relationships can be viewed in context with the GO hierarchy, GO annotations can be viewed and downloaded for multiple species and it is updated frequently. Similar to QuickGO, AmiGO also has a GO slim facility used to map-up annotations to more general GO terms to give a simplified overview of the attributes of a list of gene products.
In addition, an increasing number of publicly available tools from third-party groups have been created to enable the manipulation and analysis of the GO ontologies and annotations in the context of other public ontology efforts and gene expression data [e.g. Ontology Lookup Service (http://www.ebi.ac.uk/ontology-lookup/) (3), Gene Class Expression (http://gdm.fmrp.usp.br/cgi-bin/gc/upload/upload.pl) (4)].
QuickGO is unique among these other browsers in that it is the only web-based browser to display annotation to almost 190 000 species, including both manually and electronically assigned annotations, as well as the facility to extensively filter on a number of annotation attributes and map between 17 different identifier types. This facility is of particular interest for researchers requiring functional predictions for genes or proteins originating from non-model organism species.
QuickGO is updated weekly with GO annotations and nightly with GO term information making it one of the most up-to-date GO browsers available, this is a critical feature of GO browsers, and GO analysis tools in general, due to the constant growth and updating of both the ontology and annotations. Unfortunately, there are some GO browsers where there is a long lag between updates [e.g. Gofetcher (http://mcbc.usm.edu/gofetcher/home.php) (5), GenNav (http://mor.nlm.nih.gov/perl/gennav.pl)] requiring users, sometimes unwittingly, to use old data.
QuickGO is linked from a range of text-mining, protein- and gene expression-analysis tools and protein databases. These tools provide a wide range of services but use QuickGO as the primary source of GO term and annotation information. Text-mining tools linking to QuickGO include GOCat (http://eagl.unige.ch/GOCat/) (6) and EBIMed (http://www.ebi.ac.uk/Rebholz-srv/ebimed/index.jsp) (7), which can analyse either blocks of text or PubMed identifiers to predict GO terms that could be associated with that text. Other analysis tools linking to QuickGO include InterProScan (http://www.ebi.ac.uk/Tools/InterProScan/) (8), a protein signature recognition tool and DAVID (http://david.abcc.ncifcrf.gov/) (9), a functional enrichment analysis tool. Major databases which link to QuickGO term and annotation data include the Pfam protein family database (http://pfam.sanger.ac.uk/) (10), UniProtKB (http://www.uniprot.org/) (11) and the Human Protein Atlas (http://www.proteinatlas.org/) (12).
This article hopes to provide users with some examples of the more complex and novel functions that QuickGO can perform, in an easy to follow guide. The researcher will then be able to apply this knowledge to their own data set enabling them to draw conclusions more easily about their chosen area of research. Some of the examples cited within are taken from real-life tasks that are commonly requested by our users through the GO (gohelp@genome.stanford.edu) and GOA (goa@ebi.ac.uk) helpdesks.
Basic QuickGO
Getting started
One of the great advantages of QuickGO is that it is very easy to start browsing the GO and its associated annotations. There is no software to download and the basic search interface is intuitive for novice users. Before understanding how some more complex tasks can be tackled, we will begin with a ‘quick-start’ guide to QuickGO.
The front page of QuickGO is shown in Figure 2 and from this point you have access to the majority of QuickGO's features, which are indicated. To assist new users, example queries are included below the search box.
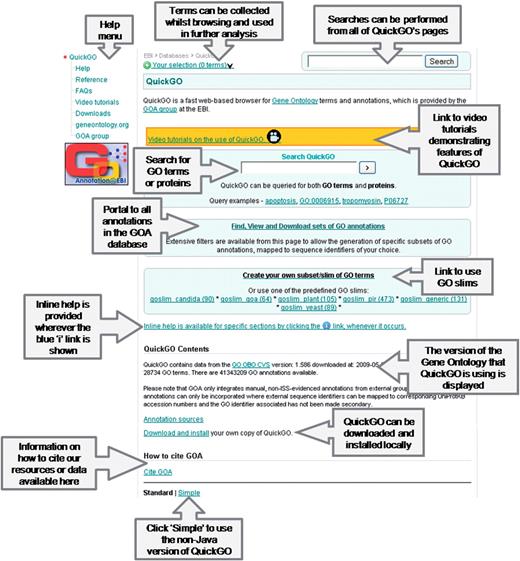
The front page of QuickGO. Most of QuickGO's functionality can be accessed from this page (http://www.ebi.ac.uk/QuickGO/).
An example of a simple GO term search would be to type ‘nucleus’ into the search box, this search results in a list of GO terms that have the word ‘nucleus’ in their GO term name, definition or synonym field. The required GO term can be viewed by clicking on the GO ID link. Figure 3 shows the information page for ‘nucleus’, the page is organized into tabs; Term Information, Ancestor Chart, Ancestor Table, Child Terms, Protein Annotation and Co-occurring Terms which contain all the information for a GO term including its GO ID, definition, synonyms, position within the ontology, relationship to its parent and child terms, proteins associated with the term and the terms which are most commonly co-assigned with the term.
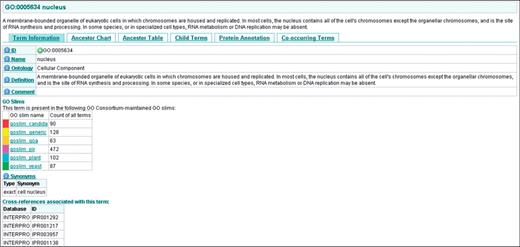
The Information page for ‘nucleus’, the page is organised into five tabs which contain all the information for a GO term including its GO ID, definition, synonyms, position within the ontology, relationship to its parent and child terms, proteins associated with the term and the terms which are most commonly co-assigned with the term.
Filtering annotations
One of QuickGO's strengths is its ability to extensively filter annotation data. This section will provide a quick-start guide on how to filter annotations in the most useful ways. Filtering is performed on any protein annotation table, e.g. the Annotation Download table (http://www.ebi.ac.uk/QuickGO/GAnnotation) or a Protein Annotation table associated with a single GO term, by using the blue ‘Filter’ boxes at the head of most columns. To get to the Annotation Download table from the front page of QuickGO, click on the ‘Find, View and Download sets of GO annotations’ link, the resulting table contains all the GO annotations in the GOA database, so is a good place to start customizing an annotation set.
Filtering by protein/gene identifier
Click in the blue filter box at the top of the ‘ID’ column (Figure 4).
Type or paste into the text box one or more sequence identifiers. Several types of identifier may be searched including; UniProtKB, Ensembl, Gene ID, RefSeq, TAIR, FlyBase, MGI, etc.
By default QuickGO will display UniProtKB accessions, even if another identifier type was searched. To display the annotations with the identifier type that was searched, click on the blue filter box at the top of the ‘DB’ column and choose the appropriate database identifier type.
Click outside of the filter box and click the ‘Load’ button to display annotations to the selected gene products.

Filtering by protein/gene identifier. This filter is used to find annotations to a list of genes or proteins; several sequence identifier types can be searched in QuickGO.
Filtering by taxonomy
Click in the blue filter box at the top of the ‘Taxon’ column (Figure 5).
Either type or paste into the text box one or more taxonomic identifiers, or select one or more taxons from the list, or click on the link to find a taxonomic identifier from the UniProtKB taxonomy database.
Click outside of the filter box and click the ‘Load’ button to display the filtered set of annotations.
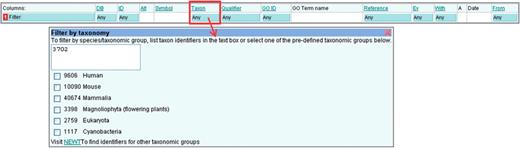
Filtering by taxonomy. This filter is used to find annotations to selected species; common taxon identifiers are provided, alternatively a list can be entered into the text box or the link to UniProtKB Taxonomy can be used to search for identifiers.
Filtering by GOID
Click in the blue filter box at the top of the ‘GO ID’ column (Figure 6).
Type or paste into the text box one or more GO IDs.
Select how the GO IDs are to be used, either;
Use these terms as a GO slim: map-up annotations to the set of GO terms to provide an overview of a list of proteins’ attributes (for more on GO slims see below).
Find annotations to these terms: display all direct annotations made to the selected GO ID(s).
Find annotations to descendants of these terms: display all annotations made to the selected GO ID(s) and their child terms.
Click outside of the filter box and click the ‘Load’ button to display the filtered set of annotations.
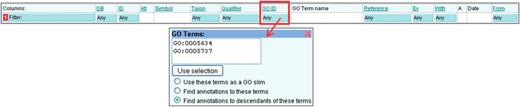
Filtering by GO identifier. Annotations to particular GO terms can be displayed by using this filter. The chosen terms can also be used to create a GO slim.
Filtering by evidence code
Click in the blue filter box at the top of the ‘Ev’ column (Figure 7).
Select the evidence code(s), e.g. to see only annotations made with manual experimental evidence codes select ‘Manual Experimental’, to see only electronic annotations select ‘IEA’.
Click outside of the filter box and click the ‘Load’ button to display the set of annotations made with the chosen evidence codes.
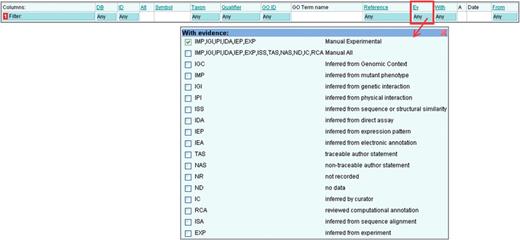
Filtering by Evidence Code. This filter is used to find annotations made using selected evidence codes, for example the electronic annotations (IEA code) could be filtered out.
Mapping annotations to a different sequence identifier
Click in the blue filter box at the top of the ‘DB’ column (Figure 8).
Select the database sequence identifier type to be displayed (by default QuickGO displays UniProtKB accessions, e.g. P12345).
Click outside of the filter box and click the ‘Load’ button to display annotations to the selected identifier type.
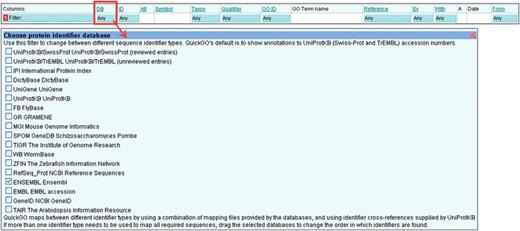
Mapping annotations to a different sequence identifier. QuickGO displays annotations to UniProtKB accessions by default, but is able to map annotations to a number of different identifier types.
User tutorials
We will now see how more complex questions can be answered with the help of QuickGO.
The first two cases are queries that were sent to the GO helpdesk and represent what many users would like to achieve. The final two cases describe more novel applications of QuickGO that researchers may find useful.
Case 1. How to find GO annotations in a particular area of biology
Topics covered include:
Customizing a set of annotations by filtering on GO term and taxonomic identifier.
Mapping annotations to a different sequence identifier.
Reviewing a filtered annotation set using QuickGO's annotation statistics.
Downloading a filtered protein list.
Question: “I'm currently working on zebrafish, and I would like to get a list of all genes implied in the development. What is the easiest way to get that list? The best for me would be to get Ensembl IDs of the genes, but other IDs would be ok.”
The user may find that he has to go to several different resources to find the information he requires; however, this question can be answered completely and very easily with QuickGO alone by utilizing its filtering and identifier mapping capabilities. Here, users can choose to see annotations with identifiers such as UniProtKB, Ensembl, RefSeq, FlyBase, etc.
Here is how to obtain these results with QuickGO: Therefore, in these few simple steps we have been able to retrieve a set of annotations that would have either taken several resources to obtain or more advanced computing knowledge to extract the information from a gene association file.
The starting point for obtaining a custom set of annotations is the Annotation Download (http://www.ebi.ac.uk/QuickGO/GAnnotation) page. This page displays a table of an initial set of all GO annotations available from GOA (Figure 9). This page is also accessed from the ‘Find, View and Download sets of GO annotations’ link on the front page of QuickGO (Figure 2). The annotations in this table can be filtered according to your needs by using the blue ‘Filter’ boxes, which appear at the top of many of the table's columns.
To obtain the set of annotations the user requires, the annotations must be filtered by database identifier, taxon and GO term (Figure 10). First, click on the blue filter box in the ‘DB’ column and select ‘Ensembl’, then click on the ‘Taxon’ filter box and type ‘7955’, the taxon identifier for D. Rerio, into the text box, finally click on the ‘GO ID’ filter box and type in ‘GO:0032502’ the GO identifier for ‘developmental process’, also within this box ensure that the option to ‘Find annotations to descendants of these terms’ is selected.
Now all the filters have been applied, click outside of any filter box that is open and click on the ‘Load’ button that is now displayed. Initially, only the first 25 annotations will be displayed in the table, to see more annotations you can either page through or, alternatively, increase the sample size at the bottom of the table and click ‘Refresh’.
A number of blue ‘Statistics’ boxes will also appear—these provide further information on the subset of annotations selected. For instance, clicking on the ‘Statistics:’ button (Figure 11) will display the total number of annotation rows returned. We can see from the statistics that are produced with this custom annotation set that there are over 3000 annotations, of which almost 900 are IEA-evidenced annotations (Figure 11).
In the original query the user required a list of Ensembl identifiers, a list of unique identifiers present in this annotation set can be downloaded by selecting the ‘proteinList’ download option at the bottom of the annotation table. To ensure the entire list of sequence identifiers is included in the download, increase the Download ‘limit’ to the number of unique identifiers in the set (found in the blue statistics box in the ‘ID’ column, Figure 11).
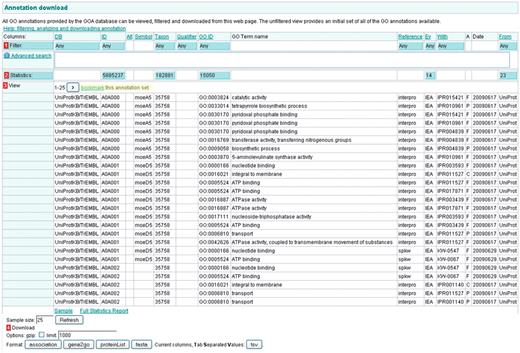
The Annotation Download page is the starting point for creating custom sets of GO annotation. Annotations can be filtered using the blue ‘Filter’ boxes in the row labelled with a red ‘1’, clicking on a blue box will result in a pop-up box explaining what filtering options are available on that column. Statistics are available for many of the columns and are calculated on the fly as annotation sets are refined. Statistics are accessed from the blue boxes in the row labelled with a red ‘2’. Data from the annotation set can be downloaded in various formats – the options are shown at the red ‘4’ – but the limit must be set for the number of annotations in the set (obtained from the blue ‘Statistics’ box). There is also an option to gzip the download file. Annotation sets may be bookmarked by clicking on the ‘bookmark this annotation set’ link (yellow highlight).
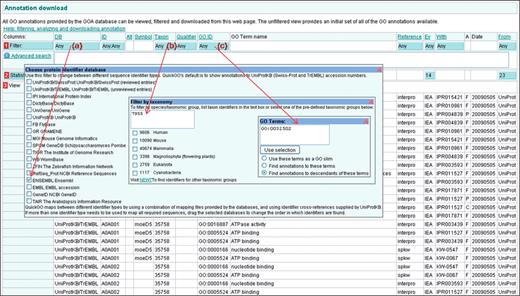
Case 1. Customizing a set of annotations by selecting a sequence identifier-type and filtering on taxonomic identifier and GO term. (a) The ‘DB’ filter is used to change between identifier types. (b) Enter a taxonomic identifier or click the link to search for one. (c) Enter a GO term identifier and select the ‘Find annotations to descendants of these terms’ to find annotations to that GO term and its child terms. Once all the required filters have been selected, click outside of the filter box and then click on the ‘Load’ button to see the customized set of annotation.

Case 1. A customized annotation set. Ensembl identifiers have been selected (yellow highlight); (a) statistics for the evidence codes—almost 900 are electronic annotations; (b) the ‘statistics’ box displays the number of total annotations in the set; the user required a list of genes implicated with developmental process, this list can be downloaded using the ‘proteinList’ format download option (red box).
Case 2. How to find GO annotations for a list of proteins from a proteomic experiment
Topics covered include:
Customizing a set of annotations by filtering on protein accession and an entire ontology.
Reviewing a filtered annotation set using QuickGO's annotation statistics.
Bookmarking a specific filtered annotation set.
Downloading a specific filtered annotation set.
Mapping up annotations using a GO slim.
Viewing relationships between terms in the chart view.
Question: “I have a list of SwissProt accession numbers from a proteomics experiment. I am looking for a tool that will let me input (in batch mode) this list of accession numbers and give as output the GO annotation for cellular localization. I prefer this to be in a tab delimited format, such that the GO annotations can be viewed in Excel.”
Since we do not have the list of identifiers from the user, for this exercise we will use a list of breast cancer-associated proteins which were identified in a study by Tripathi et al. (13). The list is supplied as Supplementary Data available from the journal website.
First, go to the Annotation Download (http://www.ebi.ac.uk/QuickGO/GAnnotation) page to retrieve all GO annotations available from GOA (Figure 9).
To obtain annotations to a list of UniProtKB accessions, click on the blue filter button in the ‘ID’ column and copy and paste the list of breast cancer-related accessions into the pop-up box, which appears (Figure 12).
To limit the annotations to those made to the Cellular Component ontology, click on the filter box in the ‘GO ID’ column and type ‘GO:0005575’ for the GO term ‘cellular_component’ and check that the ‘Find annotations to descendants of these terms’ button is also selected (Figure 12), this will ensure that annotations made to all cellular component GO terms for the selected list of accessions are displayed in the results. Click outside of the filter box and then click on the ‘Load’ button. Initially, only the first 25 annotations will be displayed in the table, to see more annotations you can either page through or, alternatively, increase the sample size at the bottom of the table and click ‘Refresh’.
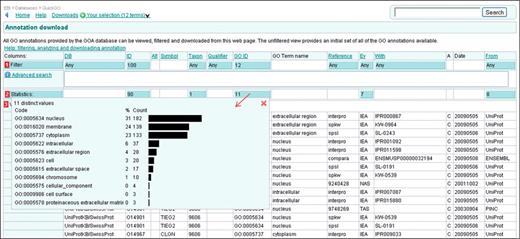
Clicking on the blue statistics box in the GO ID column will provide you with both counts and percentages of the GO terms applied in the selected annotation set (Figure 13). These data values can be copied and pasted into a suitable spreadsheet program for further manipulation, e.g. creating a bar graph for publication. A full statistics report can be viewed by clicking on the ‘Full Statistics Report’ link at the bottom of the annotation table (see Figure 11).
Once an annotation set has been customized, it is possible to bookmark it so it can be later retrieved without having to reapply the filtering. By clicking on the ‘Bookmark this annotation set’ link (see yellow highlight in Figure 9), QuickGO will produce a URL, visible in the location bar, which can be used to re-run the chosen filtering on the current annotations in the GOA database. It is important to note that the bookmark does not archive an annotation set from a particular point in time, the results of the applied filtering will be re-calculated using the current contents of the database. This is useful if you want to look at changes in your annotation set over time, since each time you return to the bookmarked set the annotation provided will be the most up–to-date.
To download the tailored annotation set, change the number in the ‘Download limit:’ box to the total number of annotations returned (as displayed in the ‘Statistics:’ box); the default limit is 1000, so if the set contains more than 1000 annotations and the limit is not changed, not all of them will be downloaded. The user required a tab-delimited formatted file of the annotation set, this can be obtained by selecting the download options ‘TSV’ (Tab-Separated Values) or ‘Association’ (Gene Association File format) at the bottom of the annotation table—the file will be downloaded to your computer. There is an option to compress the file (gzip) which will enable faster uploads of the data.
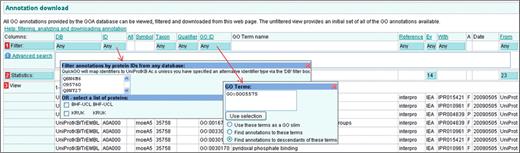
Case 2. The GOA annotation set is filtered by inputting a list of UniProtKB protein accessions into the ‘ID’ filter box and the GO ID for ‘cellular component’ into the ‘GO ID’ filter box and finally choosing to find annotations to the child terms of cellular component. Clicking away from the filter box will reveal a ‘Load’ button, which will produce a table of the customized annotation set.

Case 2. The GO ID statistics displays all the GO terms in the annotation set and a percentage and count of each GO term. These statistics are useful for creating bar graphs for publication.
GO slims
When users have a large number of proteins or genes which they would like to functionally characterize (as in user case 2, above), they might be interested in generating an overview of the main cellular compartments (or molecular functions or biological processes) the proteins are located in. Such an analysis can be achieved by utilizing a GO slim, a subset of more general GO terms. Annotation sets can be ‘mapped-up’ to selected high-level terms using the ‘true path rule’, which means that an association of a protein with a GO term must be equally true for all the parents of that term, e.g. if a protein is directly annotated to the term ‘Golgi apparatus’ it must be also true that the protein could be annotated to being part of the cytoplasm—as ‘cytoplasm’ is a parent term of ‘Golgi apparatus’. QuickGO contains various GO slims which are maintained by the GO Consortium, such as slims targeted towards a particular taxonomic range, e.g. yeast or plant, as well as more general GO slims applicable to many species and areas of biology. QuickGO users can either directly use such pre-defined slims, or alternatively choose to change them, or create their own slims. GO slims are a common way to summarize the functional attributes of a list of genes or proteins from large-scale studies and can give added meaning to a dataset (14–16).
GO slim for case 2
The user from Case 2 might additionally have been interested in displaying an overview of the cellular compartments their list of proteins are located in. We will now see how the user could have achieved this in QuickGO by using the 12 cellular component terms from the GOA slim.
From the front page of QuickGO, click on the link ‘goslim_goa’ (Figure 2), this will display all of the GO slim terms from that subset.
To select only those terms in the cellular component ontology click on the green ‘add’ button next to each of the GO terms, this will add those terms to ‘your selection’ basket (see link in Figure 2).
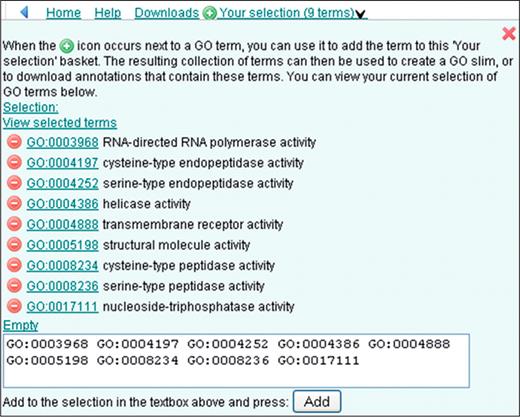
While viewing ‘your selection’ basket you can choose to ‘view selected terms’, this will display the GO slim page (Figure 14) where the selected terms are displayed with a number of options of how to use them. Terms can be added or removed from this list using the relevant buttons or by changing the list of GO terms at the bottom of the page and updating. The terms can be viewed in context with each other by selecting all of the terms and clicking on ‘Chart’.
To slim up annotations to this subset of terms click on ‘Use these terms as a GO slim’ and then ‘Find’, initially this action will slim up all of the GO annotations in the GOA database, to restrict the annotations to only those associated with the list of breast cancer-related proteins, simply paste the list of accessions into the filter box in the ‘ID’ column and then click ‘Load’ to see the annotations.
The statistics for the number of annotations to each GO term can be accessed in the blue statistics box in the ‘GO ID’ column (Figure 15). The most frequent cellular component term annotated to this set of proteins is ‘nucleus’.
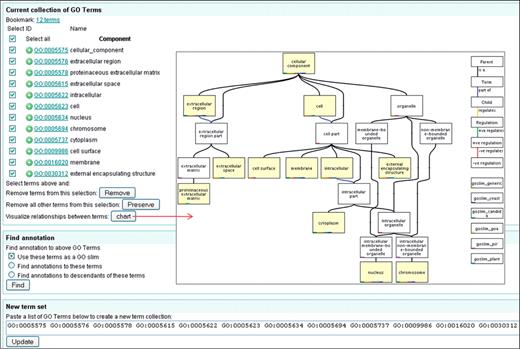
Case 2. Mapping-up annotations using a GO slim (I). The GO slim page of QuickGO containing the 12 GO terms is shown. Terms can be added or removed from the list on this page and terms can be charted to show their relationship to each other. Once a set is finalized, annotation can be mapped-up by selecting to use the terms as a GO slim.
Case 2. Mapping–up annotations using a GO slim (II). Annotations to proteins from the breast cancer-related list were slimmed to 12 cellular component terms to give an overview of the location of these proteins. The table displays the slimmed-up cellular component annotations for the list of proteins. The ‘GO ID’ statistics shows the percentage and count of annotations to each term. These statistics are useful for producing a bar graph for publication.
Case 3. How to find proteins which have only a predicted activity with no associated experimental evidence
Topics covered include:
Advanced querying in QuickGO; using Boolean operators to combine queries.
Reviewing a filtered annotation set using QuickGO's annotation statistics.
Downloading a specific filtered annotation set.
Downloading a filtered protein list.
QuickGO is well placed for finding gene products that only have predicted (electronic) evidence for a particular attribute since it includes annotations that have been applied by electronic prediction methods. In addition to using the filtering options in QuickGO, annotation sets can be customised using the ‘Advanced Search’, which uses Boolean operators to construct more complex queries. The ability to find gene products that only have a predicted function could be a valuable tool for researchers looking to focus their research. An example might be a scientist studying serine-type endopeptidases who wants to find proteins which are predicted to have this activity but where no experimental assay has been performed. Such a list could be then be used in further investigations as to whether the predictions are true. Documentation on how to use the Advanced Search can be found in the QuickGO Reference Manual (http://www.ebi.ac.uk/QuickGO/reference.html#advanced_annotation).
Here is how a query for finding predicted serine-type endopeptidases would be performed in QuickGO.
- In the Annotation Download (http://www.ebi.ac.uk/QuickGO/GAnnotation) page, type the following query into the ‘Advanced Search’ box;This will search for annotations to human proteins which are annotated to the GO term ‘serine-type endopeptidase activity’ and exclude any proteins that have annotations to this term using manual evidence codes. Note that ‘∼’ is a special character which results in proteins being searched rather than annotations (Figure 16).

By looking in the blue statistics boxes, we can see that this query results in 1258 annotations to 499 proteins. Only the GO term ‘serine-type endopeptidase activity’ is represented because it has no child terms. Using the bookmarking facility the query can be re-run on the current QuickGO data to see how the results may have changed.
The scientist could now either download a list of proteins using the ‘proteinList’ option or they could look at what type of prediction methods generated these annotations by downloading them in Gene Association or TSV format. By looking at the types of method used to predict the annotations, researchers could choose proteins which have this activity predicted by several different electronic methods, thus increasing their confidence that this protein is likely to have this activity and should be experimentally verified.
An example of a protein which has more than one electronic method predicting serine-type endopeptidase activity is the human protein tissue-type plasminogen activator (UniProtKB: P00750) which is predicted to have the activity based on three electronic annotation methods; from the Swiss-Prot keyword2GO pipeline, it has the keyword ‘Plasminogen activation’ which has been mapped to the GO term ‘serine-type endopeptidase activity’; from the InterPro2GO pipeline, the sequence contains three domains; Peptidase S1 and S6 (IPR001254), Peptidase S1/S6 (IPR018114) and Peptidase S1A (IPR001314); and through the Ensembl Compara orthology prediction pipeline, as the mouse ortholog (UniProtKB: P11214) has been found to have experimental evidence for this activity. (Figure 17; blue highlight).
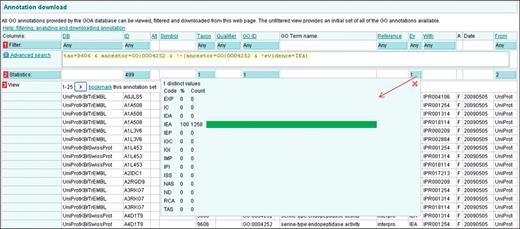
Case 3. Advanced querying in QuickGO. QuickGO is well placed for finding proteins that have no experimentally evidenced annotation since it is one of the few web-based GO browsers to include IEA annotations. This query (yellow highlighting) shows all human proteins which are annotated to the GO term ‘serine-type endopeptidase activity’ using only electronic annotation methods. The list of proteins could be used as a basis for designing experiments.
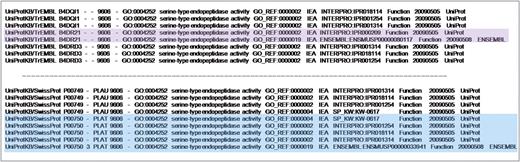
Case 3. Excerpt from a tab separated values file of electronic annotations to the GO term ‘serine-type endopeptidase activity’ for human proteins including the electronic methods used to make the predictions. Proteins B4DR21 (purple highlight) and P00750 (blue highlight) have annotations predicted by more than one electronic method, increasing the confidence that the predicted activity may be carried out.
Of course, it is important to note that gene products may actually have published experimental evidence for an activity which has not yet been annotated. The scientist must decide which proteins are worth investigating, but this search is a good place to start.
Case 4. How to determine which enzymatic activities usually occur with a given biological process
Topics covered include:
Simple searching.
Finding commonly co-annotated GO terms.
Using co-occurence statistics.
A biological process or pathway consists of a number of steps, each of which may be controlled by different proteins. In the literature it is easy to find links between a protein's activity and a process it is involved in, for example an author may be studying phosphofructokinase enzymes and describe their involvement in glycolysis. In GO, however, these attributes have been divided into two separate ontologies; molecular function and biological process. Currently, there are no links between these ontologies and so it can be quite difficult to determine which activities are linked to which processes. Similarly, it is common knowledge that glycolysis occurs in the cytoplasm but, in GO, there is no link between biological process and cellular component that would indicate this.
A feature has been implemented in QuickGO, which allows the user to view which GO terms are commonly co-annotated to a gene product. The next example will demonstrate that by using co-occurrence statistics, information can be inferred about a process, activity or subcellular location simply by viewing what GO terms are commonly co-annotated to the same gene products.
This example will use the term ‘apoptosis’ to infer what types of enzyme activities are associated with this process and where in the cell proteins involved in apoptosis are located.
To start with we must view the entry page for the GO term ‘apoptosis’. A simple search for ‘apoptosis’ from the front page of QuickGO (Figure 2) will bring up a list of GO terms related to this keyword, selecting the term ‘GO:0006915 apoptosis’ will take us to this term's information page.
To access the co-occurrence statistics, click on the tab ‘Co-occurring Terms’ (Figure 18), a list of evidence codes will be displayed which are all selected by default. For this example we will leave them all selected to search for annotations with all evidence codes. Click on ‘Update’ to start the calculation.
A table will appear which contains a ranked list of terms, which are often annotated to the same proteins as the selected term (Figure 18). For each compared term four statistics are calculated: (a) # Compared: the number of proteins in which the compared term is annotated; (b) # Together: the number of proteins in which both the compared and selected terms are annotated; (c) S%: the significance of the overlap, calculated as the fraction of proteins annotated to both terms in the set of proteins annotated to either. S%=#together/(#selected+#compared-#together) (d) PR: the protein annotation ratio, calculated as the ratio of the fraction of proteins annotated to the compared term in the set of proteins annotated to the selected term, to the fraction of proteins annotated to the compared term in the set of all annotated proteins. PR=(#together/selected)/(#compared/#all).
By selecting the most common ‘activity’-type GO terms co-assigned with ‘apoptosis’, we can see whether there is any significant enzyme activity associated with this process. Terms above an S% of 1.00 were selected by clicking on the green ‘add’ icon next to the GO term, this adds the term to ‘your selection’ basket (Figure 19).
The set of terms can then be viewed in context to each other by clicking on ‘view selected terms’ in your basket, selecting all of the terms and clicking on ‘Chart’ (Figure 20). The enzyme activities, which commonly occur with apoptosis, now can be easily determined. In this case six out of the nine activity terms selected have the common parent term ‘hydrolase activity’, suggesting proteins with this activity are likely to have a role in apoptosis. In fact, four out of the six hydrolase terms are more specifically peptidase activity—enzymes with this activity (e.g. caspases) are known to have a role in apoptosis (17, 18).
Similarly, we could determine whether gene products involved in apoptosis are located in a particular subcellular region. By selecting the most common cellular component terms from the co-occurrence table (as demonstrated above) and then viewing these in context with each other as a chart (Figure 21), we can see that the component terms commonly co-annotated with apoptosis are widespread, including cytoplasm, nucleus, membrane and endoplasmic reticulum. This suggests that proteins involved in apoptosis are located in many regions of the cell.
Another example of using the co-occurrence statistics would be to find out what activity or biological process terms are commonly associated with a subcellular location. We can find out which terms are commonly co-annotated with the cellular component term ‘Golgi apparatus’ by following the same procedure as detailed above. Two terms, which commonly occur together with Golgi apparatus, are ‘galactosyltransferase activity’ and ‘protein amino acid glycosylation’ which are both known to occur in the Golgi (19, 20). The process term ‘vesicle-mediated transport’ is also frequently co-annotated with Golgi apparatus and is a major role of the Golgi (21).

Case 4. Co-occurrence statistics for the term ‘apoptosis’. Users can choose which evidence codes should be used in the calculation. Commonly co-annotated terms are shown.
Case 4. ‘Your selection’ basket. Terms can be collected, whilst browsing, by clicking on the green ‘add’ button. The selected terms and their relationship to each other can be displayed as a chart by clicking the ‘View selected terms’ link.
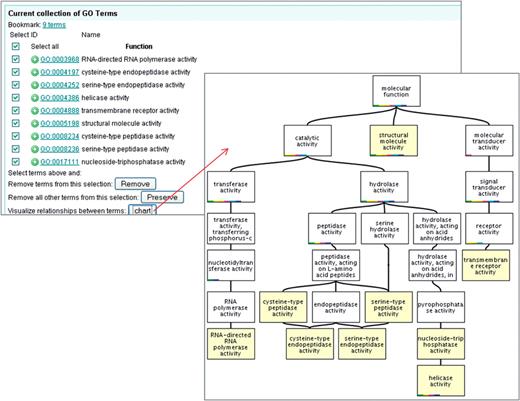
Case 4. ‘Activity’ terms commonly co-occurring with ‘apoptosis’. The activity-type terms were selected and viewed in context as a chart to make it easy to see any significant enzyme activities associated with apoptosis.
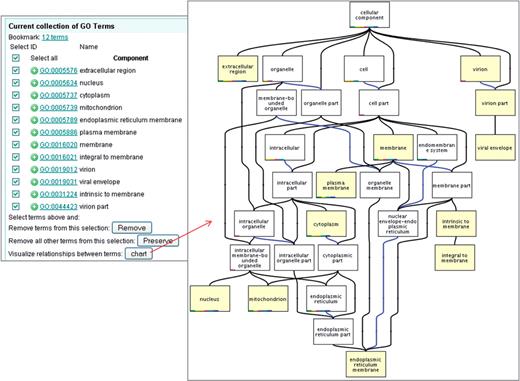
Case 4. Subcellular location terms commonly co-occurring with ‘apoptosis’. The cellular component terms were selected and viewed in context as a chart to make it easy to see any significant subcellular locations associated with apoptosis-related gene products.
Conclusion
QuickGO is a fast web-based tool for the Gene Ontology, more than just a simple GO browser it is also a tool for analysis of GO terms and GO annotations. It has proven useful for curators browsing for GO terms as well as for users wanting to analyse gene/protein lists from large-scale experiments. QuickGO was recently redeveloped to include more advanced features than it had previously, such as the ability to: retrieve annotations for either a list of gene products or a list of GO terms, create customized annotation sets which can be bookmarked for later retrieval, provide statistics on various aspects of an annotation set, perform GO slim analysis, query the GOA database using Boolean operators, download sets of annotations or protein lists, find GO terms which are commonly co-annotated, and compare two or more GO terms and their relationships in a chart diagram. This tutorial has given an in depth look at some of the more complex tasks that can be performed in QuickGO, which the user may not be aware are available, and hopefully it has demonstrated that even these complex tasks do not require the user to have significant programming knowledge which is often the case when using other GO analysis tools.
Useful resources
GOA website: http://www.ebi.ac.uk/GOA/
QuickGO video tutorials: http://www.ebi.ac.uk/QuickGO/tutorial.html
QuickGO FAQs: http://www.ebi.ac.uk/QuickGO/FAQs.html
GO Consortium: http://www.geneontology.org/
GO Consortium evidence code guide: http://www.geneontology.org/GO.evidence.shtml
Other GO browsers/analysis tools: http://www.geneontology.org/GO.tools.shtml
Email addresses:
GO helpdesk: gohelp@genome.stanford.edu
Contact GOA: goa@ebi.ac.uk
Funding
The Biotechnology and Biological Sciences Research Council, Tools and Resources Fund (BB/E023541/1); the National Human Genome Research Institute (HG002273); and core EMBL funding. Funding for open access charge: National Human Genome Research Institute (2P41HG02273-07).
Conflict of interest. None declared.
Acknowledgements
We would like to thank Ruth Lovering and Varsha Khodiyar for testing of QuickGO during its redevelopment and Yasmin Alam-Faruque for critical reading of the manuscript.
References
Glossary
- Annotation
a specific association between a gene product and a Gene Ontology term.
- Biological Process
one of the Gene Ontologies; terms describe a recognised series of events or molecular functions.
- Cellular Component
one of the Gene Ontologies; terms describe where in the cell a gene product can be located.
- Evidence Code
one of a number of three letter codes indicating how an annotation to a particular term is supported.
- Gene Association File
a tab-delimited file containing all the information required for complete GO term-gene product associations.
- GO browser
a computer tool designed for viewing the Gene Ontology and/or its associated gene product annotations.
- GO slim
A subset of terms from the Gene Ontology used to provide a general overview of attributes for a set of gene products.
- Molecular Function
one of the Gene Ontologies; terms describe the activities or jobs which a gene product can perform.
