


Abstract
G-protein coupled receptors (GPCRs) are a major family of membrane receptors in eukaryotic cells. They play a crucial role in the communication of a cell with the environment. Ligands bind to GPCRs on the outside of the cell, activating them by causing a conformational change, and allowing them to bind to G-proteins. Through their interaction with G-proteins, several effector molecules are activated leading to many kinds of cellular and physiological responses. The great importance of GPCRs and their corresponding signal transduction pathways is indicated by the fact that they take part in many diverse disease processes and that a large part of efforts towards drug development today is focused on them. We present Human-gpDB, a database which currently holds information about 713 human GPCRs, 36 human G-proteins and 99 human effectors. The collection of information about the interactions between these molecules was done manually and the current version of Human-gpDB holds information for about 1663 connections between GPCRs and G-proteins and 1618 connections between G-proteins and effectors. Major advantages of Human-gpDB are the integration of several external data sources and the support of advanced visualization techniques. Human-gpDB is a simple, yet a powerful tool for researchers in the life sciences field as it integrates an up-to-date, carefully curated collection of human GPCRs, G-proteins, effectors and their interactions. The database may be a reference guide for medical and pharmaceutical research, especially in the areas of understanding human diseases and chemical and drug discovery.
Database URLs:http://schneider.embl.de/human_gpdb; http://bioinformatics.biol.uoa.gr/human_gpdb/
Background
Signal transduction refers to these cellular processes by which stimuli, either physical or chemical, induce specific cellular responses, through chosen molecular mechanisms. The specificity of a cellular response to a signal depends on the receptor expressed on the target cell.
G-protein coupled receptors (GPCRs) are a very important superfamily of cell membrane receptors in eukaryotic cells. They may interact with both the environment outside and inside the cell and they play a crucial role in receiving stimuli signals from the environment. In response they induce certain cellular responses. GPCRs have a characteristic structure comprised of seven transmembrane-spanning α-helices, an extracellular N terminus, an intracellular C terminus and three interhelical loops on each side of the membrane (1). Several classification systems have been used for this superfamily categorization. The most frequently system used (2,3) classifies GPCRs in six classes, based on their sequence homology and their functional similarity. These are: Class A or 1 Rhodopsin-like, Class B or 2 Secretin receptor family, Class C or three Metabotropic glutamate/pheromone, Class D or four Fungal mating pheromone receptors, Class E or five Cyclic AMP receptors and Class F or six Frizzled/Smoothened like, first presented by (4). GPCRs that are not yet characterized or classified are called orphan GPCRs. Furthermore, a number of putative classes of some newly discovered GPCRs exist, whose nomenclature has not yet been accepted by the scientific community (5,6). Ligands bind to GPCRs on the outside of the cell, activating the GPCRs by causing a conformational change, and allowing them to bind to G-proteins (7).
G-proteins form heterotrimers composed of Gα, Gβ and Gγ subunits, which possess a binding site for a GTP or a GDP molecule. They are characterized by their α-subunits, which are further grouped into the Gαs, Gαi/o, Gαq and Gα12 families (8). The stimulation of GPCRs leads to the activation of G-proteins, which dissociate into their Gα and Gβγ subunits. The subunits then activate several effector molecules that lead to many kinds of cellular and physiological responses (1). Effectors form a diverse group of proteins through their interaction with G-proteins that act either as secondary messengers, or lead directly to a cellular and physiological response. Many proteins such as tubulins, adenylate cyclases, ion channels and others act as effectors (5). GPCRs, G-proteins, effectors and their interactions compose one of the main mechanisms for signal transduction and activation or deactivation of pathways within the cell. A large part of efforts towards drug development today is focused on finding chemicals that affect the ability of ligands to bind to GPCRs (9) either to inhibit or accelerate certain cellular processes. GPCRs play a crucial role in a wide range of human diseases.
Human-gpDB was developed as a tool for integrating together human GPCRs, G-proteins and effectors. It does not only present how they interact with each other but it also reveals information about the pathways they are involved in. Human-gpDB was built as a useful tool for drug research and as a platform that reveals new patterns for therapeutic paths.
Construction and content
Data integration
Our initial step was to collect sequence information individually about human GPCRs, G-proteins and effectors from the UniProt/Swissprot database (10). The entries were acquired using suitable scripts written in Perl in order to parse the DE (description), the GN (gene) or the DR (database cross reference) field of a respective database entry. The data sets were then checked manually in order to eliminate duplicates. Our main goal was to include database unique entries from UniProt/SwissProt. Perl scripts were used for data manipulation.
For each of the three sets, the next step was to isolate and keep these proteins that have at least one connection with another protein, a GPCR with a G-protein and a G-protein with an effector and vice versa. For the extraction of information concerning the connections between human GPCRs, G-proteins and effectors, an extensive literature search was performed attempting to detect terms that co-occur in the same abstract and are biologically related. None of the available text mining engines was used in order to avoid false negative results and to increase the reliability of the results that are presented. Currently the database holds 1663 connections between GPCRs and G-proteins and 1618 connections between G-proteins and effectors. In addition, PubMed reference articles that provide the literature support for each recorded connection are included.
Efficient ways were used to show how G-proteins and effectors might be categorized into families, subfamilies and types. G-proteins’ classification is the most commonly used and is based on their α subunits sequence homology, while effectors’ classification is based on their function. Many different classifications exist regarding GPCRs; the classification used here was according to the IUPHAR classification (2). All classifications were done manually.
UniProt (10) identifiers were used as starting points to integrate the Human-gpDB with various external data sources. The systems that were used to help us with this integration were ENSEMBL (11), BioMart (12) and SRS (13). For each of the proteins, information about the name, the sequence, the description, the family and the subfamily it belongs to, together with the full record coming from the Dasty2 DAS client (14) was collected. Furthermore, a collection of a vast variety of linked identifiers was obtained, to enrich the information for each protein. Thus, information comes from various databases like for example Uniprot (10), RefSeq Proteins (15), Entrez Proteins (16) and Ensembl Proteins databases (11). Information about the gene location and its properties are provided from Ensembl (11), EMBL (17), EntrezGene (18), RefSeq DNA (15) and UniGene databases. Domain links are provided for Smart (19), InterPro (20) and Pfam (21,22) databases. Structures are linked to PDB (23), HSSP (24) and PSSH (25) databases. Information about diseases comes from the OMIM (26) database and information about protein function from the Gene Ontology (27) database. Chemical information is provided by HMDB (28) and DrugBank (29) and pathway information comes from KEGG (30), Panther (31) and Reactome (32) databases. Drugs related to three categories of molecules of Human-gpDB (GPCRs, G-proteins, effectors) were collected from DrugBank (29), Madator (33) and AKS2 (34). All available interactions between drugs and the three categories of molecules of the database are presented to the user using visualization tools (see ‘Visualization’ section for more details). All of the aforementioned information was collected for each protein using ENSEMBL, BioMart and SRS and the results were stored in a MySQL database.
Going one step further, Human-gpDB is not only linked to other sources but it also comes with some analysis features to make the data integration part more useful. Therefore, Human-gpDB comes with domain architecture analysis, protein–protein/protein–chemical interactions and pathway enrichment that will be explained in detail in the ‘Utility and Discussion’ section below.
Implementation details
All the results are delivered to the user through a web application. The database was implemented in mySQL whereas for the graphical user interface (GUI), the HTML language was used. The dynamic parts of the interface, as for example the auto-complete forms and the advanced search capabilities, are supported by Javascript. The communication between the GUI and the database to extract information from Human-gpDB was achieved with the use of CGI scripts and all the calculations were performed using Perl. The entire application is set up behind an apache web server. The pop-up window that provides links to external or internal data sources was implemented with the help of the Overlib library. For the visualization, the Arena3D standalone Java application (35) was used to support the projections of large-scale networks whereas for smaller networks the Medusa Java applet (36) visualization tool was used. Figure 1 shows an overview of Human-gpDB web application.
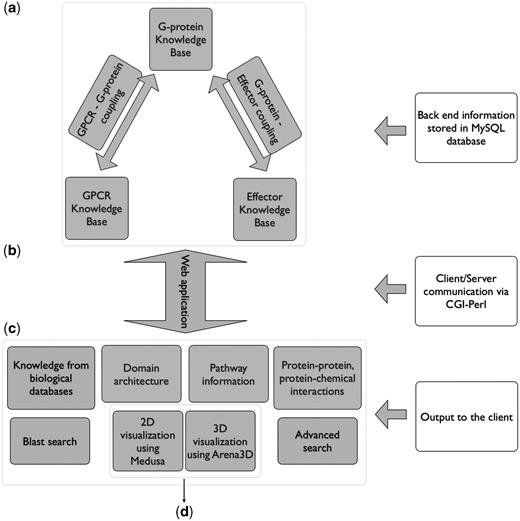
Over view of Human-gpDB web application. (a) Backend of the application consisting of manually collected information regarding GPCRs, G-proteins, effectors and their interactions as well as a wide range of publicly available information for each of these proteins stored in a MySQL database (‘Data Integration’ section for more details). (b) A CGI-Perl script handles the communication between the client and the server and (c) provides a wide range of information as output to the user (see ‘Utility’ section for more details). The system can be coupled with (d) a 2D visualization tool (Medusa) and a 3D visualization tool (Arena3D), which allows the easy visualization of the relationships between GPCRs, G-Proteins, effectors and the drugs (see ‘Visualization’ sections for more details).
Visualization
The visualization module in Human-gpDB was designed in such a way, in order to give maximum flexibility to the user to visualize the interactions between different knowledge domains (GPCRs, G-proteins, effectors, drugs related to GPCRs, drugs related to G-proteins and drugs related to effectors) at different levels (depths) by taking advantage of the hierarchical categories of GPCRs, G-proteins and effectors.
Medusa, a 2D visualization tool (36), was used to graphically visualize interaction partner bioentities such as proteins or drugs as they come from the DrugBank, MATADOR and AKS2 for each of the GPCR, G-protein and effector proteins. The newer version of Medusa tool that supports the current version of Human-gpDB is now more interactive and many layout algorithms are implemented that make the networks much more informative and the extraction of the biological knowledge easier. Like Arena3D, Medusa comes with a set of layout algorithms that are able to minimize the crossovers between the nodes and make the network visually simpler. Medusa is currently provided as a java applet.
To show either the whole network consisting of drugs, GPCRs, G-proteins, effector proteins and their interactions or some large scale sub-networks, the Arena3D standalone visualization tool (35) was used. According to Arena3D, drugs, GPCRs, G-protein and effectors were separated onto four different layers following a multi-layer graph concept, a stack of 2D networks. Arena3D among others currently comes with a clustering layout algorithm that is able to visualize very efficiently predefined distinct clusters. The separation of the clusters is done by placing the nodes that belong to the same cluster together either in 2D or 3D groups. The rich color scheme helps the user to immediately recognize which node belongs to which cluster since nodes that belong to the same cluster are colored similarly. Taking advantage of this functionality, GPCRs, G-proteins and effectors were clustered individually onto their different layers into families and subfamilies according to their properties as mentioned in the previous section, whereas drugs were not clustered. Arena3D is highly interactive and gives the opportunity to the user to isolate either individual,or a set of, connections that reaches his interests for a more focused research. Users can visually highlight and observe patterns that can be easier processed by the user. Such an example could be the answer to a question like whether a protein targets a specific protein family or not. In this version of Human-gpDB, pre-generated input files for the interaction networks are available for download and can be used as input files for the Arena3D application, since it is currently available as a standalone application only and not as a web based tool.
To visually show the domain structure, a static HTML view was implemented. For the pathway visualization, the KEGG schemas are given as they come from the KEGG database. The parts of the pathways that the proteins of the Human-gpDB are involved in are then highlighted to allow the users to easier mark and distinguish the signal transition paths that each protein gets involved in. This functionality is also a strong point of Human-gpDB since researchers can immediately see the influence of a specific protein on a pathway.
Utility and discussion
Browse section
In this section, information about the three distinct categories according to the protein type is presented. These are the ‘GPCRs’, ‘G-proteins’ and ‘effectors’ respectively. Each category of proteins is further sub-divided into classes, families, sub-families hierarchically. One can easily navigate the results by choosing the respective category and then by following the ‘+’ (expand) and the ‘−’ (collapse) button to navigate through the different levels of the hierarchy. Once the user fully expands these categories and goes to the lowest levels that contain the proteins, s/he can see some information about these proteins like the name, the description, the gene names, hyper links to UniProt and links to the relevant entry page, a summary sheet and visualization module (node level).
Entry page
The entry page of each protein contains information about the class, the family, the subfamily that each protein belongs to according to the IUPHAR (2) classification, the sequence and a variety of cross references to various available databases like the UniProt, EMBL, InterPro, PRODOM, GENEID, MIM, PRINTS and PFAM. In the entry page, links about proteins that interact with a selected protein in the form of a sorted list and link to node level visualization module. Redirections to the literature (PubMed) that reveal the evidence of the recorded interaction are also given, so that users can observe the biological relevance of each connection and see where the interaction comes from.
Summary sheet
It provides information about each individual protein coming from a vast variety of publicly available databases. The collected information is further split into different sections; these are labeled as genes, proteins, domains, structural features, diseases, gene ontology (GO), pathways, chemicals and orthology. The information of each section can be further explored by giving to researchers the opportunity to go deeper into the volume of knowledge in a more efficient way. All the information is presented under the same web page, which not only makes the exploration easier but it also reduces dramatically the loss of time that someone needs to find the information by browsing and querying the available databases. For example, if one checks the information in the section ‘Proteins’, he can see that it comes from four resources; these are ‘Ensembl Proteins’, ‘Entrez Proteins’, ‘RefSeq Proteins’ and UniPort. The information in these four resources related to the protein of interest is either complementary to each other or it provides additional evidence. Furthermore, Dasty2 DAS client links are given, to present many of the protein features. Simultaneously, a link to visualization module is provided to visualize the interactions between GPCRs, G-proteins and effectors graphically. In contrast to the entry page, the summary sheet provides to the user all the relevant information about how each protein is linked to other bioentities like genes, structures, diseases, pathways, domains, chemicals, etc. The links that are provided were explained in a previous paragraph of this section.
Visualization module
Human-gpDB provides a very flexible visualization module, where a user can select knowledge domains of interest, level or depth and also the tool in order to visualize the particular network of user’s choice. The user may choose to include all types of molecules (GPCRs, G-proteins, effectors, drugs related to GPCRs, drugs related to G-proteins and drugs related to effectors) in the network or some of them. Also the user can decide the level/depth (Class, Family, Subfamily, Type and Node) in which the visualization will be made. This feature is available for GPCRs, G-proteins, effectors, but not for drugs. Two visualization tools are offered as options: Medusa (36), for 2D representations, and Arena 3D (35), for 3D visualization. Drugs are not classified and thus they appear as individual nodes connected to the respective type of molecule (GPCRs, G-proteins and effectors). The main reason for giving the possibility to visualize the interactions at these levels is because otherwise the information gets overcrowded and it becomes difficult to clearly see the information. Arena3D software was chosen to overcome the problem of the 2D space limitations for visualizing larger scale networks. These networks consist of hundreds of nodes and hundreds of connections. The main feature of Arena3D is that it utilizes 3D space to project the data. Like Medusa, it also comes with efficient algorithms to minimize the crossovers between the connections so that the network becomes more informative. The Arena3D tool was used to visualize the interactions between Drugs, GPCRs, G-proteins and effectors for any selected category and any protein level. Simultaneously, the four different molecule categories were separated onto four different 2D layers by following a multi-layered graph representation. These are the Drug, the GPCR, the G-protein and the effector layers. Arena3D does not only visualize the nodes and the edges of the network but it can also very efficiently visualize precalculated clusters, which in the case of Human-gpDB, represent the subfamilies of the proteins (see ‘Visualization’ section for more details).
Pop-up window
While a user navigates through the data in the browse section, he/she may further answer questions that refer to a set of proteins that belong to a specific level of the hierarchy and not only to individual ones. A researcher for example, might want to see some information about the whole B or C class of the GPCRs or the ‘Gamma-aminobutyric’ acid receptor subfamily. This way, a user may explore the biological knowledge related to each category and sub category by following the hyperlinks provided by a pop-up window after clicking on highlighted names. The information that a particular user may retrieve about a set of proteins is explained below.
Knowledge from biological databases
Biological information from different databases for all of the members of the selected category and sub category are displayed in a table view. A variety of sorting choices is provided so that researchers can sort the target proteins according to their names, their description, the family, the class or the subfamily that they belong to if any.
Domain architecture
A static comparative domain architecture view in order to detect patterns and investigate if the selected category possesses specific structural features is provided. Domain information of each protein was collected from the SMART database and a HTML based visualization tool was developed, to display this knowledge. In this view, each protein is hyperlinked to the SMART and ENSEMBL databases. Mouse actions over a specific domain allow the user to interact with the GUI interactively and get further information about the selected domain.
Pathway information
Each protein was mapped to KEGG pathways in order to find which pathways are enriched for the selected category. The results are provided in a tabular view accompanied by a KEGG pathway identifier, a pathway name and a list of proteins involved in that pathway. Each pathway is hyperlinked to a red flag, which ultimately displays the pathway, with the proteins from the selected category highlighted in red color.
Protein–protein and protein–chemical interactions
Information about protein–protein and protein–chemical interactions are provided by the STITCH database (37). The collection of this information was done through the available API. The generated networks do not only include proteins stored in Human-gpDB database but also proteins that are recorded in the STITCH database. These proteins do not necessarily belong to one of the three categories of proteins that Human-gpDB holds. The STITCH database (37) goes one step further by providing interacting proteins that were found experimentally besides proteins that co-occur in the literature. Together with the variety of information that STITCH database holds, this is the main reason why this tool was selected to provide to the user the relevant protein–protein and protein–chemical interaction networks.
Visualization
This feature of the pop-up window redirects the user to the Visualization module referring to the particular level of the tree [see Visualization module and ‘Visualization’ section (main manuscript) for more details].
Blast search section
This feature of Human-gpDB database gives the opportunity to the users to search for homologies by providing one or more protein sequences in Fasta format. Wu-BLAST (38) was used to align a given set of sequences against the selected protein categories of Human-gpDB like for example against the GPCR category. The user may provide the advanced blast options in order to narrow down the search results. The results are then grouped according to their category and sorted by significance. Each result that is found is then hyperlinked to an entry page, summary sheet and node level visualization module. Here, the user can see the alignments as well.
Advanced search section
This feature gives users the option to search the given fields in the database. The user can enter any word in one or more of the available boxes under the name: Gene/Protein, Class, Family, Subfamily, Type, Description and Function. Expressions in separate search fields are combined with the AND operator, so every entry of the result set will satisfy the expressions of all the search fields the user has chosen. The user has the option to choose whether the query will be performed against the GPCRs, the G-proteins or the effectors included in the database.
Results
The database currently holds information about 713 human GPCRs, 36 human G-proteins and 99 human effectors. The collection of information about the interactions between these molecules was done manually and the current status of Human-gpDB reveals information about 1663 connections between GPCRs and G-proteins and 1618 connections between G-proteins and effectors. GPCRs are categorized in four classes. Table 1 shows the number of families and subfamilies in each GPCR class, while Table 2 shows the distribution of GPCRs’ subfamilies based on the number of Gα families with which they interact. G-proteins are categorized in Gα, Gβ and Gγ groups. Gα consists of four respective families, as described initially in the ‘Backround’ section. From the 36 human G-proteins, 17 are characterized as Gα, 7 as Gβ and 12 as Gγ. Effectors are categorized in 20 families, 29 subfamilies and 63 types based on their biological function (Theodoropoulou, M.C., Bagos, P.G. and Hamodrakas, S.J., manuscript in preparation). The two most highly populated effectors’ families are Ion Channels and Tubulins.
Number of families and subfamilies in each GPCR class
| GPCRs’ Class | No. of GPCR Families | No. of GPCR Subfamilies |
|---|---|---|
| Class A | 55 | 640 (422 subfamilies of olfactory receptor) |
| Class B | 6 | 16 |
| Class C | 4 | 41 (29 subfamilies of taste receptors) |
| Frizzled/Smoothened | 2 | 11 |
| Total | 67 | 708 |
| GPCRs’ Class | No. of GPCR Families | No. of GPCR Subfamilies |
|---|---|---|
| Class A | 55 | 640 (422 subfamilies of olfactory receptor) |
| Class B | 6 | 16 |
| Class C | 4 | 41 (29 subfamilies of taste receptors) |
| Frizzled/Smoothened | 2 | 11 |
| Total | 67 | 708 |
Class A is the largest and consists of 55 families and 640 subfamilies (422 subfamilies of olfactory receptors). Class B consists of 6 families and 16 subfamilies. Class C consists of 4 families and 41 subfamilies (29 subfamilies of taste receptors). Frizzled/Smoothened class consists of 2 families and 11 subfamilies.
Distribution of GPCR subfamilies based on the number of Gα families with which they interact
| Couples with | No. of GPCRs’ Subfamilies |
|---|---|
| 1 Gα family | 623 |
| 2 Gα families | 48 |
| 3 Gα families | 15 |
| All 4 Gα families | 1 |
| Unknown coupling | 21 |
| Total | 708 |
| Couples with | No. of GPCRs’ Subfamilies |
|---|---|
| 1 Gα family | 623 |
| 2 Gα families | 48 |
| 3 Gα families | 15 |
| All 4 Gα families | 1 |
| Unknown coupling | 21 |
| Total | 708 |
One subfamily of GPCRs, the TSHR family, couples with members of all four Gα families. Most of the GPCR subfamilies couple with members of one Gα family (623 out of the 708 subfamilies of GPCRs). Fifteen GPCR subfamilies couple with members from 3 Gα families, whereas 48 couple with members from 2 Gα families. Twenty-one GPCR subfamilies do not have known coupling.
Visualization of the interactions between GPCRs, G-proteins, effectors and drugs together with the rich data integration part is one of the main features of Human-gpDB. As described in the ‘Visualization’ section Medusa application was used for 2D representation of the networks of interactions. Arena3D was chosen for 3D and more efficient representation of either the whole network of interactions or dense subparts of it. In order for the user to evaluate the visualization tools offered, five chosen different examples of visualization are given in Figures 2–6. Medusa, which is a Java applet, offers the user a first glance of the respective network. However Medusa still has disadvantages compared to Arena3D mainly due to the fact that the visualization it offers is in 2D so the space might be a limiting factor for larger or dense networks.
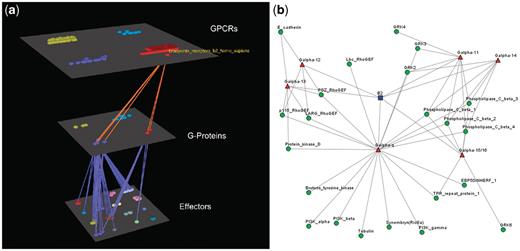
Visualization of human Bradykinin B2 receptor’s interactions (a) Arena3D Visualization: human Bradykinin B2 receptor targets six different subfamilies of Gα G-Proteins belonging to Gα-q/11 and Gα-12/13 families. The G-Proteins are connected to 22 different types of effectors belonging to nine families. (b) Medusa 2D Visualization: human Bradykinin B2 receptor targets Gα G-Proteins belonging to six distinct Gα subfamilies (Gα-q, Gα-11, Gα-14, Gα-15/16, Gα-12 and Gα-13). These Gα G-Proteins interact with 22 types of effectors.
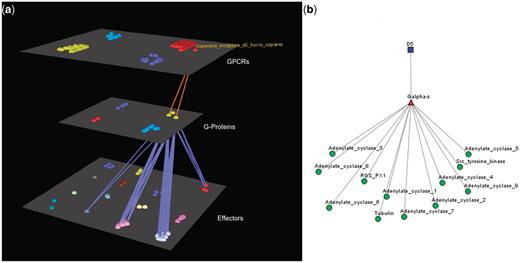
Visualization of human Dopamine D5 receptor’s interactions. (a) Arena3D Visualization: Human Dopamine D5 receptor targets two Gα-s G-Proteins. The G-Proteins are connected to 12 types of effectors belonging to four specific families. These are: Adenylate cyclases, Regulators of G-Protein signaling, Tyr protein kinases and tubulins. (b) Medusa 2D Visualization: human dopamine D5 receptor targets Gα-s G-Proteins, which interact with the following four families of effectors: Adenylate cyclases, Regulators of G-Protein signaling, Tyr protein kinases and tubulins.
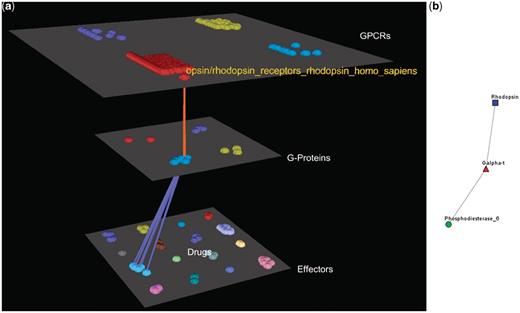
Visualization of human Rhodopsin receptors’ interactions. (a) Arena3D Visualization: Human Rhodopsin receptor targets three Gα G-Proteins that belong to the Gα-t subfamily. The three G-Proteins interact with five effectors belonging to the Rhodopsin-sensitive cGMP-specific PDEases subfamily and more specifically to Phosphodiesterase 6 type of effectors. (b) Medusa 2D Visualization: the Rhodopsin subfamily of the Opsin/Rhodopsin family of the Class A of the GPCRs interacts with the Gα-t subfamily of the G-Proteins which interact with the Rhodopsin-sensitive cGMP-specific PDEases effectors’ subfamily.
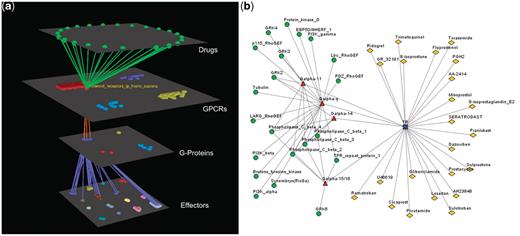
Visualization of human Prostanoid TP receptor’s interactions (drugs included). (a) Arena3D Visualization: Human Prostanoid TP receptor protein of Class A GPCR family targets four Gα G-Proteins that belong to Gq/11 family. The G-Proteins are connected to effectors proteins belonging to eight specific families. For this specific receptor 23 different drugs exist. (b) Medusa 2D Visualization: Human Prostanoid TP receptor protein targets Gα G-Proteins that belong to Gq/11 family. These G-Proteins interact with 11 different subfamilies of effectors. For this specific receptor 23 different drugs exist.
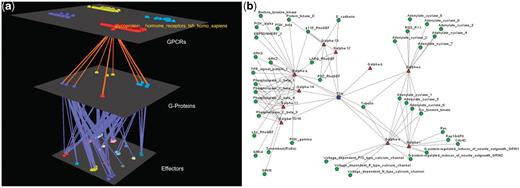
Visualization of human Glucoprotein Hormone TSH receptors’ interactions. (a) Arena3D Visualization: Human Glucoprotein Hormone TSH receptor targets 13 G-Proteins of 10 different subfamilies, which belong to all four Gα families. These G-proteins target 16 different families of effectors. (b) Medusa 2D Visualization: Human Glucoprotein Hormone TSH receptor targets 13 Gα G-Proteins from all four Gα families. More accurately, these Gα G-Proteins belong to 10 respective Gα subfamilies and interact with 19 subfamilies of effectors.
Case study of human Prostanoid TP receptor’s network of interactions
In order to demonstrate the utility of Human-gpDB, a case study of human Prostanoid TP receptor’s network of interactions (Figure 5) is presented. Human Prostanoid TP receptor may couple with all four subfamilies (Gq, G11, G14 and G15/16) of the Gq/11 family of G-proteins. These subfamilies of G-proteins interact with 21 different types of effectors belonging to 8 different families (Tubulins, PI3/PI4 kinases, Phospholipases C, Ser/Thr protein kinases, TPR repeat proteins, Tyr protein kinases, Guanine nucleotide exchange factors and Ezrin-radixin-moesin-binding phosphoproteins). For this specific receptor 23 different drugs exist. Using information from STITCH (37) about protein–protein and protein–chemical interactions, information regarding mostly known natural or synthetic ligands is presented, complementing the functional role of the receptor. Prostanoid TP receptor is related with a bleeding disorder in cases of defection of the receptor [information retrieved from 188 070 entry of OMIM (26) database]. Regarding the receptor’s participation in particular KEGG (30) pathways, the receptor is involved in a calcium-signaling pathway (hsa04020). Using the known coupling preferences of the receptor, a researcher may relate the receptor with other specific KEGG pathways (for example gap junction), in which Gq/11 G-proteins are known to participate. After launching BLAST against Human-gpDB using human Prostanoid TP receptor as query sequence, Prostanoid FR receptor is the most similar entry. Prostanoid FR receptor interacts with the same subfamilies of G-proteins, shares four mutual ligands and agonists [comparison of the networks presented by STITCH (37)] and two mutual drugs [comparison of the networks presented by Medusa (36)] with Prostanoid TP receptor, and, both receptors participate in the calcium-signaling pathway. In general, the two receptors seem to share similar functions. Based on that, a researcher may assume that chemicals that interact with one of the receptors may also interact with the other, leading to similar results (if a chemical is an agonist for one receptor, probably it will also be for the other one too). Therefore drugs known to affect the function of Prostanoid TP receptor (for this receptor more drugs are known) may also affect Prostanoid FR receptor too. Prostanoid FR receptor is not yet related with any disease (according to OMIM [26]), nevertheless there are 12 drugs related with this receptor. One of these drugs is Latanoprost, which is used for controlling the progression of glaucoma or ocular hypertension by reducing intraocular pressure and is a prostaglandin analogue. Based on the known usage of this drug and also the fact that Prostanoid FR receptor participates in the calcium-signaling pathway, there are indications that this specific receptor may be related with hypertension. As already shown, the combination of different information retrieved from Human-gpDB may help the researchers to design specific experiments by which they will clarify the pathways in which the receptors participate, propose a mechanism for the specific disease in the case of Prostanoid TP receptor, propose a relation between Prostanoid FR receptor and hypertension and/or comprehend the side effects of drugs.
Conclusions
Human-gpDB compared to the previous gpDB databases (39,40) is now richer and focuses only on human GPCRs, G-proteins and effectors. Human-gpDB is not simply a gpDB subset, since it contains more recent data (last update of gpDB was done in March 2008, whereas all data of Human-gpDB were retrieved until December 2010), but it also contains new information concerning the classification of GPCRs (11 new subfamilies were added and all existing subfamilies are classified based on the IUPHAR classification) and also contains interactions between all molecules. It is fully integrated with external data sources by bridging information that did not exist in the previous versions (e.g. drugs and chemicals) and it now comes with a new user-friendly environment supported by advanced visualization techniques. The interface makes the navigation friendlier, the exploration of information more efficient and the extraction of new knowledge easier. Human-gpDB database was built to provide a simple but yet a powerful tool for researchers in the life sciences field as it integrates a current, careful collection of human GPCRs, G-proteins, effectors and their interactions. Human-gpDB uses advanced visualization techniques to make the volume of data more informative and the advanced data integration techniques make Human-gpDB a unique tool, a reference guide in pharmaceutical research and especially in the areas of chemical and drug discovery for human diseases. In the future, the expansion of the current version of the database for other organisms starting from the ones that are evolutionarily closer to Humans is essential.
Availability and requirements
Currently, two Human-gpDB servers are set up, one running at EMBL (http://schneider.embl.de/human_gpdb) and the other running at the Department of Cell Biology and Biophysics of the University of Athens (http://bioinformatics.biol.uoa.gr/human_gpdb/). Both servers hold the same copy of the Human-gpDB database. Concerning the linking to Human-gpDB from external sources, other databases can link to our database by using, for example, the following URLs: http://schneider.embl.de/cgi-bin/human_gpdb.cgi?search=P21918 or http://schneider.embl.de/cgi-bin/human_gpdb.cgi?search=DRD5_HUMAN, based on Uniprot ID or Accession Number.
Funding
University of Athens, the University of Central Greece and EMBL, Heidelberg. Funding for open access charge: EMBL, Heidelberg.
Conflict of interest. None declared.
Acknowledgements
The authors thank the reviewers of this article for their useful criticism. M.C.T. collected the data, V.P.S. developed the web application and data integration, G.A.P. worked on visualization tools, N.C.P., C.K.S., P.G.B. helped in the development of the application, R.S. and S.J.H. supervised the project. All authors are involved in the writing of the article.
References
Author notes
The authors wish it to be known that, in their opinion, the first two authors should be regarded as joint First Authors.
