


Abstract
We present iRefWeb, a web interface to protein interaction data consolidated from 10 public databases: BIND, BioGRID, CORUM, DIP, IntAct, HPRD, MINT, MPact, MPPI and OPHID. iRefWeb enables users to examine aggregated interactions for a protein of interest, and presents various statistical summaries of the data across databases, such as the number of organism-specific interactions, proteins and cited publications. Through links to source databases and supporting evidence, researchers may gauge the reliability of an interaction using simple criteria, such as the detection methods, the scale of the study (high- or low-throughput) or the number of cited publications. Furthermore, iRefWeb compares the information extracted from the same publication by different databases, and offers means to follow-up possible inconsistencies. We provide an overview of the consolidated protein–protein interaction landscape and show how it can be automatically cropped to aid the generation of meaningful organism-specific interactomes. iRefWeb can be accessed at: http://wodaklab.org/iRefWeb.
Database URL: http://wodaklab.org/iRefWeb/
Introduction
Most cellular processes are carried out by groups of physically interacting proteins, or complexes (1, 2) and anomalies in protein interactions often lead to disease phenotypes (3). The experimental detection of protein–protein interactions (PPIs) has therefore become a major focus of research in molecular biology with promising applications in medicine (4, 5).
Thanks to recent technological advances, the detection of PPIs can be performed on the genome scale, with individual studies generating vast amounts of data on both interactions and multi-protein complexes. But such high-throughput studies are still limited to a few model organisms including yeast (6–9), fly (10) and worm (11), and more recently bacteria (12) and human (13–15). The same advances in experimental techniques have also fueled a proliferation of hypothesis-driven low-throughput studies, with results reported in a fast expanding body of scientific literature.
Recognizing the importance of keeping systematic records of the proliferating PPI data, various databases have been created for curating and archiving these data and making them available to the scientific community (16–26). These databases represent independent annotation efforts based on a range of research interests, resulting in complementary as well as redundant information.
Thus, anyone wishing to retrieve information on PPIs and complexes for a particular organism of interest has a choice between several databases. But most often, obtaining an up-to-date description of the full compendium of the PPIs in an organism—its interactome—requires the consolidation of PPI records from multiple databases.
A major factor facilitating consolidation has been the adoption of the Proteomics Standards Initiative—Molecular Interaction (PSI-MI) format (27) and the related IMEx initiative (28). The more uniform representation of PPI data, which was afforded by adhering to these standards, laid the foundation for several recent efforts that aggregate information from multiple PPI databases and present a unified data collection to the user (29–33).
Due to the endemic problems of cross-referencing genes and proteins across biological databases (34), as well as to other more specific issues related to PPI literature curation and to the accuracy of the curated data itself (35–37), researchers should have access to key information about the aggregated data. They need to readily verify how each PPI record was consolidated, or which databases contributed to a given record. Furthermore, it is crucial to know the techniques that were used to detect an interaction, because different techniques probe different kinds of interactions at varying levels of accuracy.
Ideally, one would want to have a reliability score associated with each consolidated interaction. However, deriving such scores on an objective basis remains a major challenge (38–40), especially for literature-curated PPIs. Attempts made so far involve ad hoc heuristic scoring schemes. Some take into account various aspects of the supporting evidence, including the detection method and the scale of the study (low- or high throughput) (41). More elaborate scores incorporate quality measures based on extraneous data such as gene expression, co-occurrence in the same cellular pathways, paralogy relationships and domain composition (25, 42). But these measures and the methods for combining them into a single score tend to vary depending on the authors and organism considered, which in turn reflects the inherent problems associated with generalizing this approach.
Meanwhile, obtaining answers to some simple questions should be very helpful in gauging the reliability of a PPI record. For example: How was the interaction detected? Was the interaction cited by more than one original publication? When the same publication has been curated by different databases, are the curations consistent with one another? If not, which of the databases reflects the published report more closely?
To help address these and similar questions we created iRefWeb (http://wodaklab.org/iRefWeb), a web interface to the latest build of the Interaction Reference Index (iRefIndex) repository (32). This latest build consolidates interaction records from 10 different databases: BIND (16), BioGRID (17), CORUM (18), DIP (26), IntAct (19), HPRD (20), MINT (21), MPact (22), MPPI (23) and OPHID (24). For completeness, we consolidated both the standard BIND distribution available as tab-delimited text files, and BIND Translation, a set of interactions from the BIND archives recently recast into PSI-MI 2.5 XML format (see ‘Materials and methods’ section for details).
The underlying iRefIndex data aggregation is a rigorously documented procedure that not only combines equivalent protein identifiers from multiple databases but also maps different protein splice isoforms of the same gene to their canonical representation. This allows it to effectively combine records that use different protein representations to support the same protein interaction or multi-protein complex. Furthermore, iRefIndex enables backtracking of the links used to establish the identity of all interacting proteins to their original source database records.
Thanks to this consolidation process, iRefWeb affords a global view of the consolidated data, and enables the exploration of the known interaction partners for a protein of interest, regardless of the database(s) that contain the original information. In addition, it offers several innovative features. First, easy means are provided for examining the publications cited for each interaction record. Annotated interactions contributed by individual databases can be compared, highlighting any possible discrepancies between them. Secondly, iRefWeb allows the retrieval of consolidated interactions that match various user-defined criteria, such as the number of supporting publications or low- versus high-throughput studies. Options to filter by PSI-MI vocabulary terms such as ‘interaction type’ or ‘interaction detection method’ are also provided. The former is intended to describe the nature of the association between the proteins, for instance if it is a physical association, or a phenotypic association (43–45), whereas the latter informs on the actual experimental methods used to detect an association.
Here, we present an overview of the consolidated PPI landscape available through iRefWeb, and describe how the resource can be used to document this landscape along the lines described above. We also illustrate the automatic retrieval of organism-specific interactomes with a specified level of support and discuss the current limitations of such retrieval.
Results
The consolidated information
We consolidated PPI annotations from the 10 public databases listed above, which curate predominantly physical PPIs. The Interaction Reference Index method (32) (iRefIndex; http://irefindex.uio.no) was used to consolidate the data, while also mapping all proteins to their canonical isoforms whenever possible (see ‘Materials and methods’ section). The consolidated dataset provides a thorough coverage of the existing PPI data, and establishes the basis for building customized interactomes for a wide variety of organisms.
The latest version of this dataset (version 7.0) comprises a total of 404 384 distinct interactions, derived by consolidating 1 119 604 original records from the source databases. The iRefIndex consolidation process involved the identification of original records that contained only proteins (or genes) as interactors; the mapping of such entities and interactions into the same representation system; the elimination of redundant representations; and further consolidation of splice variants through protein isoform canonicalization [see ‘Materials and methods’ section and (32)].
The original interactions were detected by a broad variety of experimental techniques that probe different types of interactions. For example, binary physical interactions are identified by various yeast two-hybrid (Y2H) screens (7, 8), protein-fragment complementation assays (46) or by biochemical and structural analyses. On the other hand, groups of proteins that physically associate with one another—often referred to as protein complexes—may be detected via a spectrum of purification methods, which include immunoprecipitation (47) and affinity purification coupled with mass spectrometry (6, 9). Other methods such as fluorescent tagging identify proteins that co-localize to the same cellular compartment (48). The consolidated dataset also includes the so-called genetic interactions, which are curated by some of the databases. These interactions are not physical in nature, but represent unexpected phenotype alterations produced by the deletion or mutation of one gene in the background of a mutation (or deletion) of another gene (43–45).
The information on the interaction type and detection method is captured by the source databases using the PSI-MI (27) controlled vocabulary, and associated with each interaction record. The iRefIndex/iRefWeb system aggregates this information as part of the consolidation process and makes it available. This often involves resolving ambiguities in the captured descriptions, likely resulting from different interpretations of the PSI-MI specifications (see ‘Materials and methods’ section).
The annotation of protein complexes often differs across databases. Some databases record complexes as groups of proteins, whereas others use the so-called spoke expansion, which represents complexes as sets of binary interactions between a designated ‘bait’ protein and all other proteins in the complex (49). The latter case may be distinguished from experimentally detected binary interactions by examining the PSI-MI interaction type: binary interactions derived from complexes are usually annotated as ‘physical association’ (rather than ‘direct interaction’).
The PPI landscape
Here we focus on the landscape of all types of experimentally detected physical associations between proteins, comprising direct binary interactions and participation in the same complex. The consolidated dataset was therefore filtered to exclude genetic interactions (see ‘Materials and methods’ section), as well as interactions predicted on the basis of computational methods recorded by the OPHID database (24). Interactions of proteins with nucleic acids and small molecules curated by BIND were not consolidated.
Following the above filtering, the aggregated dataset of physical PPIs comprises 263 479 distinct interactions involving 66 701 proteins, mapping to 1448 different organism taxonomy identifiers. iRefWeb offers an extensive set of visual quantitative summaries of this landscape in its Statistics page, as highlighted in Figure 1. For example, it provides overviews of the number of interactions and proteins contributed by each source database, as well as the number of interactions and proteins that are unique to a given database.
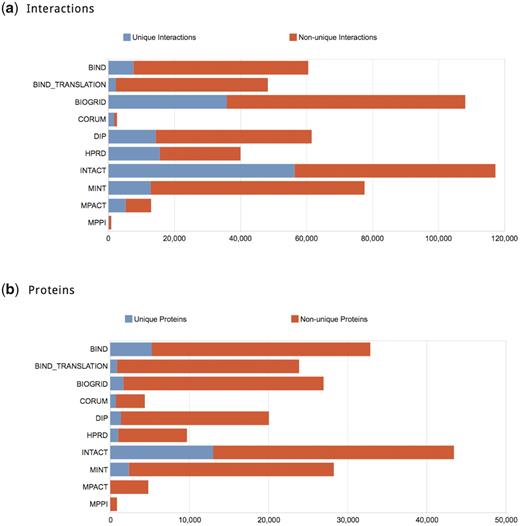
Summaries of the relative contribution of each database to the consolidated set. (a) Contribution of physical PPIs by different databases. The number of interactions that do not appear in any other database (i.e. unique contribution) is represented in blue; those shared with other databases are represented in red. IntAct contributes the largest number of interactions to the consolidated data (117 302) and almost 48% of these interactions (56 393) are unique. In CORUM, which specializes in the annotation of mammalian complexes, unique annotations comprise as much as 67% of its records, but for a much smaller pool of records (1749 unique annotations out of 2607 total). In contrast, MINT annotates a relatively high number of interactions (77 502) but over 84% of them are also available from other databases. (b) Contribution of proteins involved in curated interactions across databases. The color scheme is the same as in (a). The number of proteins shared by the different databases is distributed somewhat differently than the number of PPIs. Most of the databases have only a small fraction of unique proteins—typically <10%. Nevertheless, they may still contribute a sizable fraction of unique interactions to the consolidated PPI collection. The level of protein sharing is thus related non-trivially to the level or interactions sharing, because different databases may annotate different interactions for the same protein. This might arise from the curation of different publications or from varying interpretations of the same publication (Turinsky, A.L. et al., 2010, Database, in press).
Most major databases record interactions in different organisms such as human, mouse, yeast, fly and worm. But organism coverage varies among databases. Some focus entirely on interactions in human (HPRD), in mammalian organisms (CORUM, MPPI) or yeast (MPact). Organism-specific summaries produce overviews of this information as illustrated in Figure 2 and Tables 1 and 2. These include the number of interactions and proteins for a given organism in the full consolidated dataset, the total and unique contribution of individual databases to these data, and the data shared between pairs of databases.
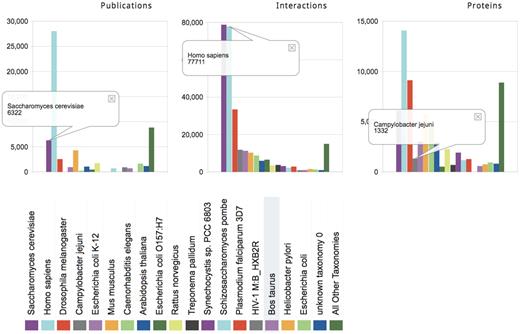
Organism-specific summaries for the consolidated PPI landscape. The number of publications, interactions and proteins in the consolidated dataset annotated in different organisms (colored bars). The data for specific organisms are sorted by the number of interactions. The right-most bar groups all remaining organisms. Yeast (dark magenta) and human (light blue) correspond to 30 and 29%, respectively, of all the consolidated interactions, but are supported by 13 and 57%, of the publications, respectively. An asymmetry between the numbers of publications, interactions and proteins is observed for several other organisms due to the presence of high-throughput studies. For example, the interactions from Campylobacter jejuni, a food-borne pathogen that causes gastroenteritis, represent the fourth largest set of PPIs among organisms (4.5% of all PPIs, gray bar) but were extracted from only nine publications. Of these, six publications contribute just one C. jejuni interaction each, but the remaining three publications describe high-throughput studies and contribute virtually all C. jejuni interactions.
Interactions contributed by individual databases
| Organism | Type | BIND | BIND_Tr | BioGRID | CORUM | DIP | HPRD | IntAct | MINT | MPact | MPPI | All DBs |
|---|---|---|---|---|---|---|---|---|---|---|---|---|
| All | Total | 60 495 | 48 326 | 108 045 | 2607 | 61 626 | 39 953 | 117 302 | 77 502 | 12 858 | 829 | 263 479 |
| Unique | 7506 | 2225 | 35 867 | 1749 | 14 313 | 15 559 | 56 393 | 12 724 | 5126 | 155 | ||
| Homo sapiens | Total | 9235 | 11 024 | 29 473 | 1761 | 2232 | 39 945 | 23 595 | 15 503 | 450 | 77 711 | |
| Unique | 461 | 1088 | 9468 | 1021 | 1113 | 15 551 | 9969 | 5278 | 53 | |||
| Sacharomyes cerevisiae | Total | 11 142 | 4692 | 46 936 | 23 645 | 26 149 | 22 731 | 12 858 | 78 863 | |||
| Unique | 359 | 48 | 22 705 | 5794 | 12 387 | 1150 | 5126 |
Shown are the total number of interactions (top) and the number of unique interactions (bottom italics) contributed by each database. HPRD and BioGRID jointly provide 67% of human PPIs, computed using the number of interactions for each database as shown in the Table, minus their 17 490 shared PPIs (data not shown). However, almost all the remaining human PPIs appear in only one of the other source databases. Similarly, BioGRID and IntAct jointly provide 83% of all yeast interactions, computed as above, taking into account their 7931 shared PPIs. Nevertheless, DIP, MINT and MPact contribute over a thousand unique yeast PPIs each, which collectively add up to 15% of all yeast PPIs. ‘BIND_Tr’ stands for the BIND-Translation set of PPIs (see ‘Materials and methods’ section).
Proteins contributed by individual databases
| Organism | Type | BIND | BIND_Tr | BioGRID | CORUM | DIP | HPRD | IntAct | MINT | MPact | MPPI | All DBs |
|---|---|---|---|---|---|---|---|---|---|---|---|---|
| All | Total | 32 880 | 23 887 | 26 987 | 4359 | 20 073 | 9745 | 43 456 | 28 284 | 4835 | 847 | 66 701 |
| Unique | 5248 | 834 | 1667 | 695 | 1371 | 984 | 13 052 | 2342 | 22 | 32 | ||
| Homo sapiens | Total | 5219 | 5373 | 8134 | 2592 | 1377 | 9719 | 7991 | 6041 | 440 | 14 089 | |
| Unique | 302 | 240 | 190 | 111 | 33 | 959 | 911 | 627 | 5 | |||
| Saccharomyes cerevisiae | Total | 5034 | 2462 | 5146 | 4981 | 5677 | 5262 | 4835 | 6123 | |||
| Unique | 45 | 22 | 74 | 6 | 163 | 18 | 22 |
Shown are the total number of proteins (top) and the number of unique proteins (bottom italics) contributed by each database to human and yeast interactomes. Each database shares between 89% and 98.9% of its human proteins with other databases. For yeast, this fraction is between 97% and 99.9%, likely due to the larger proportion of high-throughput datasets that all the major databases store.
The breakdown by organism shows that the majority (59%) of the consolidated physical interactions are from the yeast Saccharomyces cerevisiae (30%) and human (29%); 13% are from fly (Drosophila melanogaster) and 7% are from various strains of Escherichia coli; whereas those from the worm C aenorhabditis elegans, mouse and rat each represent <4%. Interactions from over 1400 additional organisms (mostly microbes and plants) collectively make up the remaining ∼12%.
Closer analysis of the data reveals that although the number of unique interactions contributed by individual databases may span a wide range (Table 1), assembling a complete set of PPI for a given organism requires data consolidation from all the databases. For example, almost half (∼45%) of all the consolidated human PPIs represent unique interactions contributed by HPRD, IntAct and BioGRID. However, an additional 12% of the human PPIs are unique interactions contributed by the remaining six databases. The remaining 43% of human PPIs are each contributed by two or more databases. The same situation occurs for the yeast S. cerevisiae, where BioGRID and IntAct contribute the lion’s share of the unique interactions. However, the remaining databases typically list thousands of unique interactions each, representing a valuable complement. IntAct, DIP, MINT and BIND contribute a significant number interactions in various additional organisms grouped under the category ‘other’ in Figure 2.
Not unexpectedly, the different databases share a very large fraction of their organism-specific proteins, especially in human and yeast (Table 2). The sharing of proteins is much more limited, however, in organisms such as E. coli, mouse and rat, where interactions have been less extensively studied. For these organisms in particular, consolidating PPIs from multiple databases affords much better coverage of the proteins whose interactions have been reported.
Interrogation of the supporting evidence
The wealth of information contained in the consolidated iRefIndex data can be explored interactively via the iRefWeb interface. This interface provides multiple and flexible views of the data, including the composition of binary interactions and multi-subunit complexes, the identity of the interacting proteins, their many aliases, the organisms and the experimental methods used to detect the interactions. It also provides a graphical display of the interaction neighborhood for any annotated protein as well as the details on the consolidation of the source database records, with links to the original annotation records (Figure 3). The data may be searched for particular combinations of genes, proteins, PubMed IDs or by any string query, e.g. ‘chromatin cancer’.
![The detailed graphical view of an interaction record in iRefWeb. The interaction summary of the Rev1 protein [REV1 homolog (S. cerevisiae)] in mouse is returned by iRefWeb Search (a), and is expanded to reveal a graphical representation of its interaction neighbors (b). The first listed interaction between Rev1 and the PolI protein (DNA polymerase iota) is consolidated from BIND/BIND Translation and IntAct interaction records (details shown in the boxes at the bottom). Each database cites a different PubMed publication as the source of the annotation. The consolidated record is therefore based on two different studies (NP = 2, within the blue oval). Both publications are low-throughput, supporting between 5 and 9 different interaction records including the current one (Lowest PubMed Reuse = 5 and Highest PubMed Reuse = 9, shown both in the Search summary table and in the top left corner of the graph panel). The information on the ‘interaction type’ and ‘interaction-detection method’ conforms to the PSI-MI controlled vocabulary terms. Details on the iRefIndex consolidation process show the original protein IDs used by BIND and IntAct to represent the Rev1 protein (boxes at the top right), which were grouped together by the iRefIndex. Interestingly, among Rev1 interactors, five are mouse proteins and one is a fruit fly protein corresponding to the DNApol-η gene (lower left interactor). The latter interaction is provided by IntAct (interaction EBI-2114780), for which further evidence may be explored by clicking on the corresponding edge in the graph. The graph is implemented with Cytoscape Web (52).](https://oup.silverchair-cdn.com/oup/backfile/Content_public/Journal/database/2010/10.1093/database/baq023/2/m_baq023f3.jpeg?Expires=1716359153&Signature=WxVA2Z4vCxhyQXt9V15W9~FLsXhHLLSPspTjCsoL5ot7GTwkd06jOXGov7WRwiSd4HSMWHLZSn5-000iJG5UyOC1wZXDPAuH9EOyFU1EK-fQlH2SD3fUQvhE~kwhvj4Th1xWjqpeXXq8Pa58r2pNHU1KSONliNwYiisGOM4wBvZuiBlUzytbtwRfZdKC1tJofHjqpOY9LRPkCvLO3BqQrYaSHJQbGwirzcairUiqSzU2gCWpXHysrlJKpgZFlEuayE69gPCihPZ~nmyV~3Zk8X2v6xCSDyHBY73A9iJkxlUd9P5eN-X-6BVjdaQwNLtah-Yxt6KYTwJkuB-k3tqhsQ__&Key-Pair-Id=APKAIE5G5CRDK6RD3PGA)
The detailed graphical view of an interaction record in iRefWeb. The interaction summary of the Rev1 protein [REV1 homolog (S. cerevisiae)] in mouse is returned by iRefWeb Search (a), and is expanded to reveal a graphical representation of its interaction neighbors (b). The first listed interaction between Rev1 and the PolI protein (DNA polymerase iota) is consolidated from BIND/BIND Translation and IntAct interaction records (details shown in the boxes at the bottom). Each database cites a different PubMed publication as the source of the annotation. The consolidated record is therefore based on two different studies (NP = 2, within the blue oval). Both publications are low-throughput, supporting between 5 and 9 different interaction records including the current one (Lowest PubMed Reuse = 5 and Highest PubMed Reuse = 9, shown both in the Search summary table and in the top left corner of the graph panel). The information on the ‘interaction type’ and ‘interaction-detection method’ conforms to the PSI-MI controlled vocabulary terms. Details on the iRefIndex consolidation process show the original protein IDs used by BIND and IntAct to represent the Rev1 protein (boxes at the top right), which were grouped together by the iRefIndex. Interestingly, among Rev1 interactors, five are mouse proteins and one is a fruit fly protein corresponding to the DNApol-η gene (lower left interactor). The latter interaction is provided by IntAct (interaction EBI-2114780), for which further evidence may be explored by clicking on the corresponding edge in the graph. The graph is implemented with Cytoscape Web (52).
A series of tools are provided for analyzing the rich supporting evidence consolidated for each interaction record, which help to assess the reliability of an interaction. This is best illustrated by the following simple questions that researchers can address using the resource.
How many publications reported a given interaction?
It has been pointed out that PPIs identified in several different publications are in general more likely to be biologically relevant. Requiring that a PPI be supported by several publications has been a common approach for scoring PPI data in public databases (25, 38), as it is easy to interpret and the bias toward well-studied interactions is immediately evident. iRefWeb displays the number of supporting publications (NP) as well as their PubMed IDs for each consolidated interaction (Figure 3). It also provides links to the original annotation records in the source databases for easy verification. Furthermore, the iRefWeb Search option allows filtering the data using a range of attributes. Figure 4 illustrates such filtering to retrieve physical PPIs in the yeast S. cerevisiae, where the user may instantly see how many of the retrieved interactions are supported by one, two, or more publications.
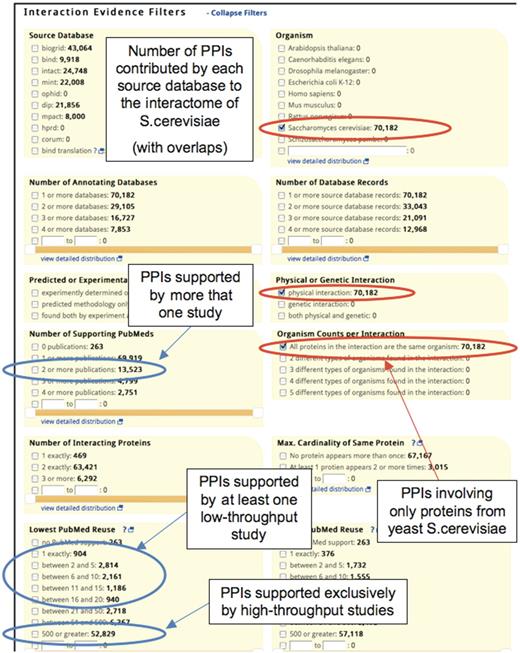
Filtering interactions on the basis of the supporting evidence. Portion of an iRefWeb Search page is shown, with different panels corresponding to filtering options based on the supporting evidence. Each panel displays the different attribute values or thresholds applied to the corresponding filter, and the numbers next to each threshold refer to distinct interactions that match that value or threshold. The distribution of counts across the lists in the different evidence filters is computed either on the full dataset (default) or on the PPIs retrieved by the previous query. The Figure shows the results of a search for physical PPIs in yeast S. cerevisiae (filter settings shown in red ovals). Once the query is complete all the counts are updated. The ‘Number of Interacting Proteins’ panel shows that there are 469 homomeric interactions (physical interactions in S. cerevisiae) that involve one protein, 63 421 interactions involving two different proteins and 6292 interactions involving three or more different proteins. ‘Number of Supporting PubMeds’ panel indicates that out of 70 182 yeast interactions, 13 523 interactions are supported by at least two publications (top blue oval). The panel ‘Lowest PubMed Re-use’ shows that only 8005 yeast interactions appeared in low-throughput papers supporting at most 20 interactions. In contrast, 52 829 interactions are reported exclusively in high-throughput studies, each supporting 500 or more interactions (the two other blue ovals).
Was the interaction detected in any low-throughput studies?
It is generally believed that interactions detected in carefully crafted low-throughput studies are more accurate than those detected in large-scale analyses (50), although this assertion has been recently challenged (39, 40, 51). To enable identification of PPIs supported by either type of study, each consolidated interaction is assigned a so-called Lowest PubMed Re-use (LPR) metric (32). The LPR metric is defined as the lowest number of PPIs reported by any of the publications that cite the considered interaction. For instance, when an interaction is curated from both, a low-throughput study detecting only three PPIs, and a high-throughput study reporting over a thousand PPIs, then its LPR = 3. The Search page displays the interaction counts for several LPR values and allows users to restrict their search to a particular LPR range (Figure 4). The LPR metric may be used to rank interactions and to derive interaction subsets on the basis of this rank, as done in other consolidation efforts (25) or databases (21).
Is the information extracted from the same publication consistent across databases?
The iRefWeb PubMed Detail feature enables in-depth comparison of the information extracted by different databases for each publication that supports a given PPI (Figure 5). Analysis of this information for all the publications that were curated by more than one database revealed that differences between the original curations of the same publication are rather frequent (Turinsky, A.L. et al., 2010, Database, in press). While such differences can be attributed to many factors, they do in some cases point out inherent difficulties in interpreting the published information (Turinsky, A.L. et al., 2010, Database, in press). iRefWeb enables the user to directly consult the original publications in order to determine the possible origins of the detected differences. One can also use the PubMed Reports feature to identify differences in the curated data from many publications at once, or for an entire source database.
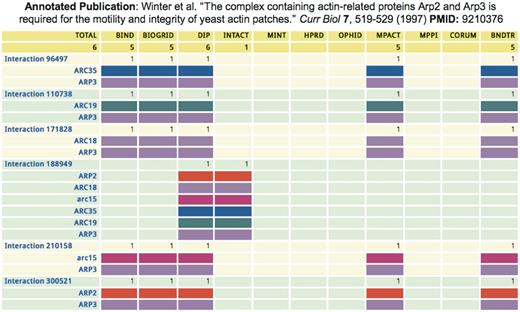
Divergent annotations of a yeast complex by five databases. The iRefWeb Pubmed Detail summary displays the different annotations of the same paper (PMID 9210376), which describes a six-subunit actin-related complex in yeast. Each line indicates the presence/absence of a protein in the corresponding interaction records, where the same color represents the same protein across different interaction records. Columns represent annotations by each of the five databases, also showing the number of interaction records in each annotation. BIND, BioGRID and MPact represent the yeast complex using a spoke-model expansion (49) into five binary bait–prey interactions, with ARP3 as the bait. In contrast, IntAct shows one experiment record (EBI-1249316) containing a single interaction record representing a complex of six proteins (EBI-1249322). Interestingly, DIP uses both a six-protein complex (DIP:18222E) that is equivalent to the complex annotated by IntAct, and also a spoke-model expansion into five binary interactions (DIP:3477E, DIP:14765E, DIP:14768E, DIP:14772E and DIP:14791E) that are equivalent to the corresponding annotations by BIND, BioGRID and MPact. The codes in parentheses are the identification codes for the corresponding interaction records in the different source databases.
Extracting meaningful interactome descriptions
The filtering capabilities of iRefWeb (Figure 4) can be readily exploited to extract organisms-specific interactomes from the consolidated data subject to specified constraints. For instance, to derive the PPI network for yeast, S. cerevisiae, the first step is to activate the search filters ‘Saccharomyces cerevisiae’ and ‘Physical interaction’, and to include only interactions between proteins from the same organism (Figure 4). This query filters out any genetic interactions and returns 70 182 distinct interaction records in the consolidated dataset that involve exclusively S. cerevisiae proteins. Based on the current state of knowledge about the S. cerevisiae proteome, however, one may surmise that this rather large number probably includes a sizable fraction of low confidence interactions that may not be biologically relevant.
To limit the number of potentially spurious interactions, the user can apply additional filters to select only interactions supported by two or more studies (‘Number of Supporting PubMeds’ panel). These filters can be further combined with the selection of PPIs reported in either high- or low throughput studies using the LPR criterion (‘Lowest PubMed Re-use’ panel), and interactions detected by specific methods e.g. tandem affinity purification, affinity chromatography, etc. (‘Detection Type’ panel). The descriptions of the interaction-detection method and interaction type are based on the corresponding PSI-MI controlled vocabulary terms (27).
At any time, the detailed records of all the retrieved PPIs may be visually inspected for features of interest, and the entire retrieved collection may be downloaded in PSI-MITAB data format, using the ‘Download Interactome’ option.
However, such automated data extraction is only the first step in building a high confidence interactome. To complete the task, further manual re-curation of the data is necessary. Most obvious cases warranting re-curation are those in which the number of interactions archived by a source database either significantly exceeds that reported in the cited publication or is close to the number of reported low-confidence interactions. Table 3 lists several examples where, depending on the choice of the database that annotated the same high-throughput yeast study, an unsuspecting user may retrieve substantially different sets of interactions. Although most of the differences are minor, no databases have identical number of interaction records compared with each other and to the number described by the authors of the original publication. Prominent discrepancies are typically a result of a decision to curate the high-confidence filtered subset of interactions versus the full unfiltered set; or the decision to record additional data from the authors’ supplementary materials and resources; or the failure to annotate the interaction types properly in the downloadable data distribution (e.g. missing quality attributes or missing PSI-MI codes to indicate genetic interactions). In such cases, the original records from individual databases may have to be manually flagged and excluded entirely from the retrieved PPI set. iRefWeb greatly facilitates this manual process, by helping both researchers and curators identify publications for which the PPI counts differ significantly between the annotating databases, or for which the interactions recorded by one database are not supported by any other.
Examples of high-throughput annotations that require manual verification
| Source | Number of PPIs | Data description and provenance |
|---|---|---|
| Uetz et al. (8) (PMID 10688190) | 957 | ‘These approaches resulted in the detection of 957 putative interactions involving 1004 S. cerevisiae proteins.’ |
| BIND | 1054 | http://bond.unleashedinformatics.com/Action?textquery=pmid:10688190 |
| BioGRID | 875 | http://thebiogrid.org/14574/publication/10688190.html |
| DIP: 30 December 2009 | 1485 | Quality status: 999 ‘core’ PPIs, 486 ‘non-core’ PPIsa |
| DIP: 14 June 2010 | 1485 | Quality status: 448 ‘core’ PPIs, 1037 ‘non-core’ PPIsa |
| IntAct | 1476 | 952 interactions in Experiment ‘uetz-2000-1’ (http://www.ebi.ac.uk/intact/pages/details/details.xhtml?experimentAc=EBI-389903). |
| 524 additional interactions in Experiment ‘uetz-2000-2’ (http://www.ebi.ac.uk/ intact/pages/details/details.xhtml?experimentAc=EBI-392769) | ||
| MINT | 953 | –b |
| MPact | 1033 | 980 records citing PMID 10688190 as primary reference, 53 as secondary referencec |
| Ito et al. (7) (PMID 11283351) | 4549 | ‘Here we have completed the comprehensive analysis using this system to identify 4549 two hybrid interactions among 3278 proteins.’ Core data are ‘composed of 841 interactions involving 797 proteins’. |
| BIND | 4468 | http://bond.unleashedinformatics.com/Action?textquery=pmid:11283351 |
| BioGRID | 848 | http://thebiogrid.org/14580/publication/11283351.html |
| DIP: 30 December 2009 | 4449 | Quality status: 457 ‘core’ PPIs, 3992 ‘non-core’ PPIsa |
| DIP: 14 June 2010 | 4449 | Quality status: 359 ‘core’ PPIs, 4090 ‘non-core’ PPIsa |
| IntAct | 4524 | Experiment ‘ito-2001-1’ (http://www.ebi.ac.uk/intact/pages/details/details.xhtml?experimentAc=EBI-375746) |
| MINT | 4528 | –b |
| MPact | 4550 | 4550 records citing PMID 11283351 as primary referencec |
| Tarassov et al. (53) (PMID 18467557) | 2770 | ‘We identified 2770 interactions among 1124 endogenously expressed proteins.’ |
| BioGRID | 2616 | http://thebiogrid.org/77339/publication/18467557.html |
| IntAct | 10181 | Experiment ‘tarassov-2008-1’ (http://www.ebi.ac.uk/intact/pages/details/ details.xhtml?experimentAc=EBI-2007879) |
| MINT | 2769 | –b |
| Tong et al. (54) (PMID 11743205) | 291 | ‘SGA analysis… generated a network of 291 interactions among 204 genes.’ |
| BioGRID | 338 | http://thebiogrid.org/15262/publication/11743205.html |
| MPact | 585 | 585 records corresponding to 298 protein pairs, citing PMID 11743205 as primary referencec |
Comparison is made between the authors’ description of the number of interactions in several yeast high-throughput studies, to the number of interactions recorded by source databases. Some prominent differences are observed, mostly related to annotating core versus non-core data. PMID 10688190 (8): DIP and IntAct record substantially more interactions than other databases annotating the same publication, but separate them into two confidence groups. DIP has changed the number of core and non-core interactions between 2009 and 2010 releases, as could be seen by comparing the ‘quality-status’ attributes of the interaction records in the two DIP data distributions. However, the quality-status attribute applies to the entire interaction record, which could be supported by multiple publications, and hence is not necessarily specific to a particular PubMed identifier. IntAct records the additional PPI set from the authors’ web site (‘uetz-2000-2’, EBI-392769). PMID 11283351 (7): Out of six databases, only BioGRID seems to annotate the core set, and the other databases annotated both the core and non-core interactions. PMID 18467557 (53): IntAct records more than three times the number of interactions reported in the publication. The XML tags indicate that all 10 181 interactions are curated from the Supplementary Table S1 and Figure 1 of the Tarassov et al. paper (53). These records likely contain both filtered and unfiltered interaction data, but their PSI-MI descriptions lack any confidence or quality attributes. PMID 11743205 (54): MPact does not record the interaction type or detection method in its PSI-MI distribution, failing to alert the user to the fact that all interactions are genetic. Also, MPact generates two different interaction records for virtually all pairs of interacting genes, but due to missing details in the PSI-MI distribution these records are highly redundant. Data sources are listed in the last column of the Table, except as noted below.
aDIP data are available at http://dip.doe-mbi.ucla.edu/dip/Download.cgi?SM=7 in both PSI-MI XML and MITAB format.
bMINT allows a web search using a PubMed identifier at http://mint.bio.uniroma2.it/mint/search/searchWelcome.do.
cMPact data are available at ftp://ftpmips.gsf.de/yeast/PPI in PSI-MI XML (the latest version is dated 10 January 2008).
Discussion
We believe that the iRefIndex/iRefWeb system represents a significant step forward in integrating information on protein interactions from public databases, and enabling researchers to seamlessly interrogate this information.
The versatile iRefWeb search filters enable the retrieval of organism-specific interactomes from the consolidated data, subject to specified criteria formulated on the basis of the supporting evidence. These interactomes can be pruned to reduce the number of low confidence interactions likely to be spurious, for example, by requiring that a retrieved interaction be supported by two or more publications, of which at least one publication is a low-throughput study. Further automated filtering options on the basis of the interaction type (physical association, direct interaction, covalent binding, etc.) and the experimental detection method are also offered. But these filters are unfortunately not as reliable as one would want them to be, because the expected information is often either missing or not properly mapped onto the corresponding terms of the PSI-MI ontology, by the source database.
Another issue is the representation of multi-protein complexes and associations across the source databases. iRefWeb allows filtering interactions by specifying a threshold (say, three or more) for the ‘Number of Interacting Proteins’ in the consolidated interaction record. However, this criterion will not result in the retrieval of all multi-protein complexes in the consolidated dataset, because some databases annotate a multi-subunit complex as a set of binary interactions using the so-called spokes expansions (Figure 5). To include these cases as well, filtering on the interaction type (such as ‘physical association’) should be applied in addition.
Many of these problems can be traced back to legacy data curated prior to the existence of the PSI-MI standard, or the IMEx consortium, and most should be resolved, as more of the source databases adhere to the agreed upon standards and unify their annotation practices and policies. In particular, it would be very useful if the databases applied identical policies for the annotation of low confidence raw PPI data made available by some studies (7, 55), which ideally should be flagged as such. Furthermore, MIMIx (minimum information required for reporting a molecular interaction experiment) guidelines were recently proposed to facilitate the standardized description of interaction data in public databases (56).
In the meantime, some level of manual re-curation is needed to retrieve interactomes that are biologically relevant. The capabilities offered by iRefWeb, notably the various automated options to filter out interactions likely to be spurious, greatly increase the efficiency of this process. Ultimately, however, such filtering should rely on more quantitative scoring schemes that are specific for distinct experimental methods (40) and can be generalized across different organisms.
A very important, and so far unique, feature in iRefWeb, is that it gives users the ability to readily compare how different databases interpret the same published information, and in case of clear differences, to verify these interpretations directly by examining the original publication.
Two rather typical examples of such differences are illustrated in Figure 6. One example highlights the discrepancies on both the organism and the number of interactions recorded by three databases from the same study by Ito et al. (57). The second example illustrates the disagreements across three databases on the proteins recorded from the article by Enenkel et al. (58).
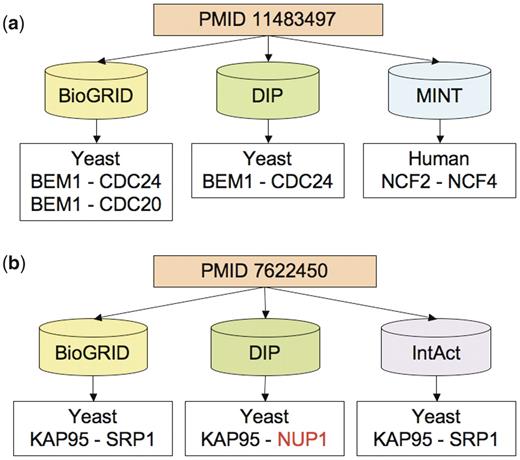
Examples of citation differences. Each of these examples can be viewed by querying the PubMed tab of the iRefWeb interface using the PubMed identifier (PMID). (a) Discrepancies in both organisms and the number of interactions recorded from PMID 11483497 (57): BioGRID and DIP recorded a different number of yeast interaction described in the publication, but are in partial agreement on the PPIs and proteins involved. In contrast, MINT recorded a human interaction citing the same publication and shows no overlap with the other two databases. The publication actually describes one yeast interaction between BEM1 and CDC24 and one related mammalian interaction between p67phox and p40phox; the latter pair of aliases corresponds to neutrophil cytosolic factors NCF2 and NCF4, respectively, in human. (b) Discrepancies in proteins recorded from PMID 7622450 (58): the three databases (BioGRID, DIP and IntAct), curating this publication identify one interaction in the yeast S. cerevisiae, but DIP identifies one of the interacting proteins differently. This causes complete lack of overlap on interactions but partial overlap on proteins between DIP and the other two databases. The interaction KAP95-NUP1 annotated by DIP was mentioned in the publication, but only as a reference to another study (59).
A systematic analysis of such differences yields unique insights into the challenges of curating the PPI literature (Turinsky, A.L. et al., 2010, Database, in press). The ability to query the original information at the level of individual publications should also be valuable to both the consumers of the PPI data and to database curators wishing to prioritize or validate their curation efforts.
Finally, we have shown how the rich graphical and numerical summaries of the consolidated data provide a valuable snapshot of the known PPI landscape across different organisms and databases. Analysis of this information reveals that most databases contribute a significant number of unique PPIs (often in the thousands for well-studied organisms such as human or yeast), which makes data consolidation a necessity.
Materials and Methods
Databases
The following versions of the source databases were used in this study: BIND (including the standard BIND distribution dated 25 May 2005 and BIND Translation dated 8 January 2010), BioGRID (31 January 2010, Version 2.0.61), CORUM (02 December 2009), DIP (30 December 2009), HPRD (06 July 2009, Release 8), IntAct (22 January 2010), MINT (11 November 2009), MPact (10 January 2008), MPPI (06 January 2004) and OPHID (18 July 2006). The corresponding 7.0 release of the iRefIndex PSI-MITAB files are available at http://irefindex.uio.no. The BIND Translation files are a pre-release version of archived BIND records recently recast into in PSI-MI 2.5 XML format by Gary Bader (http://baderlab.org/BINDTranslation) and kindly made available to this consolidation effort. Compared to BIND, they contain many additional annotation details, for example, references to 5346 additional publications, of which 1982 support PPIs in fruit fly D. melanogaster and 1742 support human PPIs. Overall they contribute 2225 unique interactions to iRefWeb, including 1088 human PPIs. The BIND Translation files will be publicly available in future releases of iRefIndex (see http://irefindex.uio.no/wiki/Sources_iRefIndex_7.0).
Data consolidation
Data consolidation was performed using the iRefIndex procedure [http://irefindex.uio.no, (32)]. This procedure collects PPI annotations from the source databases in PSI-MI format (27), in which genes and proteins may be specified using a variety of systems (NCBI Entrez Gene or RefSeq, UniProt). It then assigns identical keys to PPI records from multiple sources if they all represent the same interaction involving identical protein partners. Proteins are considered identical if their identifiers refer to the exact same amino acid sequence from the same organism.
Briefly, for each protein referred to by the source database, a protein sequence is retrieved, and assigned a hash code called a SEGUID by using the Secure Hash Algorithm (SHA-1). The protein is then given a unique key called a ROGID (redundant object group identifier), consisting of a concatenation of the SEGUID and the NCBI taxonomy ID. Each ‘interaction’ is also assigned a unique ID by ordering and concatenating the keys for the protein interactors and then creating a new SHA-1 key for the resulting string. Records with identical keys are defined as a redundant group. Two interaction records have identical keys if they refer to the same set of identical protein sequences and taxonomy identifiers.
Mapping proteins to canonical isoforms and genes
An additional isoform consolidation step, recently introduced into the iRefIndex procedure (since Version 6), maps every protein to the canonical splice isoform of the corresponding gene whenever possible (see http://irefindex.uio.no/wiki/Canonicalization). This mapping was performed because it is not uncommon that a particular isoform is annotated as the interacting protein, even when the interaction is not specific to that isoform. This additional step enables further consolidation and more reliable comparison of the data across the source databases. It involved the following procedure.
EntrezGene records are associated with a list of protein products (as defined by their corresponding ROGIDs described above). EntrezGene identifiers were clustered into related gene groups (RGGs) if they share at least one identical protein product. As a result, each RGG has an initial list of distinct protein products encoded by at least one of its member genes and represented by a set of RefSeq protein records. This initial list was expanded to include (i) distinct proteins from UniProt that are isoforms related to one of the proteins already in this list and/or (ii) UniProt proteins that cross-reference one of the EntrezGene identifiers in the RGG. From this expanded list of proteins, one specific protein was chosen as the canonical isoform for the entire list. If one of the proteins was an annotated canonical UniProt sequence (see http://www.uniprot.org/faq/30), then it was chosen as the canonical form. If two or more such proteins were annotated, the one with the longest sequence was chosen. If no canonical UniProt sequences existed, the longest protein sequence associated with the RGG was chosen.
All ROGIDs (interactors) were mapped to canonical ROGIDs in this manner. The net effect of the process was to minimize the number of canonical proteins by utilizing information from both UniProt and EntrezGene. Much of this reduction occurs for interactions and proteins from human and other mammalia.
It should be noted, however, that although our procedure maps the different splice isoforms to a single group, the original information curated by the different databases is completely preserved and can be directly queried for each consolidated record. This is a reasonable compromise until new data on the effect of splice isoforms on detected interactions become available, and standards are derived by PSI-MI for recording the information. In the meantime, individual databases follow their own policies in this regard, with some like IntAct using isoform-specific UniProt accessions as opposed to canonical accessions to annotate interactors. Links to the original records curated by the different databases ensure that this information is scrupulously passed on to the user.
Filtering on the basis of PSI-MI interaction attributes
Several interaction-attribute filters were enabled by processing the standard terms of the PSI-MI ontology (27), recorded in the source database annotations. Most relevant to this report is the processing of terms in the Interaction Type and Interaction Detection Type categories. The former describe the nature of the association between the proteins, whereas the latter specify the experimental method used to detect this type of association.
Interactions were considered ‘genetic’ (representing phenotypic alterations) if their ‘interaction type’ in the PSI-MI XML 2.5 record was described by the Molecular Interaction Ontology term MI:0208 ‘genetic interaction’ (http://www.ebi.ac.uk/ontology-lookup) or by any of its child terms. Such interactions were omitted from this analysis and may be filtered out interactively using the iRefWeb site search capabilities. But interactions of all types are available in iRefIndex.
In general, whenever an MI term identifier was not listed but an interaction-type term was provided, manual mapping was made to the closest MI term. Often MI terms for the interaction-detection method were (inappropriately) listed instead of those for the interaction type, in which case they were mapped to the interaction type expected for that detection method. These mappings are available at http://donaldson.uio.no/wiki/Mapping_of_terms_to_MI_term_ids_-_iRefIndex_6.0.
Interaction types in the HPRD source database were not processed, because they are systematically described in a non-standard way as in vivo or in vitro. It was assumed that all HPRD records describe physical interactions.
iRefWeb design and architecture
iRefWeb is implemented using mainly open source software tools (Figure 7). Its technology stack consists of three major components: (i) MySQL relational database (http://mysql.com/) for persistent data storage; (ii) Apache Solr enterprise search server (http://lucene.apache.org/solr/) that wraps the Lucene Java search library (http://lucene.apache.org/); and (iii) the standard MVC (model, view, control) web layer implemented using Grails web application framework (http://grails.org/). The Grails web layer provides Grails’ object relational mapping (GORM), and is built on top of Spring platform for enterprise Java applications (http://www.springsource.org/) and Hibernate library for the mapping of an object-oriented domain model to a traditional relational database (http://www.hibernate.org/).
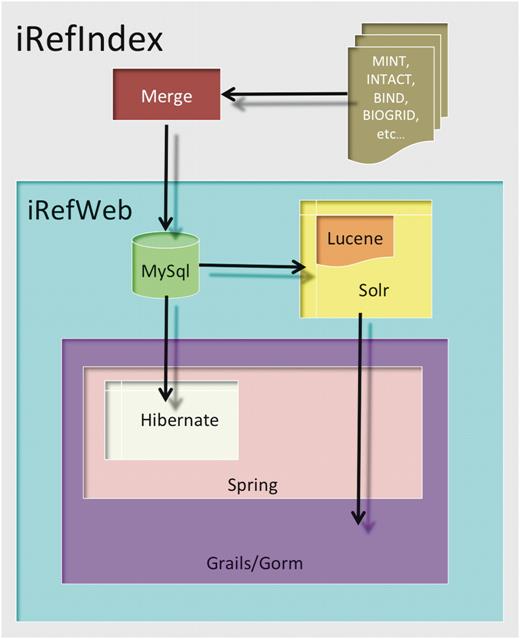
The iRefWeb architecture. The iRefWeb architecture comprises a MySQL relational database, a Solr enterprise search server and a web layer implemented using Grails web application framework. The Grails web layer provides GORM, and is built on top of Spring platform for enterprise Java applications and Hibernate library for the mapping of an object-oriented domain model to a traditional relational database (see ‘Materials and Methods’ section).
The decision to use the Solr search layer was motivated by the fact that MySQL, although robust and versatile, is a relational database not originally designed for full-text or faceted search. Solr provides a convenient and easy way to index the interaction data, as well as fast and focused retrieval of search results across search terms and interaction evidence filters (facets). The Grails framework utilizing Spring and Hibernate gave us all the advantages of a full J2EE application but without the typical code and configuration bloat, since Grails supports the ‘convention over configuration’ software design paradigm in which only the unconventional aspects of the application need to be specified. Furthermore, since Grails is built on Groovy, an agile and dynamic language for the Java Virtual Machine (http://groovy.codehaus.org/), it provided us with a rapid path from prototype to production.
Author Contribution
B.T. designed and implemented iRefWeb. S.R. performed iRefIndex data consolidation. A.L.T. analyzed the consolidated landscape. J.V. investigated interactome retrieval. E.K.C., E.C. and K.M. contributed to the implementation of iRefWeb. I.D. supervised the iRefIndex project. S.J.W. supervised the iRefWeb project. A.L.T. and S.J.W. drafted the manuscript.
Funding
Canadian Institutes of Health Research (MOP #82940); the SickKids Foundation; the Ontario Research Fund. S.J.W. is Canada Research Chair, Tier 1. Funding for open access charge: Canadian Institutes of Health Research (MOP #82940).
Conflict of interest statement. None declared.
Acknowledgements
The authors wish to thank Sandra Orchard for helpful suggestions regarding several iRefWeb features.
