


Abstract
The ultimate goal of studying model organisms is to translate what is learned into useful knowledge about normal human biology and disease to facilitate treatment and early screening for diseases. Recent advances in genomic technologies allow for rapid generation of models with a range of targeted genotypes as well as their characterization by high-throughput phenotyping. As an abundance of phenotype data become available, only systematic analysis will facilitate valid conclusions to be drawn from these data and transferred to human diseases. Owing to the volume of data, automated methods are preferable, allowing for a reliable analysis of the data and providing evidence about possible gene–disease associations.
Here, we propose Phenotype comparisons for DIsease Genes and Models (PhenoDigm), as an automated method to provide evidence about gene–disease associations by analysing phenotype information. PhenoDigm integrates data from a variety of model organisms and, at the same time, uses several intermediate scoring methods to identify only strongly data-supported gene candidates for human genetic diseases. We show results of an automated evaluation as well as selected manually assessed examples that support the validity of PhenoDigm. Furthermore, we provide guidance on how to browse the data with PhenoDigm’s web interface and illustrate its usefulness in supporting research.
Database URL:http://www.sanger.ac.uk/resources/databases/phenodigm
Introduction
Despite numerous recent successes in identifying causative mutations for genetic disorders, an associated gene has yet to be identified for many diseases. For other diseases where associated gene(s) have been found, the possibility of rarer molecular associations being discovered remains. Almost half of the known genetic diseases reported in the Online Mendelian Inheritance in Man (OMIM) database are still without an identified cause (1). The enormous number of distinct hereditary diseases and the genetic heterogeneity of many human genetic disorders represent a substantial challenge towards understanding the molecular mechanisms underlying disease. Consequently, patient sequencing and computational analysis of the results still have to advance to scale with the demand for treatment and prevention of human genetic diseases (2).
Biological investigations are enabled by the use of animal models, with the laboratory mouse, Mus musculus, proving to be one of the most important species for investigating human disease (3). An almost complete library of single gene mutations in mouse embryonic stem cells has been created (4), and a large phenotype data set already exists owing to the curation efforts of the Mouse Genome Informatics Group (5). The International Mouse Phenotyping Consortium (IMPC) aims to generate a complete phenome catalogue over the next decade through a standardized high-throughput pipeline (6). The Wellcome Trust Sanger Institute Mouse Genetics Project (Sanger-MGP) is a precursor and current partner of the IMPC and already contains phenotype characterization of 725 separate genotypes (7). Another precursor programme, the European Mouse Disease Clinic (EUDOMIC) contains data on 538 genotypes (8), although there is some overlap between the two resources.
Zebrafish (Danio rerio) is another widely used model organism in the study of human disease, particularly in the role of developmental disorders. As for the mouse, recent advances allow high-throughput generation of mutants and transgenics and their phenotype characterization. The Zebrafish Mutation Project (http://www.sanger.ac.uk/Projects/D_rerio/zmp/) will also produce a genotype–phenotype catalogue of gene function over the next few years.
Organism-specific genotype–phenotype associations can be applied to cross-species phenotype studies to elucidate previously unknown phenotype–genotype connections in the other species (9). Applying the same principle to diseases, genetic associations as well as pathways can be identified and even help with recognizing non-obvious disease associations (10). However, with the ever increasing amount of data available, automated methods are necessary to digest the existing data and reliably transform it into biological discoveries.
One obstacle in cross-species phenotype comparisons are the diverse types of phenotype representations. Phenotype representations are not only complicating cross-species integration but also data resources covering data from the same species. To overcome the differences in representation and allow the seamless integration of data repositories, standardization efforts are ongoing, not only covering procedures but also potential outcomes of experiments.
One aspect of standardization is the development and use of biological ontologies to annotate data sets (11). Both the Human Phenotype Ontology (HPO) (http://www.human-phenotype-ontology.org/) (12) and Mammalian Phenotype Ontology (MP) (13, 14) are used to annotate biological data in the domain of phenotypes. In addition to HPO and MP, a variety of other species-specific ontologies have evolved to annotate databases recording biological results in Model Organism Databases (MODs) (15). Owing to the existing variety of species-specific ontologies, algorithms are needed to allow researchers to connect concepts across ontologies, which then facilitate the transfer of biological knowledge from model organisms to human diseases.
Here, we present Phenotype comparisons for DIsease Genes and Models (PhenoDigm): a database and application that enables the connection of model organisms to human diseases based on phenotype information. PhenoDigm is built on top of the OWLSim software algorithm for cross-species phenotype comparisons (http://www.owlsim.org) (16) and is the extension and improvement of our MouseFinder application (17). We also include examples of potential novel disease candidates to illustrate the usefulness and applicability of the algorithm in addition to automated evaluation. Finally, we demonstrate here that the extension of the algorithm leads to improved results, and we also show how those results can be used to guide biological research to identify disease-causing mechanisms. More information and access to the web interface are provided online: http://www.sanger.ac.uk/resources/databases/phenodigm.
Related work
A recent review undertaken by Börnigen et al. (18) (summary of results available from http://homes.esat.kuleuven.be/∼bioiuser/gpp/) showed that most of the investigated gene prioritization tools apply a ‘guilt-by association’ approach, e.g. Endeavour (19), GeneWanderer (20) or G2D (21). Using such an approach requires established gene–disease associations to use those to generate disease and gene profiles. Based on those profiles, gene predictions and prioritization mechanisms are applied, leading to a number of gene candidates influenced by connections of genes and diseases made previously. However, those applications fail in those cases where no prior disease gene has been identified and the only reliable information available is a phenotype description. Studies incorporating only phenotype information, with a focus on the alignment and integration of phenotype data, are introduced below.
Washington et al. (16) showed that animal models can be applied to automatically predict disease gene candidates. However, at the time, no wide scale disease data set with standardized phenotypic annotations was available; therefore, the study was restricted to a small number of manually curated disease descriptions. The authors applied a method that used an early version of the OWLSim algorithm to determine the correspondence between genes, their orthologues in other species, their involvement in pathways and their potential link to human genetic diseases. To bridge between species, a combination of lexical matching and so-called Entity-Quality (EQ) statements or logical definitions were used to bridge between species (9). OWLSim executes a pairwise phenotype comparison of all possible phenotype combinations of a model and a diseases and provides the results of this pairwise phenotype comparison [see (22) for more information on semantic similarity measures]. Although Washington et al. (16) originally used zebrafish data, the method was transferred to mouse by Chen et al. (17) where the MouseFinder tool (http://mousemodels.org) provided access to the predicted disease–model associations in the context of known gene associations and mouse models where appropriate.
Another approach facilitating the integration of phenotype data across multiple species is PhenomeNET (23). Phenomena uses a set phenotype similarity measure resulting in a network of models and diseases linked by their phenotype similarity. The network incorporates data from eight different species: zebrafish, yeast, slime mold, fly, mouse, rat, worm and human and can be browsed via PhenomeBrowser (http://phenomebrowser.net/). PhenomeNET uses an extension of the EQ statements (24) and was further refined with lexical matches and a focus on one ontology to calculate the phenotype similarity measure (25).
Furthermore, Sardana et al. (26) provide an integration of human diseases and mouse models based on their phenotype descriptions. In contrast to the two previous methods, this approach did not use any semantic similarity measure. The association between a mouse model and a disease was established solely by a mapping generated on the ontologies used for annotating diseases and mouse models. Ontologies were aligned using the Unified Medical Language System (27), and the scores were provided by MetaMap (28).
Methods and materials
Here, we summarize the overall process in producing the PhenoDigm database with further details given in the following sections. Animal models with phenotype annotations and disease descriptions with their clinical phenotypes were obtained from the different MODs, OMIM (1) and the HPO team. Those phenotype descriptions were then integrated into the PhenoDigm database in preparation for the phenotype prioritization method. This method involved a three-step process to determine the pairwise phenotype similarity of a model and a disease. After scoring all models for one disease, models can be ranked according to the phenotype similarity with a disease.
These phenotype similarity scores were stored in the same database and are updated roughly four times a year. The model and disease data presented here were all downloaded on 1 October 2012. However, the update cycle is not synchronized with the update cycles of either the MODs or OMIM but still allows new data to be added on a regular basis. The data generated by the method and stored in the database are available through a web interface which enables targeted search and guided browsing of the data.
Model, disease and evaluation data
The data underlying PhenoDigm were obtained from different MODs and disease databases:
OMIM (http://omim.org/) (1) along with the HPO annotation (http://human.phenotype.org/) (12)
Sanger-MGP (http://www.sanger.ac.uk/mouse/mouseportal/) (7)
Mouse Genome Informatics Database (MGD) (http://http://www.informatics.jax.org/) (5)
Zebrafish Model Organism Database (ZFIN) (http://zfin.org/) (29)
More information about the imported data is available in Table 1. Although the current implementation only contains data from mouse and zebrafish MODs, the data structure and source code are flexible enough to gradually extend to other species.
Illustrates the models and numbers of annotations for each of the imported data resources
| Resource | noma | ob | uc | Average | Maximum | Minimum |
|---|---|---|---|---|---|---|
| Sanger- MGP | 725 | MP | 351 | 3.6 | 65 | 1 |
| MGD | 27 251 | MP | 7219 | 5.6 | 105 | 1 |
| ZFIN | 1613 | ZP | 6766 | 12.2 | 142 | 1 |
| OMIM | 4757 | HPO | 5967 | 11.2 | 120 | 1 |
| Resource | noma | ob | uc | Average | Maximum | Minimum |
|---|---|---|---|---|---|---|
| Sanger- MGP | 725 | MP | 351 | 3.6 | 65 | 1 |
| MGD | 27 251 | MP | 7219 | 5.6 | 105 | 1 |
| ZFIN | 1613 | ZP | 6766 | 12.2 | 142 | 1 |
| OMIM | 4757 | HPO | 5967 | 11.2 | 120 | 1 |
aNumber of models/diseases in this resource; bontology used for annotations; cnumber of uniquely used ontology terms (concepts); average, maximum and minimum number of annotations assigned to one entity.
Each downloaded data set is comprised of entities, which could be a particular model or a certain genetic disorder, and a set of annotations associated with that entity. An annotation in this context is an ontological concept that describes one of the phenotypes of a model or a disease, e.g. enlarged adrenal glands (MP:0000642). In most cases, diseases and models are annotated with more than one concept. The average number of annotations in addition to the minimum and maximum number of annotations are also available in Table 1.
Ontologies
Although both human- and mouse-specific data sets were annotated using pre-composed phenotype ontologies (HPO and MP), the zebrafish data were available in a post-composed phenotype description, more specifically the EQ representation (16). To integrate data from all three different data resources, either lexical mappings (http://phenotype-ontologies.googlecode.com/svn/trunk/src/ontology/hp-mp/mp_hp-align-equiv.obo) or the existing logical definitions for HPO (http://phenotype-ontologies.googlecode.com/svn/trunk/src/ontology/hp/hp-equivalence-axioms.obo) and MP (http://phenotype-ontologies.googlecode.com/svn/trunk/src/ontology/mp/mp-equivalence-axioms.obo) were used (9). Five thousand one hundred sixty-two logical definitions for HPO and 6772 logical definitions for MP were used, alongside 2048 pre-calculated lexical matches between HPO and MP. One combined ontology was created to align the individual species-specific annotations with one another. The combined ontology, covering mouse, human and zebrafish data, also included other species-independent OBOFoundry ontologies (http://obofoundry.org/) (30) to bridge between the species-specific ontologies. For instance, UBERON, Neuro-Behaviour Ontology and Phenotypic Quality Ontology were applied in the alignment process (see step one in Figure 1 and section pairwise alignment of ontology concepts with OWLSim). As for the disease and MOD data, all files were downloaded on 1 October 2012. Furthermore, we note here that in a preparation step, the EQ statements used for annotating zebrafish data sets were converted into a pre-composed phenotype presentation [(Zebrafish Phenotype Ontology (ZP)] by assigning an ID and a name to each unique EQ statement.
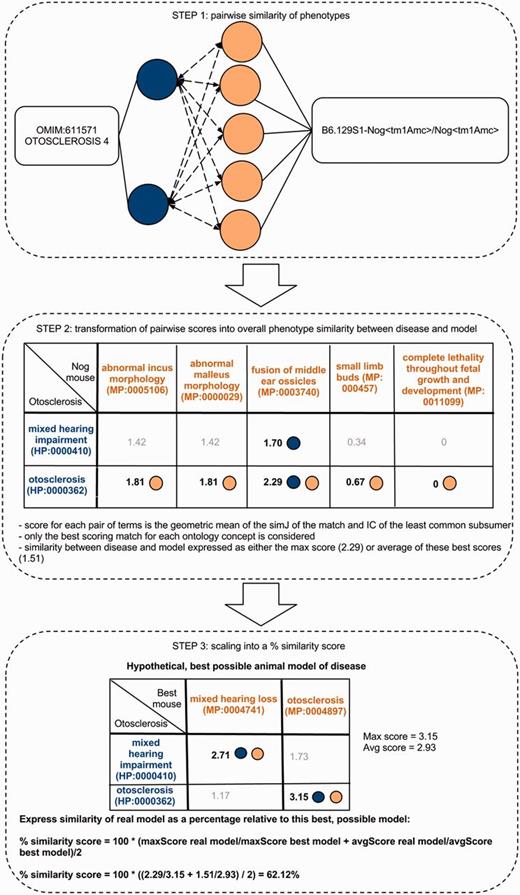
Determining the phenotype similarity of two entities, e.g. a mouse model and a disease, is a three-step process in our method. The first step is the alignment of ontology concepts based on OWLSim and assigning scores to individual pairs of ontology concepts as illustrated in the top panel of this figure. In a second step, the best scoring matches for each of the annotated ontology concepts are identified and the overall phenotype similarity score described as either the maximum or mean of these scores. In a third step, we scale these two measures relative to their maximum possible values and calculate a single combined percentage score.
Evaluation data
In addition to model and disease descriptions obtained from the MODs and OMIM, we also downloaded OMIM’s known gene–disease associations, which are maintained and stored in OMIM’s MorbidMap (http://omim.org/downloads). MorbidMap was downloaded on 1 October 2012 comprising 2048 genes, 2406 diseases and 3041 unique gene–disease annotations.
Another data set used for evaluation was MGD’s literature curated mouse models of OMIM diseases. This was also downloaded on 1 October 2012 and represents 2487 mouse models, 995 OMIM diseases and 2769 unique model–disease associations.
These data were used in our evaluation, but in the future, we intend to broaden our evaluation set with other benchmarking data (http://homes.esat.kuleuven.be/∼bioiuser/gpp/tools.php?toolid=21, Critical Assessment section).
Phenotype semantic similarity of diseases and models
In the field of semantic similarity, multiple measures have been applied, especially in the identification of gene function similarity based on the Gene Ontology (31). In this study, a three-step process is applied as illustrated in Figure 1. The ontology concepts are first aligned, and a significance score is assigned (see ‘Pairwise alignment of ontology concepts with OWLSim’ section). In practise, this means every HPO term used in the annotation of the OMIM disease data set is compared with every MP and ZP term used in MOD curation. In a second step, overall phenotype similarity scores are calculated between the two entities being considered i.e. a disease and an animal model (see ‘Determining phenotype similarity score estimation’ section). However, these overall scores are not scaled between 0 and 1, making it difficult to assess from the absolute values whether a particular model organism is truly a good disease model. Hence, we include a third step where we calculate the combination of MP or ZP terms that would optimize the scoring for a mouse or zebrafish model, respectively. We can then compare the score(s) for the model under consideration to this hypothetical, perfect animal model to obtain a scaled match.
Pairwise alignment of ontology concepts with OWLSim
To compare animal models with human diseases, the OWLSim algorithm (http://owlsim.org) was applied (16, 17). OWLSim is based on a pairwise concept alignment and, among other features, generates similarity scores for two ontology concepts. The similarity is expressed either by Jaccard Index (simJ) or Information Content (IC).
 is the inferred attributes of phenotype p
Alignments were performed for every HPO term against each MP or ZP term using a merged OWL file of Phenotypic Quality Ontology, UBERON, ZP, MP plus logical definitions, HPO plus logical definitions and the HPO and MP lexical matching file. The OMIM-HPO, MGD-MP and ZFIN-ZP annotation files were also included for the calculation of the IC values.
We evaluated the performance of PhenoDigm using the IC and simJ measures alone or in different combinations including the geometric mean of the two. The evaluations were performed exactly as described in ‘Evaluation’ section for recall of known OMIM disease–gene associations using MGD data and are shown in Supplementary Figure S1.
There was little difference in Area Under the Curve (AUC) scores, and the shape of the curve in Receiver Operating Characteristic (ROC) analysis although simJ performed worse and IC marginally better than the geometric mean of IC and simJ. In precision–recall analysis, the geometric mean gave the highest precision at the low recall levels. This corresponds to how many of the true associations are recalled in the top few hits, and this is an important requirement of PhenoDigm, as researchers are generally going to only test a few candidates in follow-up laboratory work. Consequently, the geometric mean of the IC and simJ was used in all subsequent work and in the rest of this manuscript is referred to as the score between two ontological concepts.
Determining phenotype similarity score estimation
To determine the overall phenotypic similarity between a disease and model, the pairwise comparisons between each ontological concept are considered, and only the best scoring matches for each concept are used in calculations (see middle panel of Figure 1). The raw overall similarity can be expressed as either the maximum of these best scoring matches (maxScore) or the mean average of them (avgScore).


Implementation
Although OWLSim is implemented using Java, all the remaining parts of the phenotype prioritization method are implemented using Perl (http://www.perl.org/) (version 5.8.8). Running OWLSim and analysing the data with Perl results in a phenotype similarity measure for each model–disease pair, which is then stored in a MySQL database (http://www.mysql.com/) (version 5.5.20).
The Perl scripts for generating the mouse and zebrafish disease associations are available at our Google project page (http://code.google.com/p/phenodigm) along with the various data files required as input such as the HPO-MP and HPO-ZP pairwise mapping output from OWLSim.
Implementation of web interface
The web interface was developed using the Play! framework (http://www.playframework.org/) (version 1.2.5). The Play! framework follows a Model View Controller architecture, which allows the separation of the representation of the data and the user’s interaction with the data. It can be easily configured to work with data maintained in legacy databases, in our case MySQL. The functionality of the framework was extended using jQuery (version 1.6.4) and jQuery UI (version 1.9.1).
Evaluation
Evaluation of the prioritization results was required to assess the potential of the newly introduced similarity measure. As the method establishes gene–disease and model–disease associations, an evaluation has to provide an estimate of how well our method can rank genes and models known to be associated with a disease. To estimate the performance of our method, we evaluated the resulting prioritized genes according to the known gene–disease associations contained in OMIM’s MorbidMap and the models according to the model–disease associations from MGD.
To achieve this, ROC analysis was performed using the R ROCR package (http://rocr.bioinf.mpi-sb.mpg.de/). For MGD known disease–model associations, the PhenoDigm-predicted models were ranked according to the combinedPercentageScore, and only the model(s) matching the MGD assertion were labelled as positive. For OMIM, known disease–gene association, mouse or zebrafish genes were ranked according to the maximum combinedPecentageScore obtained for any of the models involving the gene and genes labelled as positive if the human orthologue was associated by OMIM.
Results and discussion
Evaluation of PhenoDigm and comparison with previous studies
As described in ‘Evaluation’ section, we assessed the performance of our phenotype prioritization method by comparing the obtained results against the known gene–disease assocations contained in OMIM’s MorbidMap and model–disease associations curated in the MGD. The performance of the method was captured in a ROC curve, which is shown in Figure 2. In ROC analysis, obtaining an AUC score in a range of 0.5–1 indicates that the applied prioritization algorithm is valid, and the predictions conform to the existing biological knowledge, with the higher the value, the better the fit.
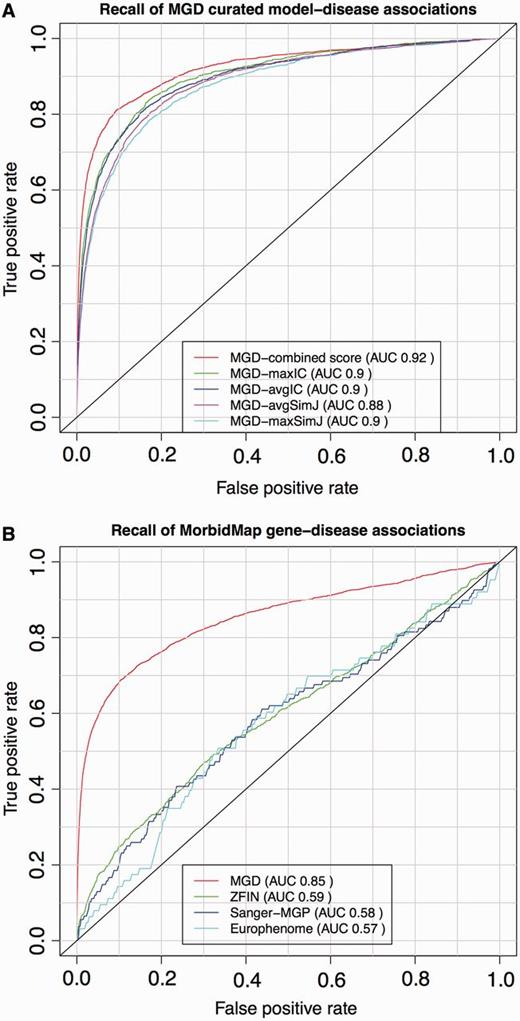
ROC analysis of PhenoDigm’s phenotype prioritization method applied to MGD’s curated mouse model–disease associations (top) and OMIM MorbidMap known gene–disease associations (bottom). The success of PhenoDigm applied to disease and MGD phenotypes is shown in the top panel for the combined score used in PhenoDigm as well as the maxIC, avgIC, maxSimJ and avgSimJ measures used for the original MouseFinder implementation. The bottom panel shows the recall of known gene–disease associations when comparing OMIM phenotypes with MGD, ZFIN, Sanger-MGP or Europhenome model organism phenotypes.
The ROC curves for the OMIM MorbidMap known disease–gene associations show the specificity and sensitivity of PhenoDigm where phenotype data from either mouse or zebrafish models involving the gene are available, and the corresponding OMIM disease is annotated using HPO. The recall using MGD data are highly significant with an AUC of 0.86. The performance using ZFIN data is less significant with an AUC of 0.58, and this could be due to a number of factors including not using any lexical mappings between human and fish phenotypes, the use of a EQ approach for ZFIN annotation, the types of phenotyping assays that are performed on zebrafish relative to mouse and clinical phenotyping, as well as the obvious extra evolutionary distance between fish and man relative to mouse. Further investigations are required to pinpoint the cause of the performance drift and optimize the application to zebrafish data.
The recall using Sanger-MGP data has an AUC of 0.58, which is significantly less than that obtained from MGD data but is only based on 108 disease–gene associations, given the current size of the Sanger-MGP data set. It would be expected that the performance using Sanger-MGP data would be less than that of the literature curated data of MGD, as the standardized high-throughput pipeline is designed to broadly cover most areas of phenotyping, but not in the level of granularity of a more targeted experiment. In addition, there may have been prior knowledge about a disease–gene association when the MGD curated mice were phenotyped, which would direct the assays to cover the clinical phenotypes and, hence, increase the likelihood of a high scoring PhenoDigm match.
Figure 2 also shows the performance for the Europhenome data set (downloaded on 7 January 2013 from http://www.europhenome.org/biomart/martview) and evaluated exactly as for the other data sets. The overall AUC score of 0.57 is equivalent to that seen for the Sanger-MGP data set, which is to be expected, given both resources record data on identical or similar high-throughout phenotyping pipelines. However, the performance at the low false positive rate end of the curve was worse. This part of the curve represents the chance of recalling the correct association in the top scoring hits, and given that this is what most users of PhenoDigm will be looking for, we decided not to include Europhenome data. The differences in performance between the Sanger-MGP and Europhenome data sets could be due to a number of factors such as differing disease–gene associations being assessed or different statistical analysis methods to assess if the raw assay data represent an abnormal phenotype. In the future, all Europhenome and Sanger-MGP data are likely to be included in the IMPC resource and the same statistical analysis applied throughout, and at this point, we will switch to using IMPC rather than Sanger-MGP as our data source for high-throughput mouse phenotype data.
The results for recall of the literature curated mouse models are even more impressive with an AUC of 0.92. If we project the MGD disease–model associations to the gene level and just look for recall of the correct gene, the AUC increases to 0.95 (data not shown). These disease–model associations are made on the basis of an assertion in the literature. Given that the MGD group manually curated the phenotypes using the same literature, we expected our method to recall these models with high specificity and sensitivity.
PhenoDigm supersedes MouseFinder (17), as it is the extension of its original implementation. It not only expands the amount of models used to prioritize disease gene candidates but also supports an additional species (zebrafish) that is fundamental to our understanding of human disease and that has a rapidly expanding catalogue of genotype–phenotype associations. Furthermore, PhenoDigm also incorporates a new semantic similarity measure that has significantly improved the performance for known gene and model associations with disease (see top panel of Figure 2 where the performance of the measures originally used in MouseFinder are also shown). In addition, the algorithm as well as database and web interface are designed now in modular fashion to facilitate easy integration of further species.
In contrast to other methods such as PhenomeNET, PhenoDigm has a three-step similarity calculation, which also includes a transformation from a pairwise phenotype comparison with a set comparison. Although, it is difficult to directly compare the AUC values obtained from previous studies, as the date of download of data sets will be different and the precise details of how the ROC analysis were run may vary, our analysis described earlier in the text compares favourably with those previously reported (23, 25).
Browsing diseases with PhenoDigm’s web interface
After downloading the model and disease-relevant phenotype descriptions from the imported databases, we applied the PhenoDigm algorithm to the data and stored the obtained results in a database. To conveniently provide access to the data, we implemented a web interface. This web interface allows the user to browse by, and search for diseases, and lists all the obtained prioritization results sorted according to species and genes (illustrated in Figure 3). Genes can then be further expanded to list all the models relevant to this disease with their corresponding phenotype similarity score and even the matched phenotype information.
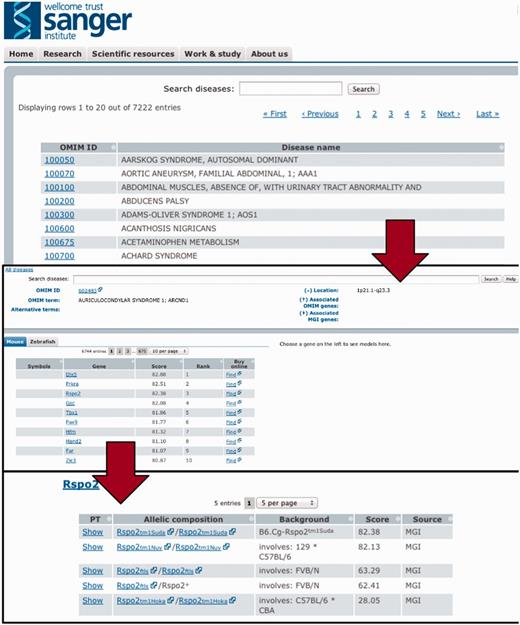
To efficiently browse the obtained prioritisation results, a web interface was developed. As illustrated here, the interface allows the user to browse by and search for diseases and obtain all prioritized models sorted according to species and genes. Genes can then be expanded to models and even to the level of phenotype descriptions to show on what basis the match occured.
Identification of novel disease candidates
The PhenoDigm prioritization method works for all human genetic diseases where phenotype descriptions are available. The established closest match may not necessarily be the key player but still can give insights into the molecular mechanisms underlying a particular disease. PhenoDigm is particularly useful in assessing diseases where we possess only a fairly limited knowledge of the genes involved, as it only relies on the phenotype. To demonstrate that PhenoDigm is also capable of making biological connections between a disease and genotype, we will illustrate some examples here that were manually assessed. One example is shown for each of the three-model organism data sets; we currently include in PhenoDigm (MGD, Sanger-MGP and ZFIN), and each is chosen on the basis that PhenoDigm has identified a novel candidate for a disease and confirming evidence from previous biological studies exists. We are currently performing a validation study of some of our strong candidates in collaboration with researchers sequencing the relevant clinical samples, and the success rate of this will be the subject of a future publication.
Auriculocondylar syndrome (ACS; OMIM:602483) is an autosomal dominant disorder characterized by clinical features including cleft palate, dental crowding and malocclusion, apnea, dyspnea, mandibular condyle aplasia, micrognathia, narrow mouth and speech articulation difficulties. Our third best match for this syndrome from all 27 251 MGD mouse models is a mouse model involving a targeted insertion to knock-out all function of the Rspo2 gene: B6.Cg-Rspo2 / Rspo2
 (http://www.informatics.jax.org/accession/MGI:3839444).
The human disease phenotypes are phenocopied by the mouse with its MP annotations of cleft secondary palate, maxillary shelf hypoplasia, cyanosis, respiratory failure, abnormal pulmonary alveolus morphology, absent mandibular coronoid process, decreased palatine shelf size and abnormal arytenoid, cricoid, laryngeal and tracheal cartilage morphology. This year, exome sequencing of ACS patients has identified associated mutations in two genes (GNAI3 and PLCB4), and the mechanism of action is proposed to be disruption of the endothelin-1-distal-less homeobox 5 and 6 pathway (EDN1-DLX5/DLX6) (32). Interaction of Rspo2 with key members of this pathway have been recently described (33), and interestingly, mouse models involving disruption of other members of this pathway (Dlx5, Dlx6, Hand2 and Edn1) also score in the top 50 matches. These data lend strength to the proposal that disruption of the EDN1-DLX5/6 pathway is the mechanism of action in ACS and suggests that exome sequencing of further patients may uncover rarer mutations in other genes such as RSPO2.
Palmoplantar keratoderma, bothnian type (OMIM:600231) is a rare autosomal-dominant disorder where linkage analysis of patients has narrowed down the associated gene to a region between D12S85 and D12S270 on 12q11-q13 (34). The best candidate for this disease from PhenoDigm analysis of the Sanger-MGP data set is a heterozygous mouse involving targeted knock-out of the Krt76 gene: Krt76 (http://www.sanger.ac.uk/mouseportal/search?query=Krt76). This model has a combinedPercentageScore of 84.3% and only 10 of the 27 251 MGD models scored higher. This model exhibits hyperkeratosis and parakeratosis of the foot pads, which closely mimic the clinical features of hyperkeratosis of the palms of the hands and soles of the feet. In addition, the human orthologue KRT76 is located within the linkage region described earlier in the text, and other members of the Keratin type II gene cluster are known to cause forms of palmoplantar keratoderma (35).
Orofacial cleft-1 (OMIM:119530) is an autosomal disorder where linkage analysis has narrowed the associated gene to a region on 6p24.3 (36). A zebrafish model involving disruption of the tfap2a gene (ZDB-GENE-011212-6) (http://http://zfin.org/cgi-bin/webdriver?MIval=aa-fxfigureview.apg&OID=ZDB-FIG-100202-4) has a combinedPercentageScore of 69.3%, and although only ranking 51st overall, it exhibits an abnormal split ethmoid cartilage. A split ethmoid cartilage probably represents a homologous phenotype to cleft upper lip in humans. Intriguingly, TFAP2A, the human orthologue, maps within the critical region, making it a suitable candidate for further study. In addition, the breakpoints of balanced translocations in three patients with this disorder were located just 375–930 kb 5′ of the TFAP2A gene, suggesting possible regulatory disruption (37). Finally, TFAP2A has been shown to be associated with another Mendelian disorder, Branchiooculofacial syndrome (OMIM:113620) with a range of abnormalities including cleft lip/palate (38).
Conclusions and future work
In this article, we introduced a new algorithm to prioritize gene candidates for human genetic disorders based on curated data sets of phenotype annotations. The algorithm was evaluated based on known gene–disease and animal model–disease associations using ROC curves and manually assessing a subset of the diseases with their highly ranked models and, consequently, gene candidates. We showed that our method is a valid approach to integrate diverse data sources and use the integrated data to establish gene–disease associations. In addition, we also showed how the data can be browsed and put to further use, e.g. to guide biological experiments.
In future work, we intend to also evaluate our method against other benchmarking resources and improve the overall performance by identifying cases where known biological knowledge is missed and address this by improving the underlying ontological mappings, algorithm and scoring measure as appropriate.
Another aspect will be the application of PhenoDigm to the emerging IMPC and the Zebrafish Mutation Project data sets to uncover potential new disease associations and candidates for more detailed phenotyping.
Our major focus, however, will be on the application of PhenoDigm to discover novel disease–gene associations and validation of these through collaboration with groups performing next-generation sequencing of human clinical samples and further phenotyping of the disease-associated animal models.
Acknowledgements
The authors thank the work of the curators at the following groups that made this study possible: MGD, OMIM, ZFIN and the HPO team at Charite University, Berlin. D.S. designed the study, developed PhenoDigm’s scoring method and implemented all required Perl scripts. A.O.E. designed and implemented PhenoDigm’s web interface. C.M. and S.L. provided the OWLSim source code, guidance and support and how to apply OWLSim to the input data. S.K. and P.R. generated the pre-composed version of zebrafish annotations (ZP), that was then curated and corrected by B.R. and M.W. All contributed to the final manuscript.
Funding
This work was supported by core infrastructure funding from the Wellcome Trust, the Director, Office of Science, Office of Basic Energy Sciences, of the U.S. Department of Energy [Contract No. DE-AC02-05CH11231] and the National Institutes of Health [R24OD011883 and R01 grant HG004838-02]. Funding for open access charge: core infrastructure funding from the Wellcome Trust.
Conflict of interest. None declared.
References
Author notes
Citation details: Smedley,D., Oellrich,A., Köhler,S., et al. PhenoDigm: analyzing curated annotations to associate animal models with human diseases. Database (2013) Vol. 2013: article ID bat025; doi: 10.1093/database/bat025
