


Abstract
Biomedical information retrieval systems are becoming popular and complex due to massive amount of ever-growing biomedical literature. Users are unable to construct a precise and accurate query that represents the intended information in a clear manner. Therefore, query is expanded with the terms or features that retrieve more relevant information. Selection of appropriate expansion terms plays key role to improve the performance of retrieval task. We propose document frequency chi-square, a newer version of chi-square in pseudo relevance feedback for term selection. The effects of pre-processing on the performance of information retrieval specifically in biomedical domain are also depicted. On average, the proposed algorithm outperformed state-of-the-art term selection algorithms by 88% at pre-defined test points. Our experiments also conclude that, stemming cause a decrease in overall performance of the pseudo relevance feedback based information retrieval system particularly in biomedical domain.
Database URL: http://biodb.sdau.edu.cn/gan/
Introduction
Retrieving documents that match the user query is one of the foremost challenge in almost all information retrieval systems. Continuous increase in literature causes keywords mismatch problem between user query and retrieved documents (1). To retrieve documents by measuring similarity between user query and indexed documents is even more difficult in biomedical domain because genes, drugs and diseases may have numerous synonyms. For example, a user inputs a query containing keywords like ‘Medical Practitioner’ and corpus has only relevant documents however all the documents contain the words such as doctor, physician etc. It can be seen that all the terms of documents are conveying same information but these are named differently due to which mismatch problem will occur and these documents which are more relevant to the query as compared to others will not be retrieved. In order to tackle this problem local and global query expansion (QE) is used. In global QE, knowledge sources and dictionaries like (WordNet, PubMed) are used to generate candidate expansion terms (2).
In local QE, statistical information is used to find candidate expansion terms from corpus. In this approach, documents are retrieved based on user query and top k retrieved documents are considered relevant. To select candidate expansion terms from top retrieved documents, different term selection techniques like chi-square, information gain (IG), Kullback–Leibler divergence (KLD) and dice are used. It has been observed that the online available data has vividly increased in volume while the number of query terms is very scarce (3).
According to Lesk et al. average query length used to be 2.30 (4) words and it remained same even after 10 years (5). At present, there has been a rise in the trend of providing quite lengthy queries containing (five or more words), but still most common queries contain only couple of words (6). Therefore, the scope of QE has increased over the time. QE can also decrease the performance of information retrieval. In global QE candidate expansion terms extracted from dictionaries may cause decrease in performance due to word ambiguity problem. If we have a query like ‘Which bank provides more profit?’, to expand this query, we will find synonyms of query terms from dictionaries. In this query word ‘bank’ can be used in two different scenarios. It can be either used to refer financial institution or river bank. Therefore, in global QE word sense disambiguation in query words is mandatory. Lesk algorithm is used for word sense disambiguation (7).
In local QE all the retrieved documents against a particular user query are not relevant to the user query (8). This may lead to the imperfect and faulty terms pool (the pool of all terms present in top retrieved documents) that may contain many redundant and irrelevant terms. Expanding the query with such terms may even drift the query to retrieve irrelevant items (3). Hence idea behind the selection of candidate expansion terms from terms pool is to first remove these redundant or irrelevant terms from the term pool. Term selection for QE will allow only the selection of most relevant terms against particular user query. Therefore, these days term selection for QE is one of the hottest topics of research in the domain of information retrieval (9).
There are two major types of term selection methods for QE: (i) based on corpus statistics and (ii) based on term association. The choice of these methods depends on the document retrieval models e.g. Okapi BM25, TFIDF and Language Models (3). The selection methods based on term association are used to evaluate the goodness of terms based on their co-occurrence in the feedback documents. Whereas, selection methods based on corpus statistics are used to estimate the goodness of the terms based on their distribution in the corpus. In biomedical domain, it is still a huge challenge for researchers to develop an extraordinary performing term selection method for QE that must be able to outperform available methods with a very high edge (10).
Mostly widely used term selection method ‘Chi-Square’ suffers from document misclassification problem as its ability to select most affective and worthy terms for QE gets affected by the defined threshold of relevant and non-relevant class in pseudo relevance feedback. To tackle mentioned problem, we propose a new technique document frequency chi-square (DFC) and compare it with eight term selection algorithms including two different versions of chi-square proposed by Carpineto (11). Moreover, in biomedical domain effects of pre-processing on the performance of pseudo relevance feedback are also discussed. We used mean average precision (MAP) to evaluate the integrity of presented algorithm on TREC 2006 Genomic (12) dataset.
Related work
Efficient information retrieval systems are required to get relevant information against particular user query from rapidly growing biomedical literature (13). A major concern in information retrieval system is the word mismatch problem in which the same concept may be described using semantically similar but having syntactically different from of terms in both query and documents (14). For example, user query may contain a phrase like ‘cure of depression’, but the corpus documents may have different yet semantically similar phrase like ‘depression treatment’. Both are referring to same concept with different words. This problem can be solved using two approaches: query paraphrasing and QE.
In query paraphrasing approach, query words are replaced by their synonyms in order to generate query paraphrases. In above example, ‘cure’ can be replaced by its synonym ‘treatment’ to generate the paraphrase ‘treatment of depression’. Generated paraphrases are then used to retrieve documents from corpus. Zukerman et al. used WordNet (15) and parts of speech information to find the synonyms for paraphrase generation. Their experiment revealed a reasonable improvement in the process of retrieving relevant documents despite having issues in part-of-speech (POS) tagging (16).
QE techniques can further be categorized as global and local techniques. In global QE, dictionaries and knowledge resources are used to find expansion terms (17). Chu et al. performed global QE by selecting the candidate expansion terms using knowledge resources of UMLS Meta-Thesaurus and Semantic Networks. They showed 33% improvement in performance of ohsumed dataset based 40 queries, by expanding these queries using domain specific knowledge resources and document retrieval models (18). On the other hand, Stokes et al. (19) used various biomedical knowledge resources like GO, EntrezGene, ADAM etc. to improve the overall performance of information retrieval system. They also claimed that the performance of information retrieval system (19) can be increased by focusing on two factors: choice of good document ranking algorithm; and use of domain specific knowledge resources.
One of the concerns with global QE is the fact that due to unstoppable progress in new discoveries and ongoing research, available knowledge resources are in constant need of update. However, it is difficult to update the available knowledge resources rapidly. Therefore, researchers of information retrieval community are focusing on improving the system using local QE. In this approach, user queries are provided to retrieval models (Okapi BM25, TFIDF) which rank the corpus documents by measuring similarity between queries and documents. Top K documents are labeled as relevant to user information. These retrieved documents are used to generate term pool which contains all terms present in relevant documents. Different techniques like chi-square, IG, KLD, CoDice etc. are used to select terms from generated term pool. Jagendra et al. improved the performance of local QE method by introducing an aggregation technique for term selection. They combined four term selection techniques [KLD, co-occurrence, Robertson selection value (RSV) and IG] using proposed aggregation method. In order to apply Borda combination technique, all the individual term selection methods are applied and lists of candidate terms are obtained from all the methods. These ranked lists are then used to select the final QE terms. Terms having highest aggregation score chosen as the final expansion terms. Jagendra et al. illustrated that some of the expansion terms caused query drift (20). In order to tackle this problem, they performed semantic filtering by applying word2vec approach and showed 2% improvement in results.
Some researchers are also looking for ways to combine both local and global QE techniques (21, 22). In this regard, Pal et al. proposed a methodology which combined the terms generated from WordNet and two local QE (23) term selection techniques [i.e. KLD (24) and RSV (25)]. They showed that precision of retrieval model could be improved by extending the query with candidate terms generated from local and global QE (26). Abdulla et al. combined terms from both global and local QE. For global QE, they used knowledge resources like PubMed (27) and MetaMap (28), whereas for local QE, Lavrenko relevance feedback (LRF) (29) and MFT (30) techniques were used. A linear combination approach was introduced to combine the scores generated by individual techniques. This combined score was used to select the final QE terms. They selected one method from global QE and one from local QE. By doing so, they experimented with various combination pairs and found that the best performance was obtained using linear combination approach on PubMed (https://www.ncbi.nlm.nih.gov/pubmed/) and LRF (22).
In our experimentation, we have exploited pseudo relevance feedback in which documents are ranked against particular user query. Top ranked k documents are selected as relevant for the selection of candidate of expansion terms. As there are no explicit defined criteria to select threshold (top k) for documents, there is a strong chance that arbitrarily selected threshold may cause document misclassification problem as some known relevant documents may get wrongly classified as relevant and vice versa. Traditionally used chi-square does not tackle mentioned problem while selecting expansion terms. We proposed a modified version of ‘Chi-Square’ which is able to alleviate the problem of document misclassification occurred due to selection of arbitrary threshold. We have evaluated our proposed term selection algorithm against eight state-of-the-art term selection algorithms and have shown the overall comparison. We have also tested the effect of stemming on information retrieval in particularly biomedical domain.
Methodology
This section presents the methodology of pseudo relevance feedback emphasizing on the pre-processing of dataset. The dataset obtained from TREC website exists in HTML format having irrelevant information like email addresses, article digital signature, journal publishing dates and years etc. In order to remove this irrelevant content from the dataset, Apache Tika parser (https://tika.apache.org/0.7/parser.html) is used. Furthermore, all stop words such as is, am, are, about, etc. are removed from the dataset and user query by exploiting the default stop words list of solr named as ‘stop.txt’. It contains 33 English stop words. After this, we converted all the terms into their base form using Porter Stemmer. The steps involved in pre-processing of HTML documents are shown in Figure 1.
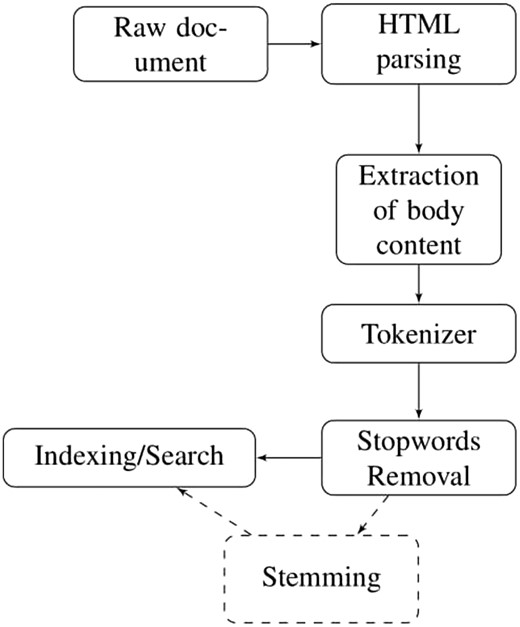
Pre-processing.
To measure the effect of stemming on the performance of retrieval task, we have indexed the dataset with and without stemming.
Performance of pseudo relevance feedback depends upon two significant factors: number of top relevant documents retrieved by document retrieval model, and term selection algorithm (20). Famous documents retrieval models are Okapi BM25, language models [unigram, bi-grams, n-grams (23)], TF-IDF etc. In our experimentation, we have used Okapi BM25 as our document retrieval model.
Before feeding the user query to document retrieval model, all stop words are removed from user query. Since we have two different types of datasets i.e. stemmed and non-stemmed, therefore, user query is stemmed only for stemmed dataset. User query is then provided to document retrieval model which retrieves a list of ranked documents. Top k ranked documents are chosen for pseudo relevance feedback and only unique terms of these documents are used to create term pool. Various term selection techniques (mentioned in Section 5) are used to rank the terms for QE. Only top n terms are used to expand particular user query which is then sent back to retrieval model for final document retrieval. Using this expanded query, final ranked documents are retrieved. Figure 2 illustrates all the phases of PRF technique sequentially.
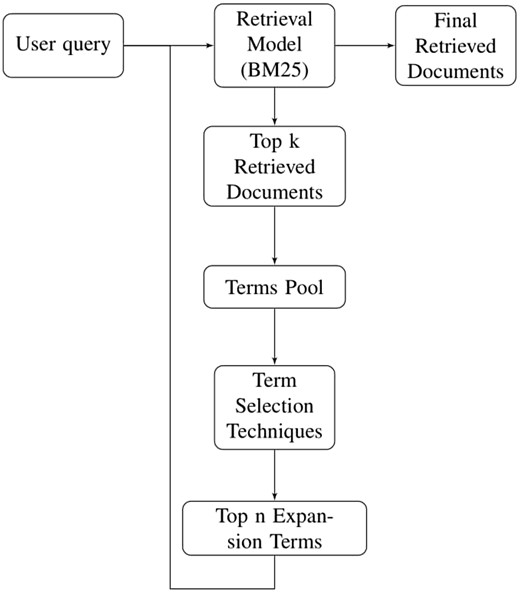
Methodology for pseudo relevance feedback.
Okapi bm25 weighting algorithm
k1 and k3 are the parameters that are used to weight the effect of term frequency in document and query, whereas b is used as tuning constant to control normalization.
freqid depicts the frequency of the occurrence of the term in document d.
freqiq is the occurrence frequency of term in query q.
dl and avdl illustrate document length and average document length in the corpus, respectively.
whereas,
Term selection metrics
It is pretty obvious that corpus may have redundant and irrelevant terms that can cause query drift. To avoid this, all terms of corpus are ranked on the basis of statistical information used in various term ranking methods. In this section we will discuss eight such term ranking methods in context of QE.
A. Kullback–Leibler divergence (KLD)
Equation (3) is used to assign scores to terms present in the term pool. This technique assigns scores fall in the range of 0–1. The term having 0 score is considered as irrelevant term. Similarly, a score of 1 shows that the term is an excellent candidate for QE.
B. Co-occurrence based query expansion
C. Information gain (IG)
IG is an algorithm that utilizes the knowledge about the presence or absence of particular term in documents to find the degree of class prediction (34). Let be the set of classes where C1 belongs to top retrieved relevant documents and C2 belongs to non-relevant documents.
D. Probabilistic relevance feedback (PRF)
E. Chi-square (CS)
F. Lavrenko relevance feedback (LRF)
Proposed term selection metric: document frequency chi-square (DFC)
= term document frequency in relevant class,
= term document frequency in corpus,
= term document frequency in non-relevant class,
= term absence in non-relevant class,
= term absence in relevant class and
= term absence in corpus.
Dataset and evaluation measure
In order to address the information retrieval system that targets the needs of biomedical scientists and geneticists, TREC 2006 Genomic Track (38) dataset is selected. This dataset consists of 162 259 documents having total 1 437 356 250 unique terms from 49 journals published electronically at Highwire Press. These are HTML documents obtained by using web crawler on the Highwire Press website. The full collection is 12.3 GB in size.
MAP is used to evaluate the performance of nine term selection algorithms using Okapi BM25 as retrieval model. This evaluation measure is widely used in information retrieval system. Mathematical expressions of average and MAP are given below
a: Average precision
r is rank,
N denotes the number of retrieved documents,
is a function that tells whether a document is relevant or not (binary) and
stands for precision.
b: Mean average precision
Practical illustration of TREC data
This section summarizes the background of strategical decisions taken in context of typical behavior of the system over different queries. It also depicts the source of query drift in quest of further improvements while producing and comparing results.
Table 1 shows performance difference of two algorithms (DFC and chi-square) and baselines for 36 queries of TREC Dataset. All results have been calculated on the following benchmark: documents =40, top terms =10. Delta(DFC-CS) shows the difference in precision of DFC and Chi-Square. The most positive value of delta(DFC-CS) shows that DFC has outperformed chi-square. On the other hand, the most negative value depicts victory of chi-square over DFC with a huge margin. By observing the differences, we notice that query 201 has the most positive value of delta(DFC-CS) whereas query 207 has most negative.
Summary of difference in precision for 36 TREC queries
| Queries | Precision | Base line | PΔ (Term selection—base line) | |||
|---|---|---|---|---|---|---|
| DFC | chi-square | Δ (DFC-CS) | Δ (DFC-BS) | Δ (CS-BS) | ||
| 200 | 0.3819 | 0.4123 | 0.3796 | −0.0304 | 0.0023 | 0.0327 |
| 201 | 0.9755 | 0.5599 | 0.5825 | 0.4156 | 0.393 | −0.0226 |
| 202 | 0.039 | 0.0439 | 0.0528 | −0.0049 | −0.0138 | −0.0089 |
| 203 | 0.6378 | 0.6334 | 0.6393 | 0.0044 | −0.0014 | −0.0059 |
| 204 | 0.6649 | 0.6637 | 0.6423 | 0.0012 | 0.0226 | 0.0214 |
| 205 | 0.1658 | 0.1349 | 0.1954 | 0.0309 | −0.0296 | −0.0605 |
| 206 | 0.5315 | 0.3412 | 0.4337 | 0.1903 | 0.0978 | −0.0925 |
| 207 | 0.0744 | 0.1364 | 0.0661 | −0.062 | 0.0083 | 0.0703 |
| 208 | 0.4222 | 0.462 | 0.264 | −0.0398 | 0.1583 | 0.1981 |
| 209 | 0.5115 | 0.1994 | 0.2644 | 0.3121 | 0.2471 | −0.065 |
| 210 | 0.0651 | 0.0737 | 0.0764 | −0.0086 | −0.0113 | −0.0027 |
| 211 | 0.4594 | 0.2348 | 0.3481 | 0.2246 | 0.1113 | −0.1133 |
| 212 | 0.3631 | 0.3555 | 0.3941 | 0.0076 | −.031 | −0.0386 |
| 213 | 0.5186 | 0.5587 | 0.5306 | −0.0401 | −.0121 | 0.0281 |
| 214 | 0.558 | 0.4891 | 0.5408 | 0.0689 | 0.0171 | −0.0517 |
| 215 | 0.39 | 0.3247 | 0.4557 | 0.0653 | −0.0657 | −0.131 |
| 216 | 0.1085 | 0.0849 | 0.0808 | 0.0236 | 0.0277 | 0.0041 |
| 217 | 0.0031 | 0.001 | 0.0051 | 0.0021 | −0.002 | −0.0041 |
| 218 | 0.2355 | 0.2021 | 0.2834 | 0.0334 | −0.0479 | −0.0813 |
| 219 | 0.0201 | 0.0875 | 0.0839 | −0.0619 | −0.0638 | 0.0036 |
| 220 | 0.9151 | 0.9242 | 0.8556 | −0.0092 | 0.0595 | 0.0687 |
| 221 | 0.0001 | 0.0001 | 0.0001 | 0.0001 | 0.0001 | 0.0001 |
| 222 | 0.0964 | 0.0648 | 0.0852 | 0.0316 | 0.0112 | −0.0204 |
| 223 | 0.2323 | 0.1166 | 0.4105 | 0.1157 | −0.1782 | −0.2939 |
| 224 | 0.0298 | 0.0215 | 0.2268 | 0.0083 | −0.197 | −0.2053 |
| 225 | 0.0909 | 0.0833 | 0.0164 | 0.0076 | 0.0745 | 0.0669 |
| 226 | 0.7449 | 0.6847 | 0.303 | 0.0603 | 0.4419 | 0.3817 |
| 227 | 0.1663 | 0.1455 | 0.1716 | 0.0208 | −0.0053 | −0.026 |
| 228 | 0.005 | 0.0046 | 0.005 | 0.0004 | 0 | −0.0004 |
| 229 | 0.6221 | 0.4988 | 0.5042 | 0.1232 | 0.1179 | −0.0053 |
| 230 | 0.1966 | 0.0864 | 0.0905 | 0.1102 | 0.1061 | −0.0041 |
| 231 | 0.1169 | 0.038 | 0.1344 | 0.079 | −0.0175 | −0.0964 |
| 232 | 0.0841 | 0.0797 | 0.0833 | 0.0044 | 0.0008 | −0.0036 |
| 233 | 0.1 | 0.0488 | 0.0875 | 0.0513 | 0.0126 | −0.0387 |
| 234 | 0.1158 | 0.085 | 0.1162 | 0.0307 | −0.0004 | −0.0311 |
| 235 | 0.1298 | 0.1315 | 0.1771 | −0.0016 | −0.0473 | −0.0457 |
| MAP | 0.2992 | 0.2504 | 0.2663 | 0.0489 | 0.0329 | −0.0159 |
Delta(DFC-BS) and delta(CS-BS) are the differences in the performance of information retrieval system after applying QE using algorithms (DFC and chi-square) and without applying any QE (baseline).
These columns show the effect on the performance after applying QE techniques. Positive value of the delta shows an increase in performance after applying QE whereas negative value depicts decline in performance due to QE. It is pretty easy to see that negative value of delta in both cases is directly proportional to the query drift. It can be seen from the table that 16 out of 35 queries have shown a decrease in performance due to query drift using DFC. On the other hand, by applying QE using chi-square, only 9 out of 36 queries have shown an improved performance. For delta(DFC-BS), the best performance has observed for query 225 and for delta (CS-BS), query 226 has marked the most increase in precision after applying QE. Highlighted values at the bottom of the table illustrates mean average precision difference of mentioned algorithms.
In order to further explore chi-square term selection algorithms, query 201 and 207 are selected as they have revealed best performance for DFC and chi-square, respectively. These two algorithms are applied again on query 201 and 207 to obtain top 10 terms from top 40 retrieved documents. The selected terms are listed in Tables 2 and 3.
Top 10 terms selected by chi-square and DFC for query 201 (precision is shown by adding each term to query)
| Top 10 terms ranked by DFC | |||||||||||
|---|---|---|---|---|---|---|---|---|---|---|---|
| Terms | Baseline | calipel | v599e | nature00766 | mouriaux | v600e | trovisco | braf | 418934a | shieldsj | klintenas |
| Precision | 0.5825 | 0.6426 | 0.9320 | 0.9569 | 0.8647 | 0.9267 | 0.9371 | 0.9404 | 0.9676 | 0.9676 | 0.9735 |
| Top 10 terms ranked by chi-square | |||||||||||
| Terms | Baseline | braf | ras | raf | transgelin | cref | 9nc | vmm12 | v600e | uveal | kras |
| Precision | 0.5825 | 0.7632 | 0.7960 | 0.8127 | 0.6528 | 0.5598 | 0.5018 | 0.5657 | 0.7561 | 0.7977 | 0.8307 |
| Query Terms | genes | associated | cancer | ||||||||
Top 10 terms selected by chi-square and DFC for query 207 (precision is shown by adding each term to query)
| Top 10 terms ranked by DFC | |||||||||||
|---|---|---|---|---|---|---|---|---|---|---|---|
| Terms | Baseline | etidronate | alendronate | bisphosphonates | didronel | risedronate | ibandronate | bisphosphonate | art271 | int1999; 9 | pprice |
| Precision | 0.06613926 | 0.0798 | 0.0946 | 0.147 | 0.1557 | 0.1523 | 0.1777 | 0.1874 | 0.1736 | 0.1689 | 0.164 |
| Top 10 terms ranked by chi-square | |||||||||||
| Terms | Baseline | etidronate | fetuin | bisphosphonates | incadronate | paget’s | pamidronate | aminobisphosphonates | ibandronate | bisphosphonate | tiludronate |
| Precision | 0.06613926 | 0.0798 | 0.0695 | 0.1265 | 0.1604 | 0.1691 | 0.2286 | 0.204 | 0.2056 | 0.2073 | 0.2609 |
| Query Terms | toxicities | associated | etidronate | ||||||||
Original query is expanded by adding one term at a time and precision is measured just to reveal the positive or negative effects of newly added term over QE. Results of incremental QE obtained after iterating over all 10 terms are shown in Tables 2 and 3. As observed from the tables, expanding user query with selected terms has marked a reasonable boost in the performance of specified query.
Tables 4 and 5 depict the unique terms selected by chi-square and DFC for queries 201 and 207, respectively. Both tables also show the document frequency based parameters as well as the probabilities used by chi-square. To lay out a clear picture of the importance of terms against each algorithm, ranks of these unique terms as determined by their scores of chi-square and DFC are also shown.
Scores of 18 unique terms selected by chi-square and DFC for query 201 on 40 documents
| Terms | P (relevance) | P (corpus) | CS | DFC | ||||||
|---|---|---|---|---|---|---|---|---|---|---|
| braf | 0.00082 | 3.39E-07 | 14 | 162150 | 69 | 26 | 1.9978 | 1 | 9558.411 | 7 |
| ras | 0.01085 | 9.00E-05 | 38 | 149277 | 12942 | 2 | 1.2877 | 2 | 411.485 | 16 |
| raf | 0.00652 | 3.36E-05 | 40 | 157245 | 4974 | 0 | 1.2516 | 3 | 1254.757 | 13 |
| transgelin | 0.00035 | 1.26E-07 | 1 | 162197 | 22 | 39 | 0.95 | 4 | 174.442 | 18 |
| cref | 0.00037 | 1.64E-07 | 1 | 162203 | 16 | 39 | 0.8312 | 5 | 236.704 | 17 |
| 9nc | 0.00015 | 4.31E-08 | 1 | 162216 | 3 | 39 | 0.5542 | 6 | 1012.394 | 14 |
| vmm12 | 0.00012 | 3.27E-08 | 1 | 162219 | 0 | 39 | 0.4639 | 7 | 4055.5 | 11 |
| v600e | 0.00012 | 3.34E-08 | 5 | 162217 | 2 | 35 | 0.4351 | 8 | 14481.607 | 4 |
| uveal | 0.00031 | 2.44E-07 | 3 | 162144 | 75 | 37 | 0.3911 | 9 | 462.41 | 15 |
| kras | 0.00043 | 4.81E-07 | 6 | 162130 | 89 | 34 | 0.3783 | 10 | 1526.484 | 12 |
| calipel | 0.00002 | 5.57E-09 | 5 | 162219 | 0 | 35 | 0.079 | 12 | 20278 | 1 |
| v599e | 0.00011 | 4.80E-08 | 8 | 162214 | 5 | 32 | 0.2523 | 11 | 19960.861 | 2 |
| nature00766 | 0.00003 | 2.23E-08 | 12 | 162199 | 20 | 28 | 0.0444 | 15 | 18238.237 | 3 |
| mouriaux | 0.00003 | 9.04E-09 | 5 | 162217 | 2 | 35 | 0.0759 | 13 | 14481.607 | 5 |
| trovisco | 0.00001 | 3.48E-09 | 3 | 162219 | 0 | 37 | 0.0494 | 14 | 12166.65 | 6 |
| 418934a | 0.00001 | 7.65E-09 | 5 | 162213 | 6 | 35 | 0.0224 | 17 | 9212.159 | 8 |
| shieldsj | 0.00001 | 2.09E-09 | 2 | 162219 | 0 | 38 | 0.0296 | 16 | 8111.05 | 9 |
| klintenas | 0.00001 | 1.39E-09 | 2 | 162219 | 0 | 38 | 0.0197 | 18 | 8111.05 | 10 |
Scores of 18 unique terms selected by Chi-square and DFC for query 207 on 40 documents
| Terms | P (relevance) | P (corpus) | CS | DFC | ||||||
|---|---|---|---|---|---|---|---|---|---|---|
| etidronate | 0.0019 | 3.10E-07 | 40 | 162186 | 33 | 0 | 11.64 | 1 | 88891 | 1 |
| fetuin | 0.0029 | 1.70E-06 | 4 | 161944 | 275 | 36 | 4.941 | 2 | 225.14 | 16 |
| bisphosphonates | 0.0017 | 9.03E-07 | 32 | 161948 | 271 | 8 | 3.208 | 3 | 13674 | 3 |
| incadronate | 0.0003 | 5.90E-08 | 4 | 162214 | 5 | 36 | 1.525 | 4 | 7205.69 | 12 |
| paget’s | 0.0008 | 3.70E-07 | 6 | 162119 | 100 | 34 | 1.728 | 5 | 1366.93 | 15 |
| pamidronate | 0.0012 | 7.50E-07 | 18 | 162081 | 138 | 22 | 1.918 | 6 | 8399.17 | 11 |
| aminobisphosphonates | 0.0003 | 7.60E-08 | 6 | 162202 | 17 | 34 | 1.184 | 7 | 6339.73 | 13 |
| ibandronate | 0.0006 | 3.60E-07 | 12 | 162184 | 35 | 28 | 0.999 | 8 | 12411 | 6 |
| bisphosphonate | 0.0007 | 4.80E-07 | 26 | 162023 | 196 | 14 | 1.019 | 9 | 12320.1 | 7 |
| tiludronate | 0.0001 | 3.40E-08 | 5 | 162206 | 13 | 35 | 0.294 | 10 | 5626.01 | 14 |
| alendronate | 0.0005 | 6.40E-07 | 24 | 162096 | 123 | 16 | 0.39 | 12 | 15865.1 | 2 |
| didronel | 1.80E-05 | 5.50E-09 | 4 | 162218 | 1 | 36 | 0.059 | 16 | 12976.3 | 4 |
| risedronate | 0.0003 | 1.90E-07 | 12 | 162186 | 33 | 28 | 0.473 | 11 | 12963.5 | 5 |
| art271 | 1.40E-05 | 2.08E-09 | 3 | 162219 | 0 | 37 | 0.098 | 14 | 12166.7 | 8 |
| int1999; 9 | 1.40E-05 | 2.08E-09 | 3 | 162219 | 0 | 37 | 0.098 | 15 | 12166.7 | 9 |
| pprice | 3.20E-05 | 7.60E-09 | 4 | 162217 | 2 | 36 | 0.135 | 13 | 10812.3 | 10 |
As shown in the Table 4, chi-square has assigned highest score to the term braf while DFC ranks calipel as the top term. A close inspection of document frequency parameters show that braf is present in 14 relevant documents and 69 non-relevant documents. On the other hand, calipel is present in five documents of relevant class and it is entirely absent in non-relevant documents. Due to this reason, DFC considers it a highly discriminative term to differentiate between relevant and non-relevant class. Similarly, we observe second term ranked by both algorithms. DFC has placed v5899e at second rank whereas is selected as second best term by chi-square. We explain this by observing the fact that is present more times in non-relevant documents as compared to v599e.
Likewise, other terms can also be observed from the table. Similarly, from Table 5 it can be seen that etidronate is ranked as the best term by both algorithms. DFC has selected alendronate as second best term and chi-square placed fetuin at second rank. Fetuin is present in only 4 documents of relevant class and 275 of non-relevant class documents. However, alendronate is present in 24 relevant documents and 123 non-relevant documents. By analyzing and comparing these parameters, it is pretty easy to see that alendronate is more suitable candidate than fetuin as it is present more times in relevant documents and also has lesser occurrence in non-relevant class.
Experimental setup and results
We use an open source search platform known as ‘Solr’ (39) for experimentation. It includes features of full text search and real time indexing. In experimentation, Okapi BM25 is used as retrieval model. In this section we briefly explain about experimental setup and compare the results of all term selection techniques against defined test points.
A. Results without stemming
To analyze the effect of pre-processing on biomedical data, we have used two different methods for indexing of the corpus documents as discussed in the Section 3. This section depicts the results of nine term selection algorithms in the form of tables at pre-defined test points. Expectedly, all feature selection techniques do not produce their peak results at the same defined set of parameters. These parameters are number of top retrieved relevant documents and candidate expansion terms that get merged with the query. For sake of laying out the clear picture of the performance of pseudo relevance feedback and better comparison of term ranking algorithms, we have shown a graph containing the peak results only against the best parameters of terms for all techniques found from below mentioned tables.
Tables 6–10 illustrate MAP of nine term selection algorithms on pre-defined benchmark test points at top terms (5, 10, 15, …, 50) and documents (10, 20, …, 50). Boldface values in these tables indicate the highest performance of a particular term selection algorithm across all the mentioned term selection algorithms at a specific number of terms.
Mean average precision of nine term selection algorithms by choosing digit 10 as threshold to divide ranked corpus documents as relevant and non-relevant
| No. of terms | FR metrics | ||||||||
|---|---|---|---|---|---|---|---|---|---|
| Chi-square | Chi | DFC | KLD | RSV | CoDice | IG | LRF | PRF | |
| 5 | 0.2661 | 0.2632 | 0.2748 | 0.2724 | 0.2713 | 0.2696 | 0.2712 | 0.2859 | 0.2661 |
| 10 | 0.2547 | 0.2649 | 0.2801 | 0.2665 | 0.2619 | 0.2777 | 0.2801 | 0.2884 | 0.2692 |
| 15 | 0.2506 | 0.2617 | 0.281 | 0.2539 | 0.2647 | 0.2821 | 0.2817 | 0.2839 | 0.2653 |
| 20 | 0.2569 | 0.2624 | 0.2815 | 0.2543 | 0.2493 | 0.272 | 0.2798 | 0.2842 | 0.2643 |
| 25 | 0.2619 | 0.2587 | 0.2814 | 0.258 | 0.2439 | 0.2726 | 0.279 | 0.279 | 0.2616 |
| 30 | 0.2593 | 0.259 | 0.28 | 0.2501 | 0.2456 | 0.2697 | 0.279 | 0.2746 | 0.2603 |
| 35 | 0.2627 | 0.2591 | 0.28 | 0.2488 | 0.2488 | 0.2675 | 0.2717 | 0.2701 | 0.2603 |
| 40 | 0.2596 | 0.255 | 0.278 | 0.2499 | 0.2466 | 0.2648 | 0.2678 | 0.2666 | 0.2577 |
| 45 | 0.2606 | 0.257 | 0.2764 | 0.2455 | 0.25 | 0.2647 | 0.2652 | 0.2644 | 0.2558 |
| 50 | 0.2595 | 0.2576 | 0.2765 | 0.2445 | 0.2426 | 0.2654 | 0.2596 | 0.2648 | 0.2565 |
Mean average precision of nine term selection algorithms by choosing digit 20 as threshold to categories ranked corpus documents as relevant and non-relevant
| No. of terms | FR metrics | ||||||||
|---|---|---|---|---|---|---|---|---|---|
| Chi-square | Chi | DFC | KLD | RSV | CoDice | IG | LRF | PRF | |
| 5 | 0.2574 | 0.2614 | 0.2859 | 0.2925 | 0.2824 | 0.2727 | 0.2700 | 0.2835 | 0.2624 |
| 10 | 0.2668 | 0.2519 | 0.2892 | 0.2754 | 0.2657 | 0.2777 | 0.2666 | 0.2787 | 0.2651 |
| 15 | 0.2660 | 0.2531 | 0.2878 | 0.2600 | 0.2553 | 0.2714 | 0.2674 | 0.2660 | 0.2637 |
| 20 | 0.2616 | 0.2515 | 0.2890 | 0.2556 | 0.2495 | 0.2672 | 0.2677 | 0.2605 | 0.2663 |
| 25 | 0.2656 | 0.2514 | 0.2892 | 0.2522 | 0.2441 | 0.2657 | 0.2663 | 0.2587 | 0.2643 |
| 30 | 0.2745 | 0.2504 | 0.2910 | 0.2443 | 0.2381 | 0.2667 | 0.2635 | 0.2554 | 0.2591 |
| 35 | 0.2642 | 0.2496 | 0.2887 | 0.2406 | 0.2375 | 0.2620 | 0.2608 | 0.2530 | 0.2619 |
| 40 | 0.2613 | 0.2482 | 0.2912 | 0.2391 | 0.2381 | 0.2598 | 0.2580 | 0.2495 | 0.2598 |
| 45 | 0.2630 | 0.2452 | 0.2891 | 0.2358 | 0.2380 | 0.2601 | 0.2598 | 0.2476 | 0.2577 |
| 50 | 0.2630 | 0.2460 | 0.2903 | 0.2343 | 0.2338 | 0.2586 | 0.2569 | 0.2441 | 0.2565 |
Mean average precision of nine term selection algorithms by choosing digit 30 as threshold to divide ranked corpus documents as relevant and non-relevant
| No. of terms | FR metrics | ||||||||
|---|---|---|---|---|---|---|---|---|---|
| Chi-square | Chi | DFC | KLD | RSV | CoDice | IG | LRF | PRF | |
| 5 | 0.2504 | 0.2372 | 0.2925 | 0.2954 | 0.2758 | 0.2748 | 0.2798 | 0.2856 | 0.2559 |
| 10 | 0.2617 | 0.2298 | 0.2951 | 0.2720 | 0.2569 | 0.2642 | 0.2674 | 0.2760 | 0.2527 |
| 15 | 0.2594 | 0.2294 | 0.2935 | 0.2657 | 0.2639 | 0.2591 | 0.2628 | 0.2580 | 0.2521 |
| 20 | 0.2574 | 0.2290 | 0.2885 | 0.2605 | 0.2544 | 0.2612 | 0.2586 | 0.2577 | 0.2523 |
| 25 | 0.2597 | 0.2299 | 0.2894 | 0.2554 | 0.2453 | 0.2644 | 0.2507 | 0.2570 | 0.2552 |
| 30 | 0.2619 | 0.2278 | 0.2851 | 0.2513 | 0.2402 | 0.2648 | 0.2502 | 0.2552 | 0.2531 |
| 35 | 0.2575 | 0.2280 | 0.2852 | 0.2507 | 0.2356 | 0.2628 | 0.2486 | 0.2499 | 0.2521 |
| 40 | 0.2531 | 0.2260 | 0.2828 | 0.2337 | 0.2300 | 0.2599 | 0.2470 | 0.2431 | 0.2490 |
Mean average precision of nine term selection algorithms by choosing digit 40 as threshold to categories ranked corpus documents as relevant and non-relevant
| No. of terms | FR metrics | ||||||||
|---|---|---|---|---|---|---|---|---|---|
| Chi-square | Chi | DFC | KLD | RSV | CoDice | IG | LRF | PRF | |
| 5 | 0.2480 | 0.2508 | 0.2897 | 0.2744 | 0.2674 | 0.2636 | 0.2699 | 0.2705 | 0.2523 |
| 10 | 0.2533 | 0.2369 | 0.2983 | 0.2702 | 0.2599 | 0.2597 | 0.2586 | 0.2595 | 0.2525 |
| 15 | 0.2616 | 0.2381 | 0.2983 | 0.2659 | 0.2578 | 0.2541 | 0.2514 | 0.2427 | 0.2533 |
| 20 | 0.2613 | 0.2293 | 0.2926 | 0.2611 | 0.2447 | 0.2503 | 0.2473 | 0.2281 | 0.2523 |
| 25 | 0.2624 | 0.2249 | 0.2862 | 0.2490 | 0.2381 | 0.2512 | 0.2417 | 0.2425 | 0.2503 |
| 30 | 0.2599 | 0.2262 | 0.2850 | 0.2392 | 0.2316 | 0.2543 | 0.2403 | 0.2339 | 0.2481 |
| 35 | 0.2588 | 0.2216 | 0.2880 | 0.2326 | 0.2318 | 0.2532 | 0.2404 | 0.2276 | 0.2415 |
| 40 | 0.2541 | 0.2190 | 0.2866 | 0.2362 | 0.2338 | 0.2538 | 0.2432 | 0.2223 | 0.2413 |
| 45 | 0.2518 | 0.2208 | 0.2844 | 0.2374 | 0.2330 | 0.2517 | 0.2423 | 0.2304 | 0.2389 |
| 50 | 0.2503 | 0.2195 | 0.2836 | 0.2365 | 0.2256 | 0.2499 | 0.2421 | 0.2284 | 0.2349 |
Mean average precision of nine term selection algorithms by choosing digit 50 as threshold to classified ranked corpus documents as relevant and non-relevant
| No. ofterms | FR metrics | ||||||||
|---|---|---|---|---|---|---|---|---|---|
| Chi-square | Chi | DFC | KLD | RSV | CoDice | IG | LRF | PRF | |
| 5 | 0.2491 | 0.2342 | 0.2926 | 0.2810 | 0.2630 | 0.2502 | 0.240 | 0.2479 | 0.2540 |
| 10 | 0.2423 | 0.233 | 0.2987 | 0.2575 | 0.2517 | 0.2489 | 0.2276 | 0.2485 | 0.2530 |
| 15 | 0.2629 | 0.2212 | 0.3015 | 0.2579 | 0.2539 | 0.2441 | 0.2366 | 0.2400 | 0.2572 |
| 20 | 0.2685 | 0.2197 | 0.2994 | 0.2561 | 0.2403 | 0.2464 | 0.2397 | 0.2204 | 0.2552 |
| 25 | 0.2633 | 0.2192 | 0.2904 | 0.2459 | 0.2354 | 0.2450 | 0.2338 | 0.2134 | 0.2553 |
| 30 | 0.2613 | 0.2153 | 0.2871 | 0.2394 | 0.2264 | 0.2413 | 0.2324 | 0.2140 | 0.2517 |
| 35 | 0.2581 | 0.2137 | 0.2898 | 0.2366 | 0.2303 | 0.2426 | 0.2365 | 0.2088 | 0.2477 |
| 40 | 0.2566 | 0.2145 | 0.2881 | 0.2342 | 0.2211 | 0.2418 | 0.2289 | 0.1998 | 0.2447 |
| 45 | 0.2521 | 0.2132 | 0.2875 | 0.2304 | 0.2235 | 0.2408 | 0.2353 | 0.1982 | 0.2428 |
| 50 | 0.2509 | 0.2116 | 0.2870 | 0.2272 | 0.2176 | 0.2414 | 0.2303 | 0.1998 | 0.2413 |
Table 6 highlights the best performing term selection algorithms over following defined set of test points (i.e. top documents =10, top terms =5, 10, 15, 20, 25, 30, 35, 40, 45, 50). It can be clearly seen that LRF outperforms the rest of term selection algorithms at following test points T = 5, 10, 15, 20. Likewise, DFC exhibits best performance in the remaining test points. RSV does not perform up to the mark as its performance kept decreasing gradually with the increase in number of terms. KLD follow the footsteps of RSV but it somehow manages to beat RSV in a race of being called as worst performing algorithm.
It has also been observed that the performance of chi (without square) and PRF show an overall decline in score with gradual increase in number of top selected terms. We can also observe from the table that the scores of CoDice and IG kept increasing until the term test point T = 15, and for the remaining test points, decrease in performance is observed. On the other hand, chi-square follows a mix sort of trend as its performance kept decreasing slightly on couple of test points at first and then all of a sudden start increasing but then it gradually decreases for remaining term test points.
Table 7 illustrates the performance of term selection algorithms for 20 number of documents and top terms T = 5, 10, 15, 20, 25, 30, 35, 40, 45, 50. As the table suggests, it is pretty obvious to say that KLD outperforms the rest of term selection algorithms only at following test point T = 5. Surprisingly, DFC exhibits best performance in all the remaining test points. In addition, RSV does not perform up to the mark again even with the increase of top documents, as its performance (32) kept decreasing gradually with the increase in number of terms. The performance of IG, LRF and chi (without square) follow a pattern in which they have highest MAP at term test point =10, whereas for the rest of the test points, gradually decreasing scores are observed. Chi-square based on probability shows a peculiar behavior as the performance first arbitrarily increases with gradual increase of top selected terms. This increase in performance is observed until T = 30 and after that the performance drops and an almost constant score is observed. As far as CoDice and PRF are concerned, no clear pattern is observed in their performance. Some test points cause a slight increase or decrease in performance while others keep the performance constant.
In Table 8, we have depicted the results of term selection algorithms obtained at document test point =30 and for all defined terms test points =5, 10, 15, 20, 25, 30, 35, 40, 45, 50. As the table suggests, it is pretty obvious to say that KLD outperforms the rest of term selection algorithms only at following test point T = 5. Surprisingly, DFC exhibits best performance in all the remaining test points. In addition, Chi (without square) is the worst performer and its performance kept decreasing gradually with the increase in number of terms. LRF and IG start with a very good score at T = 5 but with the increase in number of top selected terms, their performance also kept getting worst. On the other hand, PRF follows an almost constant trend as the difference between its best and worst score is only 0.011. The performance of term selection algorithms such as chi-square, RSV and CoDice follow a mixed pattern. As the number of top terms are increased, the results of mentioned term selection algorithm sometimes increase and all of a sudden decrease at the very next test point.
For top document =40 and 50, we have shown the best performance of nine term selection algorithms in Tables 9 and 10, respectively. As the table suggests, it is pretty clear that DFC exhibits best performance in all the test points. Table 9 depicts that the performance of KLD, RSV, CoDice, IG and PRF keep decreasing gradually with the increase in number of terms. It also marks that Chi (without square) is the worst performer as it shows the least score at T = 50.
However, algorithms such as LRF and chi-square follow no clear pattern as their score vary from one test point to another by either decreasing or increasing suddenly.
While studying the performance of term selection algorithms in Table 10, we observe that LRF depicts the worse performance and shows gradual decrease in performance with increasing number of terms. KLD, RSV, CoDice and PRF also follow a decreasing pattern as they mark their best performance only at T = 5 and eventually kept getting decrease until term test point 50. Conversely, we observe that algorithms such as chi-square and IG show an unpredictable behavior in their performance. The scores of chi-square first increase up to T = 15, and then decrease as number of terms approaches to 50. IG shows an even more abrupt behavior as the score keeps on increasing and decreasing at different term test points.
Figure 3 result summarizes the performance of nine term selection algorithms in terms of MAP against number of documents. Trends of all term selection algorithms (chi-square, KLD, RSV, CoDice, IG, LRF) along with newly proposed technique (DFC) and baseline are shown only at peak values retrieved from Tables 6–10. As the graph suggests, it is pretty easy to see that DFC and KLD have outperformed the rest but in a straight comparison, DFC is a clear winner. Although at start there is a clear difference between the performance of DFC and LRF, but eventually with the increase in number of documents, DFC performance has gradually improved and reached the highest value of 0.3. As a result, we conclude that LRF outperforms the rest of the algorithms between 10 to nearly 15 documents, whereas the performance of DFC is highest for almost next 5 documents. For around next 10 documents, KLD has shown a slightly better performance than DFC but after that DFC has emerged as the winner among all term selection algorithms.
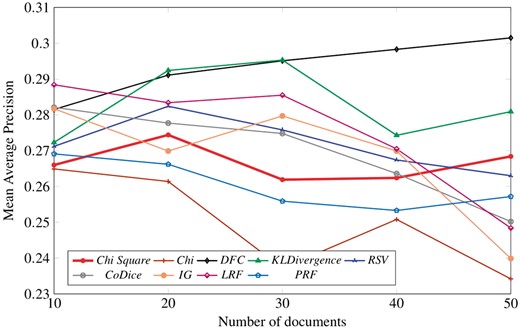
Peak results of nine term selection techniques.
B. Results with stemming
This section compares the performance of the nine term selection algorithms before and after stemming.
Mean average precision difference of nine term selection algorithms at 10 documents
| No. of terms | FR metrics | ||||||||
|---|---|---|---|---|---|---|---|---|---|
| ΔChi-square | ΔChi | ΔDFC | ΔKLD | ΔRSV | ΔCoDice | ΔIG | ΔLRF | ΔPRF | |
| 5 | 0.0805 | 0.1032 | 0.0897 | 0.0155 | 0.1091 | 0.0784 | 0.0460 | 0.0625 | 0.0526 |
| 10 | 0.0850 | 0.1206 | 0.1124 | 0.0044 | 0.1107 | 0.0830 | 0.0557 | 0.0639 | 0.0458 |
| 15 | 0.0906 | 0.1399 | 0.1222 | 0.0164 | 0.1278 | 0.0948 | 0.0507 | 0.0628 | 0.0781 |
| 20 | 0.0898 | 0.1427 | 0.1105 | 0.0174 | 0.1289 | 0.0930 | 0.0544 | 0.0596 | 0.0674 |
| 25 | 0.1069 | 0.1318 | 0.1242 | 0.0194 | 0.1340 | 0.0980 | 0.0511 | 0.0608 | 0.0781 |
| 30 | 0.0901 | 0.1312 | 0.1247 | 0.0105 | 0.1273 | 0.0947 | 0.0545 | 0.0582 | 0.0818 |
| 35 | 0.0807 | 0.1294 | 0.1206 | 0.0203 | 0.1319 | 0.1012 | 0.0582 | 0.0572 | 0.0755 |
| 40 | 0.0870 | 0.1246 | 0.1185 | 0.0111 | 0.1358 | 0.0958 | 0.0649 | 0.0622 | 0.0798 |
| 45 | 0.0883 | 0.1286 | 0.1257 | 0.0161 | 0.1394 | 0.1007 | 0.0660 | 0.0646 | 0.0810 |
| 50 | 0.0816 | 0.1301 | 0.1242 | 0.0200 | 0.1434 | 0.0995 | 0.0658 | 0.0613 | 0.0806 |
Mean average precision difference of nine term selection algorithms at 20 documents
| No. ofterms | FR metrics | ||||||||
|---|---|---|---|---|---|---|---|---|---|
| ΔChi-square | ΔChi | ΔDFC | ΔKLD | ΔRSV | ΔCoDice | ΔIG | ΔLRF | ΔPRF | |
| 5 | 0.0888 | 0.0832 | 0.0898 | 0.0367 | 0.1368 | 0.0679 | 0.0474 | 0.0510 | 0.0597 |
| 10 | 0.1042 | 0.1150 | 0.1050 | 0.0372 | 0.1529 | 0.0818 | 0.0607 | 0.0611 | 0.0820 |
| 15 | 0.1224 | 0.1356 | 0.1267 | 0.0372 | 0.1528 | 0.0871 | 0.0504 | 0.0713 | 0.0924 |
| 20 | 0.1267 | 0.1290 | 0.1369 | 0.0231 | 0.1438 | 0.0839 | 0.0555 | 0.0698 | 0.0864 |
| 25 | 0.1214 | 0.1321 | 0.1491 | 0.0236 | 0.1513 | 0.0813 | 0.0570 | 0.0713 | 0.0958 |
| 30 | 0.1259 | 0.1345 | 0.1545 | 0.0304 | 0.1429 | 0.0881 | 0.0644 | 0.0604 | 0.1046 |
| 35 | 0.1260 | 0.1353 | 0.1559 | 0.0268 | 0.1416 | 0.0891 | 0.0655 | 0.0591 | 0.1095 |
| 40 | 0.1217 | 0.1335 | 0.1621 | 0.0278 | 0.1400 | 0.0937 | 0.0656 | 0.0555 | 0.1077 |
| 45 | 0.1244 | 0.1315 | 0.1556 | 0.0309 | 0.1300 | 0.0930 | 0.0739 | 0.0551 | 0.1143 |
| 50 | 0.1218 | 0.1268 | 0.1609 | 0.0357 | 0.1220 | 0.0946 | 0.0775 | 0.0577 | 0.1165 |
Mean average precision difference of nine term selection algorithms at 30 documents
| No. ofterms | FR metrics | ||||||||
|---|---|---|---|---|---|---|---|---|---|
| ΔChi-square | ΔChi | ΔDFC | ΔKLD | ΔRSV | ΔCoDice | ΔIG | ΔLRF | ΔPRF | |
| 5 | 0.0836 | 0.1183 | 0.0955 | 0.0405 | 0.132 | 0.0623 | 0.0531 | 0.0469 | 0.0616 |
| 10 | 0.1206 | 0.1120 | 0.1070 | 0.0503 | 0.1678 | 0.0788 | 0.0542 | 0.055 | 0.0706 |
| 15 | 0.1263 | 0.1302 | 0.1226 | 0.0467 | 0.1711 | 0.0756 | 0.0510 | 0.0601 | 0.1002 |
| 20 | 0.1267 | 0.1460 | 0.1378 | 0.0502 | 0.1711 | 0.0818 | 0.0552 | 0.0672 | 0.1206 |
| 25 | 0.1227 | 0.1433 | 0.1460 | 0.0518 | 0.1666 | 0.0915 | 0.0513 | 0.0645 | 0.1300 |
| 30 | 0.1163 | 0.1320 | 0.1464 | 0.0326 | 0.1670 | 0.0995 | 0.0640 | 0.0628 | 0.1333 |
| 35 | 0.1239 | 0.1323 | 0.1449 | 0.0318 | 0.1630 | 0.1016 | 0.0629 | 0.0572 | 0.1327 |
| 40 | 0.1224 | 0.1359 | 0.1488 | 0.0315 | 0.1653 | 0.0965 | 0.0679 | 0.0582 | 0.1154 |
| 45 | 0.1279 | 0.1357 | 0.1527 | 0.0422 | 0.1647 | 0.0973 | 0.0770 | 0.0538 | 0.1182 |
| 50 | 0.1344 | 0.1382 | 0.1606 | 0.0390 | 0.1686 | 0.0998 | 0.0828 | 0.0596 | 0.1149 |
Mean average precision difference of nine term selection algorithms at 40 documents
| No. ofterms | FR metrics | ||||||||
|---|---|---|---|---|---|---|---|---|---|
| ΔChi-square | ΔChi | ΔDFC | ΔKLD | ΔRSV | ΔCoDice | ΔIG | ΔLRF | ΔPRF | |
| 5 | 0.0777 | 0.1074 | 0.1011 | 0.0496 | 0.1468 | 0.0696 | 0.0388 | 0.0436 | 0.0451 |
| 10 | 0.1042 | 0.1277 | 0.1329 | 0.0644 | 0.1648 | 0.0740 | 0.0412 | 0.0412 | 0.0761 |
| 15 | 0.1280 | 0.1167 | 0.1221 | 0.0444 | 0.1630 | 0.0738 | 0.0577 | 0.0452 | 0.1005 |
| 20 | 0.1146 | 0.1229 | 0.1321 | 0.0404 | 0.1616 | 0.0862 | 0.0578 | 0.0395 | 0.1260 |
| 25 | 0.1177 | 0.1261 | 0.1402 | 0.0354 | 0.1663 | 0.0883 | 0.0582 | 0.0384 | 0.1340 |
| 30 | 0.1241 | 0.1369 | 0.1504 | 0.0378 | 0.1586 | 0.0978 | 0.0551 | 0.0440 | 0.1362 |
| 35 | 0.1304 | 0.1396 | 0.1609 | 0.0390 | 0.1652 | 0.0958 | 0.0642 | 0.0374 | 0.1335 |
| 40 | 0.1201 | 0.1383 | 0.1610 | 0.0448 | 0.1718 | 0.0962 | 0.0658 | 0.0410 | 0.1376 |
| 45 | 0.1241 | 0.1385 | 0.1562 | 0.0479 | 0.1655 | 0.0983 | 0.0714 | 0.0474 | 0.1417 |
| 50 | 0.1238 | 0.1356 | 0.1613 | 0.0396 | 0.1648 | 0.0928 | 0.0630 | 0.0458 | 0.1430 |
Mean average precision difference of nine term selection algorithms at 50 documents
| No. ofterms | FR metrics | ||||||||
|---|---|---|---|---|---|---|---|---|---|
| ΔChi-square | ΔChi | ΔDFC | ΔKLD | ΔRSV | ΔCoDice | ΔIG | ΔLRF | ΔPRF | |
| 5 | 0.083 | 0.0956 | 0.0901 | 0.0443 | 0.1319 | 0.0462 | 0.0069 | 0.0120 | 0.0436 |
| 10 | 0.0952 | 0.1179 | 0.1178 | 0.0431 | 0.1563 | 0.0648 | 0.0281 | 0.0409 | 0.0707 |
| 15 | 0.1227 | 0.1249 | 0.1231 | 0.0444 | 0.1558 | 0.0567 | 0.0340 | 0.0383 | 0.0935 |
| 20 | 0.1236 | 0.1302 | 0.1295 | 0.0383 | 0.1519 | 0.0571 | 0.0389 | 0.0246 | 0.1138 |
| 25 | 0.1197 | 0.1274 | 0.1306 | 0.0475 | 0.1573 | 0.0666 | 0.0369 | 0.0252 | 0.1254 |
| 30 | 0.1150 | 0.1297 | 0.1446 | 0.0533 | 0.1614 | 0.0772 | 0.0383 | 0.0183 | 0.1271 |
| 35 | 0.1195 | 0.1288 | 0.1503 | 0.0330 | 0.1593 | 0.0717 | 0.0363 | 0.0205 | 0.1294 |
| 40 | 0.1197 | 0.1326 | 0.1511 | 0.0359 | 0.1665 | 0.0736 | 0.0390 | 0.0275 | 0.1340 |
| 45 | 0.1226 | 0.1239 | 0.1566 | 0.0309 | 0.1675 | 0.0752 | 0.0491 | 0.0221 | 0.1385 |
| 50 | 0.1187 | 0.1217 | 0.1576 | 0.0316 | 0.1655 | 0.0762 | 0.0491 | 0.0271 | 0.1381 |
From above equation, we can deduce that having a very large value of Delta implies that the algorithm is affected by stemming in a negative way i.e. its performance has decreased majorly after applying stemming. On the other hand, least value of delta shows the small difference effect of stemming on algorithm i.e. performance of algorithm before and after stemming is almost same.
Table 11 illustrates the performance difference of term selection algorithms for 10 number of documents and terms T = 5, 10, 15, 20, …, 50. We can clearly observe that the overall performance of KLD is least affected by stemming. Chi and RSV are badly affected by stemming and have revealed very bad performance after stemming the dataset.
Table 12 highlights the difference in the performance of term selection algorithms for document =20 and terms= 5, 10, 15, …, 50. Largest values of deltas are obtained by RSV and DFC which shows high effect of stemming on these two algorithms. Opposite results are obtained by KLD once again as it has shown resistance toward stemming and its behavior after stemming stayed the same as before.
In Table 13, we have depicted the Deltas of nine term selection algorithms for 30 number of documents and pre-defined term test points (T = 5, 10, …, 50). KLD once again has refused to change its results after stemming and its precision before stemming are almost identical as it depicts least values of deltas at all term test points. However, at test point T = 25, IG has a very small value of delta which is almost comparable to the delta value obtained by KLD at same test point. Term selection algorithm that is most affected by stemming is RSV as it has the largest difference in precision value for all term test points.
Now in Tables 14 and 15 we observe the results on the algorithms before and after applying stemming on data using 40 and 50 documents, respectively, and varying the top expansion terms from 5 to 50 with a gap of 5 terms as 5, 10, 15, …, 50. A thorough inspection of the results mentioned in both tables illustrate that the performance of RSV is once again most affected by stemming. The precision of RSV obtained after stemming is much lower than the precision without stemming. At Document test point D = 40, results obtained by IG, LRF and KLD after stemming are almost same as before stemming. While in Table 15, only the precisions and results of IG and LRF are badly affected by stemming.
In conclusion, we can say that stemming in biological domain decreases the overall performance of term selection algorithms. RSV is very much vulnerable to the effect of stemming as its performance decreases the most after applying it on stemmed dataset. However, KLD has shown the most resistance against stemmed dataset and its precision before and after stemming stays almost same.
Conclusion
We have proposed a new term selection algorithm named as ‘DFC’ for QE. DFC has been compared with other eight state-of-the-art term selection algorithms. Experiments show that DFC outperforms all other eight term selection algorithms in 88% of the pre-defined test points. DFC also caters the problem of document misclassification that occurs while setting the threshold of relevant and non-relevant class in pseudo relevance feedback. From Table 1 it can be concluded that chi-square has caused query drift for 25 of the total queries. On the other hand, DFC has shown an improvement in precision of 20 queries. To summarize the performance of all nine term selection algorithms, we have concluded that at defined set of document threshold (10, 20, 30, 40, 50), comparative performance of DFC is (60, 90, 90, 100, 100%). We also noticed that as the number of feedback document is increased, performance of DFC also increased while other term selection algorithms have marked an unexpected decrease. We would also like to mention that for PRF based information retrieval in biomedical domain, stemming tends to decrease the precision of all nine term selection algorithms.
Conflict of interest. None declared.
References
MetaMap a Tool For Recognizing UMLS Concepts in Text - Google Search. https://www.google.com/search? newwindow=1&safe=active&ei=lQrgWoziJ8TaUp_Kn9AO&q=MetaMap+a+Tool+For+Recognizing+UMLS+Concepts+in+Text&oq=MetaMap+a+Tool+For+Recognizing+UMLS+Concepts+in+Text&gs_l=psy-ab.3 (25 April 2018, date last accessed).
The Lemur Toolkit - Indri Query Language Quick Reference. http://lemurproject.org/lemur/IndriQueryLanguage.php (25 April 2018, date last accessed).
Text REtrieval Conference (TREC)
Apache Solr Lucene. http://lucene.apache.org/solr/ (4 April 2018, date last accessed).
Author notes
Citation details: Nabeel Asim,M., Wasim,M., Usman Ghani Khan,M. et al. Improved biomedical term selection in pseudo relevance feedback. Database (2018) Vol. 2018: article ID bay056; doi:10.1093/database/bay056
Present address: Muhammad Nabeel Asim, Al-Khawarzmi Institute of Computer Science, University of Engineering & Technology, GT Road, Lahore, Punjab, Pakistan.
