


Abstract
The Bacillus cereus group of bacteria includes species that are of significant medical and economic importance. We previously developed the SuperCAT database, which integrates data from all five multilocus sequence typing (MLST) schemes available to infer the genetic relatedness within this group. Since large numbers of isolates have been typed by other techniques, these should be incorporated in order to provide the most comprehensive and truly global view of the B. cereus group population. The SuperCAT system has been extended into a new database, HyperCAT, with two main additions. First, an extended supertree approach was applied to combine the phylogenetic information available from MLST, amplified fragment length polymorphism and multilocus enzyme electrophoresis. Secondly, a tree-independent clustering algorithm was designed to build superclusters of genetically closely related isolates sharing identical genotyping data. The superclusters were then mapped onto the supertree to generate an integrative genetic and phylogenetic snapshot of the B. cereus group population currently incorporating 2143 isolates. HyperCAT is freely accessible at the University of Oslo’s typing website, which has also been upgraded with TNT software, allowing improved and ultra-fast supertree reconstructions. In addition, novel and advanced tools have been included for interactive viewing and navigation of trees, clusters and networks.
Database URL:http://mlstoslo.uio.no/
Introduction
The Bacillus cereus group is a group of bacteria which includes species that are of significant economic and medical importance, such as B. anthracis, an obligate mammalian pathogen and the causative agent of anthrax, B. cereus, an opportunistic human pathogen causing diverse infections, and B. thuringiensis, an insect pathogen widely used as a biopesticide worldwide. The other member species are B. weihenstephanensis, B. mycoides and B. pseudomycoides. B. cereus group organisms are genetically very closely related at the genetic and genomic levels (1–4).
Due to the importance of B. cereus group bacteria, the population structure and phylogenetic relationships of the isolates within the group have been extensively studied using diverse typing methods, in order to follow the evolution of strains or identify clones responsible for disease outbreaks. Large-scale analyses have been conducted using multilocus enzyme electrophoresis [MLEE; (1,5–7)], which is based on electrophoretic mobility of 10–20 proteins, fluorescent amplified fragment length polymorphism analysis [AFLP; (8–10)], which surveys the genome for length and sequence polymorphisms using restriction enzyme fragmentation and PCR, and more recently multilocus sequence typing [MLST; (4,11–17)], which compares the sequences of PCR-amplified DNA products internal to six or seven housekeeping genes. The separate typing studies have independently revealed that the B. cereus group population is divided into multiple phylogenetic clusters, in which the members of each species, with the exception of the highly clonal B. anthracis, are frequently intermixed.
MLST has become the ‘gold standard’ for bacterial phylogeny, as it is unambiguous and truly electronically portable among laboratories (18,19). However, unlike other bacterial species, which are most often typed using a single MLST scheme, five separate schemes have been developed for the B. cereus group, based on different sets of genes. Therefore, we recently developed the SuperCAT database, which compiles and integrates MLST data from all the published B. cereus group schemes into a single resource (20), as well as provides tools for building a combined phylogenetic tree of the B. cereus group population using supertree techniques (available at the University of Oslo’s typing website: http://mlstoslo.uio.no/). While MLST data is currently available for 1430 B. cereus group isolates, an additional 832 isolates have been typed by either AFLP or MLEE. In order to provide the most comprehensive and truly global view of the B. cereus group population, the supertree approach employed in SuperCAT was extended to incorporate AFLP and MLEE data. In addition to phylogenetic supertrees, a clustering algorithm was developed to identify groups of genetically related isolates that share common MLST and/or AFLP profiles. The data and analysis tools are available in HyperCAT, an extension of the SuperCAT database, which provides the B. cereus group research community with an integrated on-line genotyping resource. We describe below the main additions and features in HyperCAT as well as the procedures for building multi-datatype supertrees and superclusters.
Multi-dataype supertree reconstruction
Integration of MLST, AFLP and MLEE-based phylogenetic information into a common supertree was possible by taking advantage of the matrix representation by parsimony (MRP) technique (20–22), which consists in merging trees that can be built individually from heterogeneous data. The procedure is similar to that used to build the multi-scheme MLST supertree in SuperCAT. Three trees generated from the comparisons of AFLP profiles were taken from the studies of ref. (8) (166 isolates), ref. (9) (332 isolates) and ref. (10) (425 isolates), and a phylogeny based on MLEE profiles of 316 B. cereus group isolates was from ref. (1) (239 isolates) and E. Helgason (unpublished) (77 isolates). These were combined with the phylogenetic trees built for each of the 26 gene fragments from the five MLST schemes used to reconstruct the MLST supertree in SuperCAT (20) (1400 isolates). In the combined ‘MLST+AFLP+MLEE’ dataset a total of 2262 isolates were represented, of which 49 were excluded from further analysis because of conflicting data. Isolates were excluded because they exhibited incongruent phylogenetic positions in the various trees (i.e. were located in different clusters of the B. cereus group population depending on the typing method used) or because the typing sequences or profiles obtained from different collections or databases were inconsistent. A global multi-datatype supertree was then reconstructed by means of the MRP technique (Figure 1), which first consists in recoding each individual tree into a binary matrix representing the branching order (i.e. phylogenetic groupings) among the strains. The matrices for all trees are then concatenated into a supermatrix from which a common supertree can be inferred by a maximum parsimony algorithm. For this step the ‘Tree analysis using New Technology’ (TNT) software [(23,24), http://www.zmuc.dk/public/phylogeny/TNT/] was used. TNT is specifically designed for analysis of large datasets and permits ultra-fast supertree building. The speed and algorithms implemented in TNT enable a broader and more efficient exploration of the tree space, thereby allowing the program to find more parsimonious trees, compared to common softwares such as PAUP and PHYLIP (25). Here, TNT was run using the ‘xmult’ command (all default options, except a search level of 10), which automatically determines the search parameters for the given dataset and runs a combination of several tree rearrangement algorithms (sectorial searches, tree-drifting and tree-fusing). Such combined search strategies have been found to be most appropriate for large datasets [for details, see ref. (25)]. The final supertree was taken as the strict consensus of all equally most parsimonious trees. Because MLST, AFLP and MLEE are based on different amounts of genetic information, the supertree procedure was weighted. In the AFLP studies of refs (8,9), genetic profiles were based on 40 genomic fragments, which can be considered as 40 genomic loci, while the AFLP study of ref. (10) was based on 68 loci, and each MLST gene represents one locus. The actual number of characters analyzed by each typing method is very different; while AFLP relies on restriction sites of 4 or 6 bp, a given MLST locus includes 300–600 bp. The MRP supertree technique combines trees, not the raw data used to build them. Each AFLP tree was based on the combination of 40 or 68 loci, whereas a particular MLST gene tree gives the relationships among isolates at one locus. Therefore a weighting scheme based on the number of loci examined by each method was employed. That is, the groupings coming from the AFLP trees and from each of the 26 MLST gene trees in the MRP supermatrix were given a weight of 40 [or 68 for the tree of ref. (10)] and 1, respectively, for the parsimony search (since 26 gene fragments were used, MLST was thus represented by a total weight of 26). The MLEE study relied on 13 enzyme loci, and to take into account the fact that MLEE is based on proteins, the weight of the MLEE tree was set to 4 (i.e. 13/3). Weighting was applied using the ‘ccode’ command in TNT. To reduce the size of the binary supermatrix and the amount of missing data to be treated, as well as to speed up computations, the weighted supertree was built using only one representative (chosen at random) from a set of strains having identical typing profiles and was computed in about seven hours (using a single processor on a Linux Apache web server). To obtain statistical support values for all groupings (i.e. internal branches) in the supertree the maximum likelihood method was employed. Approximate likelihood-ratio tests (aLRTs) for branches were computed using PHYML 3.0 with Shimodaira-Hasegawa-like support values (26–29; http://atgc.lirmm.fr/phyml/). aLRTs provide a fast way of testing branch support and consist in comparing, for a given branch, the likelihoods of the best tree containing the branch (i.e. the current supertree) and the best tree not containing the branch (keeping the rest of the topology identical). If the difference in likelihood is statistically significant, then the branch is supported. For each branch the probability (or P-value) of being significant is estimated [for details, see refs (27,29–31)]. PHYML was run on the MRP supermatrix using a custom substitution model representing binary data and the topology of the supertree obtained by TNT, allowing the branch supports to be computed in ∼4 h. The procedure described above was also applied to reconstruct a supertree using the data from the DNA-based typing methods only (MLST and AFLP, 2143 isolates). The ‘MLST+AFLP’ supertree is used as the reference supertree in the HyperCAT database. It contains ∼97% of the strains included in the database and is more reliable than the ‘MLST+AFLP+MLEE’ supertree because MLEE, which is based on protein profiles, has a much lower resolution power than MLST and AFLP. This is due to the fact that the DNA-based methods take every nucleotide difference into account, including those that are silent at the protein level, and also that differences in protein sequences may not necessarily result in visible differences in electrophoretic mobility. Thus, MLEE does not clearly differentiate some of the major phylogenetic clusters in the B. cereus group population (1,5,6). The ‘MLST+AFLP+MLEE’ supertree is merely provided as a tool for exploring the phylogenetic positions of the 70 isolates that have been typed only by MLEE and which are thus not included in the reference ‘MLST+AFLP’ supertree.
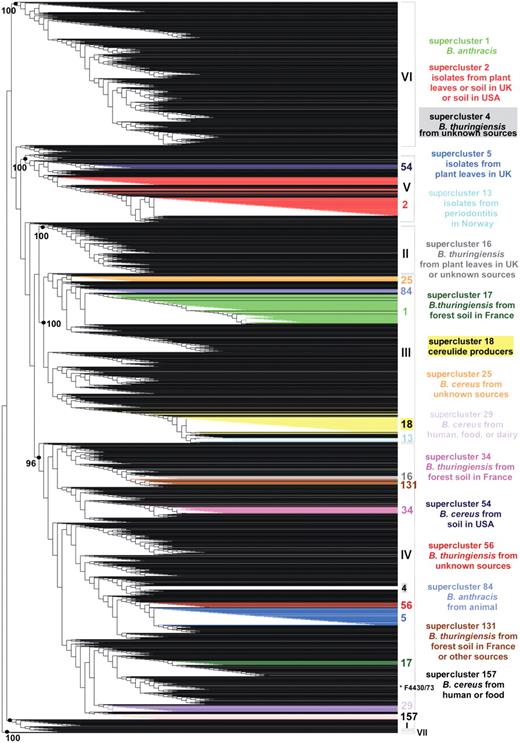
Weighted supertree of 2143 B. cereus group isolates based on phylogenetic information from five MLST schemes and three AFLP studies available in HyperCAT. The supertree was inferred following the MRP strategy, with a weight of 40 or 68 given to the AFLP studies and a weight of 1 given to each of 26 MLST genes. For the sake of legibility, isolate names are not shown. The seven major phylogenetic subdivisions of the B. cereus group defined by ref. (10) are designated by roman numerals (I–VII) and their branch support values (based on aLRT probabilities) are indicated when >95%. Superclusters of genetically closely related isolates (sharing identical MLST or AFLP profiles) that have been computed independently using a recursive approach and that contain 10 or more isolates have been mapped onto the supertree and are listed on the right (the supercluster descriptions apply to most isolates of the superclusters, not necessarily all). Isolates belonging to a given supercluster are drawn in the same color. As can be seen, isolates from the same supercluster are closely related in the tree. One exception is indicated by an asterisk and corresponds to strain B. cereus F4430/73 of supercluster 157. The image was generated using TreeDyn (44).
Even though more than 2200 B. cereus group isolates have been typed by either MLST, AFLP, or MLEE, there is very little overlap between the data sets investigated by the various methods. A total of 98 strains are common to MLST and AFLP datasets, and 34 strains have been characterized by all three methods. Nevertheless, the ‘MLST+AFLP’ and ‘MLST+AFLP+MLEE’ supertrees contained the major clusters of the B. cereus group population. For example, mapping onto the supertrees the seven clusters (denoted I–VII) identified in the AFLP analysis of ref. (10) confirmed that the overall phylogenetic structure of the AFLP analysis was retained when combined with phylogenetic information arising from MLST and MLEE data, as isolates from a given AFLP cluster are all contained within a common subtree in the supertree and the grouping is supported by a high statistical value (aLRT probability > 0.95) (Supplementary Figure S1). A similar result was obtained when mapping the 10 phylogenetic branches (denoted A–K) defined in the AFLP analysis of ref. (9) (Supplementary Figure S2). Conversely, mapping the lineages defined in the MLST study of ref. (11) indicated that the phylogenetic signal coming from MLST data was conserved when combined with that coming from AFLP and MLEE, even though MLST was given a lower weight in the supertree reconstruction (Supplementary Figure S3). The integration of multiple types of phylogenetic data demonstrated that even though there is little overlap between the isolate sets analyzed by the various typing methods, the supertrees obtained in the integrated analyses appeared to properly reconstruct the major groupings in the population and to be robust to missing data, a behavior that has been observed in numerous cases and for various datasets in earlier studies (32–34). Overall, a large proportion of the branches (∼70%) in the supertrees have strong statistical support (aLRT confidence level >95%). The impact of missing data was further tested by including in the supertree four replicates of the 34 strains for which MLST, AFLP and MLEE data are available, using either all data or data from one of the three typing methods. For all 34 strains, the four replicates were always located in the same phylogenetic cluster and mostly in the same subtree (i.e. for 28 of the 34 strains the replicates were separated by less than a dozen internal nodes), indicating that missing data did not bias the general positioning of the strains (Supplementary Figure S4). Precise within-clusters branchings may however contain more uncertainty, thus the multi-datatype supertrees should be used primarily as a common framework to explore global relationships among strains.
Multi-datatype supercluster reconstruction
To complement the supertree approach, a tree-independent clustering procedure was applied in order to group isolates that share identical typing data. The procedure is analogous to that of computing clonal complexes of strains as is typically done with MLST data (35,36), but with the objective of using information from the multiple B. cereus group MLST schemes as well as results from the multiple AFLP studies. For reasons explained in the previous section the ‘MLST+AFLP’ dataset is used as the reference dataset in HyperCAT, and thus MLEE profiles were not included in the supercluster analysis. An algorithm was designed to identify groups of isolates that share identical MLST and/or AFLP profiles (Figure 2). For MLST, strains were defined as sharing an identical profile if they shared identical sequences at all loci of a given MLST scheme [i.e. belong to the same sequence type (ST) using six or seven loci, depending on the scheme]. The grouping was done in a recursive manner. That is, if strain A had a profile identical to strain B based on typing method 1, and was identical to strain C based on method 2, then strains A, B and C were grouped. All strains sharing a profile with B and all strains sharing a profile with C in any of the two DNA-only typing methods were subsequently added to the supercluster, then all strains identical to the latter strains were added, and so on until no further isolate sharing an identical MLST and/or AFLP profile with the strains currently in the group could be found. As a result of this procedure, every isolate of a given supercluster shares identical genotyping data by at least one typing method to at least one other isolate in the group (Figure 2A). Note also that all superclusters that were built by this procedure are mutually exclusive, i.e. a given isolate belongs to one and only one group. Isolates that do not share typing profiles with any other isolate in the database were classified as singletons. In this analysis, no weighting scheme was applied, as strains were simply treated as ‘identical’ or ‘non-identical’ to each other. A total of 283 superclusters were identified, comprising a total of 1152 isolates, while the remaining 991 isolates were singletons. Because of little overlap between the isolate sets analyzed by the different typing schemes, ∼90% of the superclusters were composed only of isolates that have been typed by the same method or scheme, and most of the clusters (∼85%) were small (less than five isolates). Due to the clustering procedure all strains in a given supercluster may not be identical in any one marker. However, they are likely to be closely related. This was confirmed by mapping the 16 superclusters containing 10 isolates or more onto the ‘MLST+AFLP’ supertree, showing that, with a single exception among 431 isolates (B. cereus F4430/73 in supercluster 157), isolates belonging to a given supercluster branched in the same subtree or nearby parts of the supertree (Figure 1). The exception could be explained by the fact that B. cereus F4430/73 has been typed by more methods than the other members of supercluster 157, creating a bias in the analysis due to variable amounts of data.
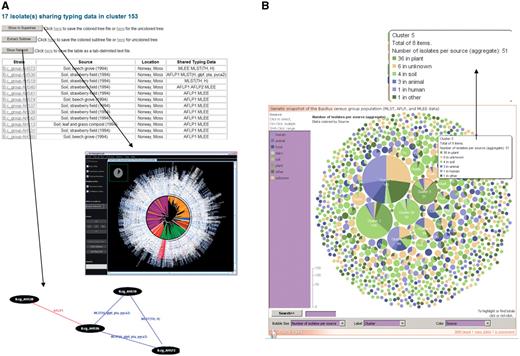
Exploration of superclusters of genetically closely related B. cereus group isolates in HyperCAT. (A) Tabular view of the superclusters. Each cluster is reported in a table, listing detailed information about the isolates and the genotying profiles shared. In addition, pressing one of the three buttons above the table allows to view the phylogenetic positions of the isolates in the multi-datatype supertree using Archaeopteryx, to extract from the supertree the subtree containing only the isolates forming the supercluster, or to display a network graph showing the specific typing data shared between the isolates of the supercluster. In the latter network, isolates having identical MLST and/or AFLP profiles are connected by blue and red lines, respectively. Every isolate in the supercluster shares a profile with at least one other isolate. The network can be browsed interactively using the ZGRViewer. (B) Graphical overview of all the superclusters resulting from typing information from five MLST schemes and three AFLP studies. Superclusters were built using a recursive approach, grouping strains that shared identical sequences at all loci of at least one of the MLST schemes and/or have identical AFLP profiles. The complete distribution consists of 283 groups totaling 1152 isolates, and 991 singletons. The set of superclusters and singletons can be navigated using an interactive bubble chart generated by means of the IBM/alphaWorks ‘many eyes’ system. Each supercluster is represented by a pie proportional to the number of isolates in the supercluster and the pie is divided according to the species or sources of the isolates included in the supercluster. Selecting or mousing over a supercluster brings up a window giving information about its content (shown in the inset indicated by an arrow).
HyperCAT database features and manipulation
HyperCAT currently contains 2262 isolates covering the diversity of the B. cereus group, including 110 B. anthracis, 841 B. cereus, 511 B. thuringiensis, 54 B. weihenstephanensis, 115 B. mycoides, 8 B. pseudomycoides and 623 unclassified B. cereus group isolates. In HyperCAT isolates can be selected according to various criteria such as name, source, keyword, typing method, or phylogenetic cluster [using the classification defined by ref. (10)]. The database provides all the genotypes that are represented for each typing scheme or method and for combinations of typing methods, with tables listing the sets of isolates that have unique or identical genotyping profiles. The profiles correspond to the STs, AFLP types (ATs) and electrophoretic types (ETs) for MLST, AFLP and MLEE, respectively. Also, the phylogenetic position of isolates having a particular profile can be highlighted in the ‘MLST+AFLP’ or ‘MLST+AFLP+MLEE’ supertree.
The supertrees can be browsed interactively by means of the Java-based Archaeopteryx (http://www.phylosoft.org/archaeopteryx/) and Treebolic2 (http://treebolic.sourceforge.net/) viewing applications. Archaeopteryx has superceded the ATV tool (37) previously used in SuperCAT. In particular, Archaeopteryx includes mouse-driven navigation and can render trees in various styles, e.g. rectangular, circular or unrooted. Supertrees can be colored by species or by source of isolate, and subtrees corresponding to selected subsets of strains can be highlighted and extracted. Since supertrees contain only one representative from a set of strains having an identical genotype, the representative strain is labeled ‘Superprofile_X (Y strains)’ where X is the genotype ID number and Y is the number of strains sharing that genotype. Clicking on that label will then load the corresponding table listing all isolates having that genotyping profile using the ‘Open Taxonomy Web’ function in Archaeopteryx. Clicking on a singleton isolate will link to the strain-specific information page. In addition to Archaeopteryx supertrees can be navigated using Treebolic which renders trees in 2D hyperbolic space. While the region under focus is displayed in detail, the rest of the tree is shown in a smaller size and the entire tree remains visible at all times. In both Archaeopteryx and Treebolic views, branches of the supertrees are colored according to the seven main phylogenetic clusters of the B. cereus group population defined by ref. (10), which gives a global overview of the phylogenetic classification of the strains. A given isolate was assigned to a particular cluster if it was part of that cluster in the MLST-only, MLST+AFLP and MLST+AFLP+MLEE supertrees. In total, 2144 of 2213 isolates could be consistently classified, demonstrating the congruence between the supertrees. HyperCAT also provides a number of options for navigating and comparing the scheme-specific MLST-only supertrees (taken from SuperCAT), the AFLP-only trees, the MLEE phylogeny and the multi-datatype supertrees, for the user who wishes to explore the method-specific trees and/or judge their congruence with the multi-datatype trees. Specific pages give information on the strains exhibiting conflicting typing data and allow to analyze their phylogenetic positions.
The superclusters of isolates sharing identical MLST and/or AFLP profiles can be explored using tabular and graphical displays. Tables list the detailed composition of the superclusters, and functions allow to view the phylogenetic position of the isolates in the ‘MLST+AFLP’ supertree and to extract the subtree containing the isolates belonging to a given supercluster. A graphical representation of the supercluster is also provided in the form of a network showing the specific MLST and AFLP profiles that are shared between the isolates (Figure 2 A). The network is drawn in scalable vector graphics (SVG) format using the ‘neato’ program of the AT&T Graphviz package [(38,39); http://www.graphviz.org/] and can be navigated using the Java-based ZGRViewer [see below; (40); http://zvtm.sourceforge.net/zgrviewer.html]. In addition, a graphical overview of all the superclusters is given by an interactive bubble chart, in which each cluster or singleton is represented by a pie whose size is proportional to the number of isolates in the cluster (Figure 2B). Superclusters can be colored according to bacterial species or isolate origin, and sets of clusters containing isolates from a given species or source can be jointly highlighted. The interactive charts were generated using the IBM/alphaWorks ‘many eyes’ data visualization system (http://manyeyes.alphaworks.ibm.com/manyeyes/). HyperCAT also offers the possibility to retrieve isolates that share identical MLST, AFLP and/or MLEE profiles based on user-selected subsets of isolates and typing methods, and to build superclusters following the recursive procedure described in this article.
As a further addition to HyperCAT, the superclusters have been mapped onto the ‘MLST+AFLP’ supertree in order to produce a combined and integrative genetic and phylogenetic overview (‘snapshot’) of the B. cereus group population (Figure 3). To generate this view, the isolates belonging to a supercluster have been replaced in the supertree by a randomly chosen isolate selected to represent the supercluster, and the phylogenetic position of the supercluster is given by that isolate. The supercluster is labeled ‘Supercluster_X (Y strains)’ where X is the cluster ID number and Y is the number of strains included in that supercluster. This representation allows to see in a single graph the phylogenetic distribution of the superclusters and singleton isolates. The snapshot has been drawn as an unrooted network in SVG format using ‘neato’ and can be browsed in ZGRViewer. ZGRViewer (40) is an advanced graph visualization software based on the Zoomable Visual Transformation Machine (ZVTM) particularly suitable for large networks. The interactive snapshot contains hyperlinks; middle-button clicking on a supercluster or isolate name will link to an information page with details about that cluster or isolate, and clicking on an internal node will load a new page displaying the subtree including all descendants of that node in the supertree (Figure 3). The isolates can be colored by species or source.
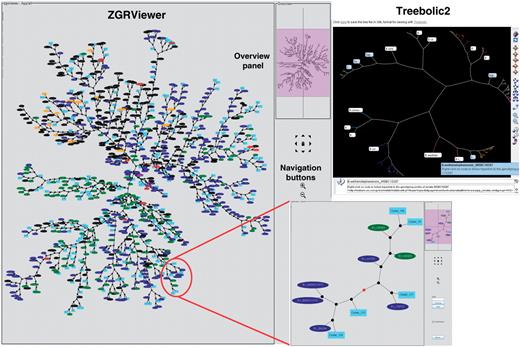
Phylogenetic snapshot of the B. cereus group population based on MLST and AFLP typing data for 2143 isolates. The snapshot combines supertree and supercluster information. The supertree is represented as an unrooted network in which the closely related strains belonging to a supercluster have been replaced by a representative isolate. Superclusters are drawn as filled lightblue boxes, while singleton isolates are drawn as ellipses colored by bacterial species (red, B. anthracis; blue, B. cereus; green, B. thuringiensis; brown, B. mycoides; purple, B. pseudomycoides; orange, B. weihenstephanensis; black, uncharacterized B. cereus group isolate). The network can be browsed interactively using the ZGRViewer navigation buttons and mouse functions. Clicking on an internal node loads a new page displaying the subtree including all descendants of that node in the supertree. An example is given in the inset showing the subtree circled in red. The view in the upper right corner shows the display of the supertree in hyperbolic space using Treebolic2.
In addition to the phylogenetic analysis tools described above, HyperCAT also contains a number of pages presenting various statistics relating to strain distribution, data content and overlap, as well as descriptions of the supertree and supercluster building procedures. HyperCAT provides hyperlinks to the Integrated Microbial Database, StrainInfo [http://www.straininfo.net/; (41)], for additional isolate information and links to database collections. All data in HyperCAT, including tabular isolate and genotype listings, superclusters, supertrees and networks, can be saved and downloaded freely from the database. In particular, trees can be obtained in the recently developed XML and PhyloXML standards (42).
Update of the SuperCAT database
As MLST is currently the gold standard for bacterial typing, the SuperCAT database devoted to multi-scheme MLST analysis of the B. cereus group, containing 1430 isolates, has been upgraded accordingly. The superclustering tool and associated graphical and tabular displays developed for HyperCAT have been incorporated into SuperCAT for analysis of MLST data only, for identifying groups of isolates sharing identical MLST profiles in any of the five schemes available. An MLST-based genetic and phylogenetic population snapshot combining supertree and supercluster information has also been generated. Furthermore, for the reconstruction of the multi-scheme MLST supertree by the MRP procedure, the parsimony step, which was originally carried out using the MIX program of the PHYLIP package (43), is now computed using TNT (23,24). For reasons explained earlier, TNT showed an improved accuracy over MIX and the use of TNT reduces the computation time from two days to about four hours with the full dataset. Finally, the ATV tree navigation tool has been replaced by its successor, Archaeopteryx (37) and the hyperbolic viewer Treebolic2 has been implemented.
Conclusion
In order to serve the B. cereus group research community with the most comprehensive genotyping resource, we have developed at the University of Oslo’s typing website (http://mlstoslo.uio.no/) a new database, HyperCAT. This database incorporates analysis tools combining genotyping data not only from multiple MLST schemes, as provided in the SuperCAT database, but also from the altogether different approaches AFLP and MLEE. While genotyping of the B. cereus group of bacteria is currently essentially done using MLST, HyperCAT provides a means to combine MLST data with the phylogenetic information from hundreds of strains that have been typed using other methods, and therefore generates a truly global genetic snapshot of the B. cereus group population with moderate to high representativity of all member species. The multi-datatype supertrees and superclusters developed herein provide a common basis for revealing and displaying genotypic relationships among B. cereus group isolates, based on the large amounts of heterogeneous typing data available for this group of bacteria, an effort which would not be straightforward by mere inspection and comparison of results from the two dozens of publications describing MLST, MLEE and AFLP analyses of the B. cereus group population.
Funding
This work was supported by grants from The Norwegian Research Council through a Strategic University Program (SUP), the Norwegian Functional Genomics program (FUGE II channel 3 grant), and the Consortium for Advanced Microbial Sciences and Technologies (FUGE-CAMST). Funding for open access charge: Norwegian Functional Genomics (FUGE II) platform of the Research Council of Norway and the University of Oslo.
Conflict of interest. None declared.
Acknowledgements
We would like to thank two anonymous referees for helpful suggestions regarding supertree analysis and database content. We thank Marie–Hélène Guinebretière, INRA–University of Avignon, France, for kindly providing isolate information and the AFLP-based phylogenetic tree. We thank George Magklaras, The Biotechnology Center of Oslo and The Norwegian EMBnet node, University of Oslo, for technical assistance and maintenance of the web server facilities. We also thank the Research Computing Services group at the University of Oslo for providing access to the Titan high-performance computing cluster (http://www.hpc.uio.no).
