


Abstract
The Brassica database (BRAD) was built initially to assist users apply Brassica rapa and Arabidopsis thaliana genomic data efficiently to their research. However, many Brassicaceae genomes have been sequenced and released after its construction. These genomes are rich resources for comparative genomics, gene annotation and functional evolutionary studies of Brassica crops. Therefore, we have updated BRAD to version 2.0 (V2.0). In BRAD V2.0, 11 more Brassicaceae genomes have been integrated into the database, namely those of Arabidopsis lyrata , Aethionema arabicum , Brassica oleracea , Brassica napus , Camelina sativa , Capsella rubella , Leavenworthia alabamica , Sisymbrium irio and three extremophiles Schrenkiella parvula , Thellungiella halophila and Thellungiella salsuginea . BRAD V2.0 provides plots of syntenic genomic fragments between pairs of Brassicaceae species, from the level of chromosomes to genomic blocks. The Generic Synteny Browser (GBrowse_syn), a module of the Genome Browser (GBrowse), is used to show syntenic relationships between multiple genomes. Search functions for retrieving syntenic and non-syntenic orthologs, as well as their annotation and sequences are also provided. Furthermore, genome and annotation information have been imported into GBrowse so that all functional elements can be visualized in one frame. We plan to continually update BRAD by integrating more Brassicaceae genomes into the database.
Database URL:http://brassicadb.org/brad/
Introduction
Brassicaceae is a large eudicot family that includes the model plant Arabidopsis thaliana . The Brassicaceae family has a remarkable diversity of species, genetics and morphotypes, as well as scientific and economic importance. Brassicaceae species have become model systems for studies of polyploidy and evolution ( 1 ). The important genus Brassica of Brassicaceae contains many vegetable, condiment and oil species that account for about 12% of the world’s edible vegetable oil production ( http://faostat.fao.org/ ). U’s triangle theory ( 2 ) has been applied to describe the relationships among six widely cultivated Brassica species, the diploids Brassica rapa (AA), B. nigra (BB) and B. oleracea (CC) and their allotetraploids B. juncea (AABB), B. napus (AACC) and B. carinata (BBCC). Of these, the B. rapa genome was the first to be sequenced in 2011 ( 3 ) and the original Brassica database was built based on it ( 4 ).
BRAD version 1.0 (V1.0) provides B. rapa genome sequences and gene models, as well as all the syntenic and non-syntenic homologous gene pairs between B. rapa and A. thaliana . On all its pages, BRAD V1.0 incorporates a useful navigation dialog-window that provides links to every B. rapa and A. thaliana gene ID. The small navigation window directs users by integrating relevant resource links of the target gene. With the rapid development of next-generation sequencing technology and the dramatic decrease in cost, many Brassicaceae species have been sequenced or were planned to be sequenced after BRAD V1.0 was constructed. Recently, the genomes of B. rapa sister species, B. oleracea and B. napus , have been sequenced ( 5 , 6 ) and nine other Brassicaceae species have also been sequenced ( 7–13 ). These 13 Brassicaceae genome datasets are a valuable resource for genome and gene studies among the closely related Brassicaceae species.
To help researchers and breeders use these recently released Brassicaceae genome sequences efficiently in scientific investigations and breeding applications, we have updated BRAD to version 2.0 (V2.0). BRAD V2.0 contains updated datasets and functions that include all syntenic gene pairs between A. thaliana and the other Brassicaceae species, more genome and gene sequences and gene annotations, as well as syntenic figures and genome visualization of all the incorporated Brassicaceae species in the Genome Browser (GBrowse) ( 14 ). BRAD V2.0 provides a comprehensive framework for comparative genomic analysis and studies of the evolution of gene function across Brassicaceae species, especially for the Brassica crops.
BRAD V2.0: feature updates
Overview of BRAD V2.0
In BRAD V1.0, datasets of genome and gene sequences, gene annotations, non-coding RNAs, transposable elements, genetic markers and linkage maps of B. rapa were provided ( 15 , 16 ). A navigation dialog-window for every gene of B. rapa and A. thaliana was provided to help users obtain all related information. Furthermore, BLAST and GBrowse tools ( 16 ) were embedded in BRAD for sequence alignment and for visualizing genomic elements, respectively.
BRAD V1.0 has now been updated to V2.0 to include Brassicaceae genome sequences that have been released recently. In BRAD V2.0, a new section has been incorporated that shows genomic synteny and micro-fragmental synteny between any two Brassicaceae species. An alternative pairwise synteny plotting tool, the Generic Synteny Browser (GBrowse_syn) module ( 17 ) of GBrowse, has been included to visualize local synteny relationships among multiple genomes. Moreover, genome and gene sequences, gene annotations and syntenic and non-syntenic orthologs between A. thaliana and other Brassicaceae species have been integrated into different sections of BRAD V2.0.
Technical details
All genomic data were processed using the tool SynOrths tool ( 15 ) to generate genome and gene level synteny datasets. Then, syntenic figures were generated based on these synteny datasets and stored in a MySQL ( 18 ) database.
Genome sequences, gene models and the processed datasets, including all syntenic genes, gene annotation information and specific gene families were all imported into MySQL, which enables multifaceted browsing and searching in BRAD. Furthermore, a standalone BLAST ( 19 ) service implemented in BRAD allows sequence searches against Brassicaceae genomes, protein-coding gene sequences and protein sequences. The GBrowse package, which is commonly used to visualize genomic datasets, remains in BRAD V2.0 to view bulk genomic elements of the Brassicaceae species. Furthermore, the syntenic datasets are provided not only as tabular results and pairwise-genome synteny images in the keyword search section, but also are visualized as a multiple genome synteny comparison in the GBrowse module GBrowse_syn.
BRAD stocks: Brassicaceae genomes
Statistics of the Brassicaceae genomic data, including genome sequences, predicted gene models, protein-coding gene sequences and protein sequences are shown in Table 1 . In total, about 4 Gb of data have been collected in BRAD V2.0. In addition to the original genome sequences and gene models, seven types of annotation for the predicted genes have been generated. The annotations have been sourced from the Swiss-Prot, TrEMBL ( 20 ), KEGG (Kyoto Encyclopedia of Genes and Genomes) ( 21 ), InterPro ( 22 ) and Gene Ontology (GO) ( 23 ) databases and syntenic genes and BLASTX alignments (best hit, e-value 1E-05) of Brassicaceae genes to the A. thaliana genome also have been included. The numbers of annotation records in these datasets for these species (excluding A. thaliana ) are shown in Table 2 . We used InterProScan (V48.0) ( 24 ), which includes 28 175 GO terms, to generate the InterPro domain and GO annotations. When InterProScan is updated, the GO annotations also will be updated in BRAD.
Overview of the 13 Brassicaceae genomes in BRAD V2.0
| Species | Genome size (Mb) | No. of chromosomes | No. of genes | Status | Source |
|---|---|---|---|---|---|
| A. thaliana | 120 | 5 | 27 416 | Chromosome | TAIR ( https://www.arabidopsis.org/ ) |
| A. lyrata | 207 | 8 | 32 670 | Chromosome | ( http://www.phytozome.net/ ) |
| A. arabicum | 203 | 11 | 37 839 | Scaffold | ( http://mustang.biol.mcgill.ca:8885/ ) a |
| B. rapa | 284 | 10 | 41 174 | Chromosome | BRAD ( http://brassicadb.org/brad/ ) |
| B. oleracea | 540 | 9 | 45 758 | Chromosome | BolBase ( http://ocri-genomics.org/bolbase/index.html ) a |
| B. napus | 840 | 19 | 101 040 | Chromosome | CoGe ( https://genomevolution.org/CoGe/ ) a |
| C. sativa | 641 | 20 | 94 495 | Chromosome | ( http://www.camelinadb.ca ) |
| C. rubella | 135 | 8 | 28 447 | Chromosome | ( http://www.phytozome.net/ ) |
| L. alabamica | 174 | 11 | 38 676 | Scaffold | ( http://mustang.biol.mcgill.ca:8885/ ) a |
| S. irio | 259 | 7 | 49 956 | Scaffold | ( http://mustang.biol.mcgill.ca:8885/ ) a |
| S. parvula | 114 | 7 | 28 901 | Chromosome | GenBank ( http://www.ncbi.nlm.nih.gov/genbank ) |
| T. halophila | 243 | 7 | 29 284 | Scaffold | ( http://www.phytozome.net/ ) |
| T. salsuginea | 234 | 7 | 28 457 | Scaffold | GenBank ( http://www.ncbi.nlm.nih.gov/genbank ) |
a Collaboration with project investigator for genome analysis .
Numbers of annotation records in BRAD V2.0 from the Gene Ontology (GO), InterPro, KEGG, Swiss-Prot and TrEMBL databases, as well as syntenic genes (Orthologs) and BLASTX alignments (best hits) to the A. thaliana genome sequence
| Species | GO | InterPro | KEGG | Swiss-Prot | TrEMBL | Orthologs | BLASTX |
|---|---|---|---|---|---|---|---|
| A. arabicum | 32 609 | 56 964 | 28 773 | 21 689 | 20 342 | 15 754 | 26 910 |
| A. lyrata | 53 457 | 64 268 | 29 723 | 22 396 | 31 780 | 22 552 | 32 524 |
| B. rapa | 62 875 | 62 852 | 20 463 | 28 501 | 37 220 | 26 194 | 40 946 |
| B. oleracea | 76 109 | 85 261 | 21 071 | 30 504 | 40 498 | 31 794 | 45 603 |
| B. napus | 96 202 | 136 419 | 88 173 | 68 590 | 44 436 | 59 707 | 89 257 |
| C. rubella | 38 109 | 59 533 | 27 927 | 22 123 | 26 195 | 20 952 | 27 973 |
| C. sativa | 112 461 | 168 977 | 90 572 | 71 615 | 35 161 | 64 433 | 91 080 |
| L. alabamica | 42 588 | 66 021 | 33 062 | 25 932 | 22 838 | 24 259 | 32 277 |
| S. irio | 38 116 | 67 961 | 35 969 | 26 150 | 24 992 | 18 224 | 33 522 |
| S. parvula | 36 542 | 53 883 | 25 986 | 20 179 | 21 721 | 20 846 | 28 827 |
| T. halophila | 39 795 | 61 350 | 28 634 | 22 732 | 23 398 | 19 819 | 28 594 |
| T. salsuginea | 33 820 | 52 397 | 25 730 | 20 158 | 23 104 | 19 328 | 25 903 |
| Total | 662 683 | 935 886 | 456 083 | 380 569 | 351 685 | 343 862 | 503 416 |
Updated feature: genome synteny analysis
Genome synteny analysis provides information for studies into the evolution of genome and gene function among species. BRAD V1.0 provided syntenic gene pairs between B. rapa and A. thaliana so that the gene information of the well-studied model plant A. thaliana could be used to annotate B. rapa genes . In BRAD V2.0, whole-genome synteny relationships between A. thaliana genes and the genes of other Brassicaceae species have been generated and integrated. We obtained syntenic gene pairs that ranged from 17 800 between A. thaliana and Aethionema arabicum to 59 191 between A. thaliana and Camelina sativa ( Table 3 and Supplementary Tables S1 and Supplementary Data ). The number of tandem gene arrays is shown in Table 4 ; most had syntenic counterparts in the A. thaliana genome. These datasets can be used to investigate genomic rearrangement history, share gene annotation information and investigate functional differentiation of orthologous genes among Brassicaceae species.
Numbers of syntenic genes in 24 genomic blocks of the three subgenomes in B. rapa and B. oleracea. The three subgenomes were partitioned as described previously ( 3 ), and named as least fractionated subgenome (LF), more fractionated subgenome 1 (MF1) and more fractionated subgenome 2 (MF2)
| Genomic blocks | B. rapa | B. oleracea | ||||
|---|---|---|---|---|---|---|
| LF | MF1 | MF2 | LF | MF1 | MF2 | |
| A | 1230 | 653 | 785 | 1163 | 645 | 756 |
| B | 796 | 500 | 495 | 746 | 483 | 478 |
| C | 422 | 324 | 257 | 394 | 333 | 256 |
| D | 63 | 209 | 283 | 43 | 205 | 257 |
| E | 980 | 687 | 492 | 953 | 650 | 487 |
| F | 1567 | 1098 | 898 | 1483 | 1044 | 873 |
| G | 35 | 17 | 78 | 37 | 16 | 71 |
| H | 263 | 167 | 171 | 248 | 166 | 166 |
| I | 366 | 369 | 82 | 343 | 339 | 83 |
| J | 1152 | 926 | 726 | 1120 | 881 | 698 |
| K | 141 | 128 | 87 | 146 | 117 | 76 |
| L | 247 | 184 | 120 | 232 | 171 | 114 |
| M | 276 | 135 | 125 | 277 | 126 | 105 |
| N | 811 | 538 | 450 | 761 | 526 | 440 |
| O | 294 | 168 | 81 | 278 | 173 | 82 |
| P | 150 | 124 | 66 | 138 | 121 | 54 |
| Q | 307 | 179 | 178 | 299 | 173 | 184 |
| R | 1303 | 879 | 866 | 1274 | 836 | 824 |
| S | 259 | 129 | 69 | 274 | 125 | 63 |
| T | 96 | 110 | 109 | 88 | 110 | 109 |
| U | 1636 | 1082 | 821 | 1582 | 1028 | 791 |
| V | 280 | 197 | 222 | 276 | 169 | 209 |
| Wa | 111 | 77 | 52 | 104 | 67 | 51 |
| Wb | 619 | 464 | 501 | 574 | 428 | 446 |
| X | 489 | 242 | 270 | 481 | 234 | 271 |
| Total | 13 893 | 9586 | 8284 | 13 314 | 9166 | 7944 |
Tandem array statistics for each Brassicaceae species in BRAD V2.0
| Species | Tandem (arrays|genes) | Syntenic tandem (arrays|genes) | Ratio (syntenic tandem/tandem) (%) |
|---|---|---|---|
| B. rapa | 2041|4896 | 1570|3796 | 76.9 |
| B. oleracea | 1823|4223 | 1290|2960 | 70.8 |
| S. parvula | 1139|2700 | 1022|2545 | 89.7 |
| A. lyrata | 1751|4388 | 1441|3743 | 82.3 |
| L. alabamica | 789|1769 | 454|1026 | 57.5 |
| C. rubella | 1619|4377 | 1397|3691 | 86.3 |
| S. irio | 1760|4221 | 1080|2710 | 61.4 |
| A. arabicum | 1355|3557 | 880|2377 | 64.9 |
| T. halophila | 1414|3642 | 990|2491 | 70.0 |
| T. salsuginea | 1401|3378 | 975|2337 | 69.6 |
| B. napus | 4406|10 228 | 2317|5355 | 52.6 |
| C. sativa | 5713|13 961 | 1121|2722 | 19.6 |
Brassica crops experienced a common and relatively recent (9–15 million years ago) whole-genome triplication event after three rounds of polyploidization (γ, β and α whole-genome duplication) in Brassicaceae ( 3 , 5 , 6 , 8 , 25 ). They have three subgenomes in their genomes compared with other Brassicaceae species. B. napus is the allotetraploid of B. rapa and B. oleracea , thus its genome is composed of six subgenomes. Additionally, C. sativa experienced an independent and more recent whole-genome triplication event than the event in Brassica . Based on the rules that have been used to partition the three subgenomes of B. rapa ( 3 , 26 ), syntenic paralogous genes in the subgenomes of the four polyploidy species mentioned above were separated and updated in BRAD V2.0.
Syntenic gene pairs were plotted as dots on a two-dimensional figure, where the x and y axes denote the chromosomal positions of the genes in any two genomes. Continuously distributed syntenic genes in any two genomes generate dot plots with fragments of lines ( Figure 2 B). The dot-formed lines that are produced represent the chromosomal fragments and their different arrangements between two genomes. The ancestral genomic blocks (GBs) ( 27 , 28 ) of corresponding chromosomal fragments are also shown ( Figure 2 B).
Genome synteny resource guidelines
Mining syntenic genes
BRAD V2.0 has five main sections: Browse, Search, Tools, Download and Links. Placing the cursor over the Search section activates a drop-down menu. Clicking on the ‘Syntenic gene’ option ( Figure 1 A) opens the search syntenic genes page where checkboxes for 11 Brassicaceae species ( B. napus contains the Brassica A and C subgenomes) allow users to choose their required searches; a syntenic gene search between A. thaliana and B. rapa is set as the default ( Figure 1 B). Next, users are required to provide a gene ID to search for syntenic genes among the selected species ( Figure 1 C). The number of genes flanking the syntenic genes can be selected from a drop-down list as 10, 20 or 50. The search is activated by clicking the ‘GO’ button. For example, by selecting B. oleracea and A. lyrata as the species, inputting Bra019255 as the gene ID , setting the number of flanking genes to 10 (the default) and clicking the GO button, the results are output in a table that appears below the search panel as shown in Figure 1 D. The solid circles indicate genes. Information about a gene can be obtained by placing the cursor over a circle. Clicking on the solid circle opens a pop-up dialog-window in which navigation information for the target gene is displayed ( Figure 1 E). Clicking on a tandem symbol (two small dots following a gene symbol) displays the corresponding tandem gene array information at the bottom of the search page ( Figure 1 F).
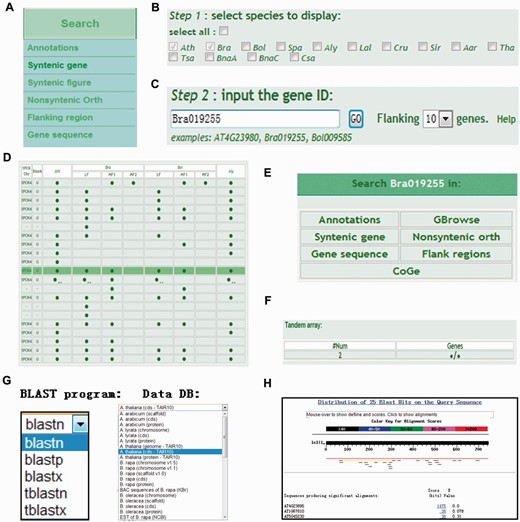
Using the ‘Syntenic gene’ search option in BRAD V2.0. ( A ) The ‘Syntenic gene’ option is selected by placing the cursor over the Search section and clicking on ‘Syntenic gene’. ( B ) Select the Brassicaceae species genomes to be searched using the checkboxes. ( C ) Input the ID of the gene to be searched. ( D ) The results of the syntenic gene search in the selected species are output in a table. The solid circles represent genes. Clicking on a circle opens a dialog-window. Clicking on a tandem array symbol (‘two small dots’) outputs the tandem array. ( E ) The dialog-window provides navigation of links to information about the target gene. ( F ) The output tandem array is displayed under the results table. ( G ) The BLAST services can be selected from the Tools section. ( H ) BLAST alignments of nucleotide protein-coding sequences (CDS) of A. thaliana .
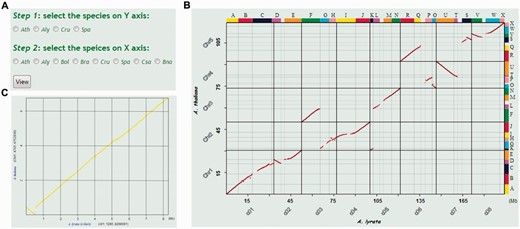
Obtaining pairwise syntenic dot plots between two Brassicaceae genomes in BRAD V2.0. The ‘Syntenic figure’ option is selected by placing the cursor over the Search section and clicking on ‘Syntenic figure’. ( A ) Select the Brassicaceae species genomes to be plotted. ( B ) Syntenic figure between A. thaliana and A. lyrata . Syntenic gene pairs are plotted as red dots. Genomic blocks are shown as color-coded bars labeled A–X on the top and right sides of the plot. The genome sequences of A. lyrata and A. thaliana are displayed on the x and y axes, respectively. ( C ) Syntenic figure of local genomic block A obtained by clicking on the corresponding block. Chromosome labels and the intervals of the A block are given in brackets after the labels on the two axes.
Users can also input their own nucleotide sequences instead of gene IDs using the BLAST services (Blastn, Blastp, Blastx tBlastn and tBlastx) provided under the Tools section in BRAD V2.0. The BLAST search page allows users to search against bulk data from different Brassicaceae sequence databases such as genomes, BACs, protein-coding genes, proteins and ESTs ( Figure 1 G). Users will obtain related gene IDs based on the BLAST alignments as output ( Figure 1 H). The obtained gene IDs can be used as input for the search syntenic genes analysis described above ( Figure 1 B–F). Furthermore, if a user’s nucleotide sequences are not derived from gene regions, the user may still be able to obtain the location of their sequences in the genomes of certain species. This information can be used to retrieve the flanking sequences and elements, which can be visualized or downloaded from GBrowse under the Tools section in BRAD V2.0.
Visualization of synteny analysis
A new ‘Syntenic figure’ function is available under the Search section in BRAD V2.0, which can be used to better illustrate the genomic synteny relationship between two Brassicaceae species. This function can be used to plot genomic synteny relationships as two-dimensional figures. One of the four ancestral species ( A. thaliana , A. lyrata , C. rubella and S. parvula ) can be selected for display on the y axis and one of eight other Brassicaceae species can be selected for display on the x axis by clicking the corresponding checkboxes. A total of 28 such figures are available (ignoring self-to-self plots). For example, if ‘Ath’ is chosen for the y axis and ‘Aly’ is chosen for the x axis, then by clicking the ‘View’ button ( Figure 2 A), users will obtain the image shown in Figure 2 B. The lines formed by the red dots show the genomic synteny relationships between the two genome sequences. Clicking on any of the GB regions (shown in color-coded bars), such as GB ‘A’, opens a figure that shows detailed synteny information ( Figure 2 C). Clicking a dot, which represents a particular gene, on the GB figure will open the GBrowse_syn Web page ( 17 ) and show the 100-Kb genomic region flanking the clicked dot.
Syntenic blocks analysis for multiple genome resources
The GBrowse_syn ( 16 ) tool for visualizing synteny or collinear genomic regions among multiple genomes can be accessed from the Tools section of BRAD 2.0. GBrowse_syn uses species name and genomic position consisting of the chromosome label, and start and stop positions as input. For example, if ‘c01:601,285..801,285’ is input in the Landmark search box and A. lyrata is selected as the target species from the Genome to Search drop-down list, then the genomic region from 601 285 bp to 801 285 bp on chromosome 1 of A. lyrata will be searched ( Figure 3 A). By checking the boxes of A. thaliana and S. parvula ( Figure 3 A) and clicking the ‘Search’ button next to the Landmark search box, a visualization of syntenic blocks for the multiple genomes is obtained ( Figure 3 B). The sequence of the target species (in this case A. lyrata ) is shown in the middle of the graph as the reference genome, and the genomes being compared with the reference are displayed above and below it. Clicking on the track of a compared species changes it into the reference species and all others become the compared genomes. Furthermore, a link to the ‘Syntenic gene’ search section is provided for each gene icon shown on the graph of multiple genome syntenies.
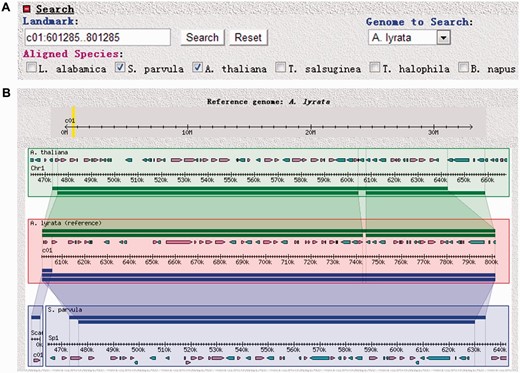
Using GBrowse_syn for local syntenic visualization of Brassicaceae genome sequences in BRAD V2.0 . The ‘GBrowse_syn’ option is selected by placing the cursor over the Tools section and clicking on ‘GBrowse_syn’. ( A ) Search panel for GBrowse_syn. ( B ) Representative output showing local synteny relations among the A. thaliana , S. parvula and A. lyrata genomes.
Discussion and conclusions
Many Brassica databases have been built to better understand and use the genomic datasets from Brassica species. These databases include the Brassica Database BRAD ( http://brassicadb.org ), Brassica.info ( http://www.brassica.info/ ), BrassEnsembl ( http://www.brassica.info/BrassEnsembl/index.html ), BrassicaDB ( http://brassica.nbi.ac.uk/BrassicaDB/ ), CropStoreDB ( http://www.cropstor edb.org/ ) and BolBase ( http://www.ocri-genomics.org/bol base/index.html ). These databases all have different emphasis. Brassica.info integrates information about genomic resources and releases news of projects or activities on Brassica studies. It also provides downloading services for some genome data. BrassEnsembl visualizes different sets of Brassica genomic data under a single frame. CropStoreDB provides a practical approach to managing crop genetic data, whereas BolBase ( B. oleracea Genome Database) is focused on genomic structure comparisons of the B. oleracea genome. Unlike these other databases, BRAD uses information from genomic studies and gene function studies in the model species A. thaliana to annotate the newly sequenced genomes of Brassica species.
BRAD V2.0 is a substantially improved version of BRAD V1.0. In BRAD V2.9, more Brassicaceae genomes have been integrated, and comprehensive functional annotations of all the Brassicaceae gene models, genome and gene-level syntenic datasets and visualization tools have been provided. In addition, we have included a new application ‘Syntenic figure’ in the search section to allow users to view pairwise syntenic relationships between the Brassicaceae genomes in BRAD V2.0. We used the GBrowse_syn module to visualize multiple genome synteny. The inclusion of bulk Brassicaceae genome datasets and new applications make BRAD V2.0 a user friendly platform from which to conveniently retrieve genomic information from the genome to gene levels. The updated BRAD V2.0 will be a valuable resource for research into comparative genomics, plant evolution and molecular biology, as well as for breeders of Brassicaceae crops.
Funding
973 program (2012CB113900 and no. 2013CB127000), the 863 program (2012AA100101), the National Natural Science Foundation of China (grant no. 31301771) and the Science and Technology Innovation Program of the Chinese Academy of Agricultural Sciences. Research was carried out in the Key Laboratory of Biology and Genetic Improvement of Horticultural Crops, Ministry of Agriculture, China.
Conflict of interest . None declared.
References
Author notes
Citation details: Wang,X., Wu,J., Liang,J. Brassica database (BRAD) version 2.0: integrating and mining Brassicaceae species genomic resources. Database (2015) Vol. 2015: article ID bav093; doi:10.1093/database/bav093
