


Summary
Our aim was to analyse dentoskeletal effects and long-term stability of Class II treatment carried out with an eruption guidance appliance (EGA) in early mixed dentition.
Sixty-five Class II patients (38 females and 27 males), treated with an EGA in early mixed dentition, were compared with 58 children (26 females and 32 males) with untreated Class II malocclusion. The mean age in the treatment group at the start (T1) and end of treatment (T2) was 5.4 years (±0.4) and 8.5 years (±0.9), respectively, and at the final examination in the early permanent dentition (T3) 16.7 years (±0.4). In the control group, the mean age at T1 and T2 were 5.1 years (±0.5) and 8.4 years (±0.5), respectively. The independent and dependent sample t-tests, Chi-square test, and Fisher’s test were used in the statistical evaluation.
In the treatment group, the frequency of Class II decreased from 100 to 14% during the treatment (T1–T2) and a significant correction took place in all occlusal variables. At T2, the treatment and control groups showed statistically significant differences (P < 0.05) in all occlusal variables. In the treated children, mandibular length increased 5 mm more (P < 0.001) from T1 to T2 compared to the control children, and the ANB angle became significantly smaller (P = 0.006). During the post-treatment period (T2–T3), the frequency of Class II in the treatment group decreased from 14 to 2% (P < 0.05), overbite increased from 2.2 to 3.1 mm (P < 0.05), and lower crowding increased from 2to 14% (P < 0.05). Post-treatment changes in overjet and upper crowding were not statistically significant. At T3, the mean values of the SNA, SNB, and ANB angles were 83.0° (SD 3.9°), 81.3° (SD 3.8°), and 2.4° (SD 1.5°), respectively.
A clinically significant correction of the molar relationship, overjet, overbite, incisor alignment, and growth enhancement of the mandible were observed after treatment in early mixed dentition. The treatment results remained largely stable in the early permanent dentition. However, an increase was observed in overbite and lower crowding. None of the children treated in early mixed dentition needed a second treatment phase.
Introduction
Diagnostic signs of Class II malocclusion are frequently detectable already in deciduous or early mixed dentition, and once established, the Class II developmental pattern seems to persist with only limited capacity for spontaneous correction during growth (1–5). In spite of the early onset of the condition, benefits of early intervention remain controversial. Interceptive treatment in mixed dentition has been shown to produce favorable results but it has been frequently questioned whether clinically relevant long-term changes can be gained by early intervention (3, 6–15).
Eruption guidance appliance (EGA) has been shown to be effective in the early treatment of many types of malocclusions including excess overjet and overbite, anterior crowding, and Class II malocclusion (13–14, 16–19). The effects of the appliance are largely dentoalveolar but significant skeletal changes have been reported (14–16, 18). In particular, EGA treatment seems to affect mandibular growth and position thereby contributing to the Class II correction (14, 16, 18).
The EGA effects have mainly been investigated in patient groups that underwent treatment in late mixed dentition, with only a few where the onset of the treatment was in early mixed dentition (13–14, 16–17, 19–20). Stable treatment results have been reported in short-term but only one long-term follow-up study has been carried out (16, 19–20).
The aim of the present study was to evaluate occlusal and skeletal effects of Class II treatments that were carried out in early mixed dentition with EGA, and to investigate the stability of the treatment results in the early permanent dentition.
Materials and methods
This investigation is part of a prospective cohort study evaluating the effectiveness of EGA in early orthodontic treatment. The participating individuals were orthodontic patients at three municipal health centres in the western part of Finland. The treatment group were obtained from two rural municipalities, Jalasjärvi and Kurikka, where all children born 1992 and 1993 were examined. Of the 315 children who needed treatment, 33 were excluded because they were treated with other appliances; families of 27 declined treatment. The remaining 255 children started treatment with EGA (Figure 1) in early mixed dentition. No records were available for the 50 children who discontinued the treatment due to moving, non-compliance, or other reasons (see the flow chart, Figure 1). The control group was obtained from the neighbouring town of Seinäjoki and it comprised children randomly selected among those who fulfilled the same occlusal criteria for EGA treatment as the children in the treatment group. The present analysis is based on the records of the remaining 65 children who all completed the treatment successfully. The control children were followed-up from early mixed dentition to middle mixed dentition, and all of them received orthodontic treatment starting during middle mixed dentition, following the treatment guidelines of Seinäjoki where early treatment was not available at the time. All subjects were ethnic Finns. Further details of the treatment and control groups have been published earlier (13, 21). All children in the treatment group were treated according to a pre-established early treatment protocol in the orthodontic clinics of Jalasjärvi and Kurikka, with minor adjustments to ensure timely and controlled data collection as described earlier (21).
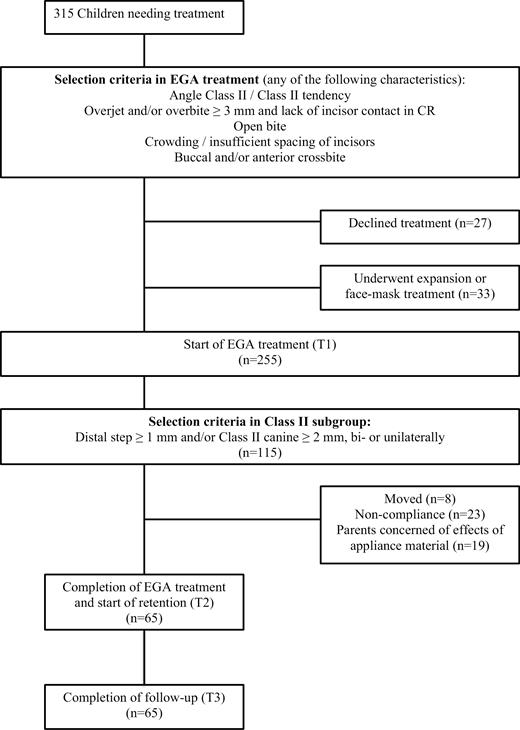
Flow chart of the treatment group.
The present analysis is based on the records of 65 Class II children (38 girls and 27 boys) treated during early mixed dentition and 58 control children (26 girls and 32 boys), all fulfilling the following inclusion criteria: a distal step equal or larger than 1 mm and/or Class II type canine relationship equal or larger than 2 mm, bi- or unilaterally. The fact that the sex distribution was not equal between the treatment and control groups may have affected the results.
The children were examined at the beginning (T1) and at the end of the early mixed dentition period (T2). The mean age of the children in the treatment group was 5.4 years (SD 0.4) at T1 and 8.5 years (SD 0.9) at T2, and in the control group 5.1 years (SD 0.5) at T1 and 8.4 years (SD 0.5) at T2. The early treatment was carried out with EGA from T1 to T2, followed by retention. Retention was continued until the permanent canines, premolars, and second molars had erupted using an EGA as the retainer. During the active treatment, the appliance was used every night, and during retention, two nights per week. A detailed description of the treatment protocol has been published earlier (13). The children in the treatment group were further examined close to their 17th birthday (T3). The mean age of the children at T3 was 16.7 years (SD 0.4). The mean retention time was 4.9 years (SD 1.6, range 1.3–7.1 years) and mean out-of-retention time at T3 was 3.1 years (SD 2.1).
Overbite and overjet were measured directly in the mouth by two calibrated orthodontists, all other occlusal features were assessed and measured from dental casts, taken at T1, T2, and T3, by the first author (KKN) as described earlier (22). Occlusal contacts of the incisors were assessed directly in the centric relation; a non-occlusion was recorded if both overjet and overbite were positive but no tooth-tooth contact was detected. Space conditions were assessed from dental casts, and the arch was recorded as crowded if overlapping incisors were present or distemas between incisors were lacking. To estimate the accuracy of measuring, 30 randomly selected cases were measured twice and the Dahlberg measurement error (23) was calculated for each variable. The error varied between 0.11 and 0.14. Cephalometric analysis was performed by the first author (KNN) using the RMO Jiffy Orthodontic Evaluation 32-program. A detailed description of the cephalometric landmarks and measurements has been published earlier (24). Measurement error was evaluated digitizing and measuring 30 randomly selected cephalograms twice at an interval of 6 months. The intra-class correlation of repeated measurements, tested by Bland–Altman method (25, 26), varied between 0.92 and 0.99 indicating good accuracy. The Student t-tests for independent and dependent samples were used in the statistical evaluation of the continuous variables, and the Chi-square and Fisher’s tests for categorical variables; a P-value less than 0.05 was considered to be statistically significant.
Results
Occlusal findings in the treatment and control groups at T1, T2, and T3 are given in Table 1. At T1, no statistically significant differences between the treatment group and control group or between boys and girls were detected. During the active treatment period, while the permanent incisors were erupting, overjet, overbite, frequency of non-occlusion, and crowding showed significant improvement in the treatment group. The frequency of Class II decreased from 100 to 14% and in the control group from 100 to 78%. At T2, all differences in occlusal variables between treatment and control groups were statistically significant. During the post-treatment period, overbite increased from 2.2 to 3.1 mm (P < 0.001), frequency of Class II decreased from 14 to 1% (P = 0.02), and frequency of lower crowding increased from 2 to 14% (P = 0.02). Changes in overjet or in the frequencies of non-occlusion and upper crowding were not statistically significant.
Overjet, overbite, non-occlusion, molar relationship, and crowding at T1, T2, and T3.
| T1 | T2 | T3 | ||||||
|---|---|---|---|---|---|---|---|---|
| Treatment group (N = 65) | Control group (N = 58) | Treated vs. control P | Treatment group (N = 65) | Control group (N = 58) | Treated vs. control P | Treatment group (N = 65) | Treated at T2 vs. treated at T3 P | |
| Overjet (mm) | ||||||||
| Mean (SD) | 3.4 (1.4) | 3.4 (2.0) | 0.8 | 2.2 (0.8) | 4.7 (2.0) | 0.001 | 2.1 (0.8) | 0.8 |
| 95% CL | 3.1–3.8 | 2.8–3.9 | 2.0–2.4 | 4.2–5.2 | 1.9–2.3 | |||
| Overbite (mm) | ||||||||
| Mean (SD) | 2.9 (2.0) | 3.5 (2.1) | 0.1 | 2.2 (1.0) | 4.4 (2.2) | 0.001 | 3.1 (1.1) | 0.001 |
| 95% CL | 2.4–3.4 | 2.9–4.0 | 1.9–2.4 | 3.8–5.0 | 2.8–3.4 | |||
| Non-occlusion at centric relation | 34 (52%) | 22 (38%) | 0.16 | 1 (2%) | 26 (45%) | 0.001 | 0 | 1 |
| Class II | 65 (100%) | 58 (100%) | 1 | 9 (14%) | 45 (78%) | 0.001 | 1 (1%) | 0.02 |
| Crowding (%) | ||||||||
| Upper | 5 (8%) | 5 (9%) | 1 | 2 (3%) | 29 (50%) | 0.001 | 2 (3%) | 0.3 |
| Lower | 23 (35%) | 29 (50%) | 0.15 | 1 (2%) | 29 (50%) | 0.001 | 9 (14%) | 0.02 |
Continuous variables were statistically evaluated with the Student t-test and categorical variables with the X2-test or the Fisher’s test.
The cephalometric findings are given in Table 2. At T1, the treatment and control samples were skeletally similar with the exception of facial axis angle, the angle between the mandibular plane and Frankfort horizontal, and the angle of lower facial height, all indicating that in the treatment group, mandible showed greater tendency towards opening growth direction. Furthermore, the labial inclination of the upper incisors and the interincisal angle were larger in the treatment group at T1. The baseline differences may have acted as confounding factors.
Cephalometric variables in the treatment group and in the control group at T1, T2, and T3.
| Treatment at T1 | Control at T1 | Difference between treatment and control group at T1 | Treatment group at T2 | Control group at T2 | Difference between treatment and control group at T2 | Treatment group at T3 | |||
|---|---|---|---|---|---|---|---|---|---|
| Mean (SD) | Mean (SD) | 95% CI | P | Mean (SD) | Mean (SD) | 95% CI | P | Mean (SD) | |
| Maxillary skeletal position | |||||||||
| A/Na-verticale (mm) | −0.7 (2.3) | −0.2 (2.1) | −1.23 to 0.3 | 0.22 | −1.4 (2.9) | −0.6 (2.2) | −1.81 to 0.17 | 0.11 | −0.6 (3.2) |
| Condylion-A (mm) | 75.4 (3.8) | 76.2 (4.4) | −2.34 to 0.61 | 0.25 | 80.5 (3.9) | 80.4 (3.9) | −1.36 to 1.7 | 0.85 | 95.4 (8.2) |
| Anterior cranial length (mm) | 50.6 (7.0) | 52.3 (3.0) | −3.59 to 0.2 | 0.08 | 51.7 (3.1) | 52.3 (3.1) | −1.82 to 0.53 | 0.28 | 62.4 (5.1) |
| SNA (°) | 83.0 (3.7) | 82.8 (3.5) | −1.09 to 1.5 | 0.75 | 81.9 (3.6) | 81.9 (3.6) | −1.24 to 1.38 | 0.91 | 83.0 (3.9) |
| Mandibular skeletal position | |||||||||
| Pogonion/NA-verticale (mm) | −8.6 (4.6) | −7.7 (3.8) | −2.38 to 0.61 | 0.24 | −7.9 (6.7) | −7.2 (4.9) | −2.95 to 1.61 | 0.56 | −2.8 (7.1) |
| Condylion-Gnathion (mm) | 90.8 (5.1) | 92.1 (5.3) | −3.11 to 0.61 | 0.19 | 102.0 (6.4) | 98.7 (4.8) | 1.19 to 5.42 | <0.001 | 125.3 (10.3) |
| Facial axis angle (°) | 92.5 (3.3) | 86.8 (3.1) | 4.57 to 6.86 | <0.001 | 90.9 (3.6) | 86.2 (3.3) | 3.38 to 6.04 | <0.001 | 93.5 (4.6) |
| Mandibular plane/ Frankfort horizontal (°) | 25.0 (4.5) | 22.1 (4.9) | 1.31 to 4.65 | <0.001 | 26.0 (5.0) | 22.1 (4.6) | 2.04 to 5.74 | <0.001 | 21.2 (5.0) |
| SNB (°) | 77.6 (3.3) | 77.3 (3.3) | −9.4 to 1.4 | 0.7 | 78.4 (3.3) | 77.4 (3.5) | −0.2 to 2.26 | 0.1 | 81.3 (3.8) |
| Maxilla to mandible | |||||||||
| Maxillo-mandibular differential (mm) | 14.9 (3.3) | 15.2 (2.8) | −1.35 to 0.82 | 0.63 | 20.0 (3.5) | 18.4 (3.4) | 0.22 to 2.86 | 0.02 | 29 (5.7) |
| Convexity (mm) | 4.3 (1.9) | 4.1 (1.9) | −0.48 to 0.87 | 0.58 | 2.9 (2.2) | 2.6 (1.9) | −0.5 to 1.1 | 0.46 | 1.1 (3.0) |
| ANB (°) | 5.5 (2.3) | 5.5 (1.9) | −0.73 to 0.79 | 0.94 | 3.4 (1.8) | 4.4 (2.1) | −1.73 to −0.3 | 0.006 | 2.4 (1.5) |
| Lower facial height | |||||||||
| Menton-ANS (mm) | 52.5 (4.0) | 53.5 (3.6) | −2.31 to 0.41 | 0.17 | 57.0 (4.9) | 56.8 (3.5) | −1.48 to 1.83 | 0.83 | 67.5 (7.7) |
| Lower facial height (°) | 44.8 (3.8) | 40.8 (6.3) | 2.33 to 6.11 | <0.001 | 41.6 (4.1) | 40.4 (3.3) | −0.22 to 2.63 | 0.1 | 42.0 (4.8) |
| Wits appraisal (mm) | 1.1 (2.2) | 1.0 (2.8) | −1.02 to 1.09 | 0.95 | −1.1 (2.4) | 0.4 (2.5) | −2.24 to −0.58 | 0.002 | −0.31 (2.5) |
| Dental relations | |||||||||
| A1/A-Pogonion (mm) | 3.7 (1.8) | 3.6 (1.8) | −0.6 to 0.71 | 0.87 | 5.2 (1.8) | 6.0 (2.2) | −1.59 to −0.03 | 0.043 | 5.3 (2.4) |
| B1/A-Pogonion (mm) | −0.4 (2.2) | −0.5 (2.1) | −0.67 to 0.89 | 0.78 | 3.3 (1.8) | 0.4 (2.5) | 2.07 to 3.75 | <0.001 | 2.6 (2.2) |
| Interincisal angle (°) | 148.3 (14.7) | 136.5 (13.4) | 6.76 to 16.85 | <0.001 | 127.1 (7.2) | 122.2 (10.7) | 1.37 to 8.41 | 0.007 | 130.6 (9.9) |
| IMPA (°) | 88.9 (8.0) | 84.5 (7.0) | 1.38 to 7.43 | 0.005 | 97.6 (7.0) | 88.8 (6.6) | 6.19 to 11.45 | <0.001 | 96.0 (7.6) |
| A1 to S-Na (°) | 88.7 (11.4) | 86.9 (10.7) | −2.71 to 6.22 | 0.44 | 103.8 (5.7) | 97.7 (7.7) | 3.46 to 8.65 | <0.001 | 106.4 (7.4) |
Variables were statistically evaluated with the Student t-test.
In maxilla, the changes from T1 to T2 were similar in the treatment and control groups and seemed to reflect normal growth during this period. The SNA angle indicated a neutral position of the maxilla with only minor changes between T1 and T3. From T1 to T2, the mandibular length increased 11.4 mm (SD 4.3) in the treatment group and 6.4 mm (SD 3.5) in the control group. The difference of 5.0 mm between the treatment and control groups was highly significant (P < 0.001). The mean annual growth increments in the treatment and control groups between T1 and T2 were 3.5 mm and 1.9 mm, respectively. In the treatment group, significant mandibular growth continued after T2. The length of the mandible at T1, T2, and T3 is given separately for boys and girls in Table 3.
Mandibular length in 65 Class II children at T1, T2, and T3.
| T1 | T2 | T3 | ||
|---|---|---|---|---|
| mm | N | Mean (SD) | Mean (SD) | Mean (SD) |
| Girls | 38 | 89.8 (5.2) | 100.5 (5.1) | 121.5 (8.2) |
| Boys | 27 | 92.2 (4.7) | 103.9 (7.4) | 130.6 (10.8) |
| T1 | T2 | T3 | ||
|---|---|---|---|---|
| mm | N | Mean (SD) | Mean (SD) | Mean (SD) |
| Girls | 38 | 89.8 (5.2) | 100.5 (5.1) | 121.5 (8.2) |
| Boys | 27 | 92.2 (4.7) | 103.9 (7.4) | 130.6 (10.8) |
Many variables in the treatment group, for example the position of pogonion, mandibular base angle, maxillo-mandibular differential, and SNB and ANB angles showed more pronounced and statistically significant changes from T2 to T3. At T3, the SNB angle was 81.3 degrees (SD 3.8) and the ANB angle 2.4 degrees (SD 1.5). The lower incisors moved forward between T1 and T2, and became slightly less prominent from T2 to T3. Labial inclination of the upper and lower incisors increased both in the treatment and control group between T1 and T2, reflecting the normal development from deciduous to permanent dentition. In the treatment group, the lower incisors showed further labial tilting from T2 to T3 whereas inclination of the upper incisors showed a slight, non-significant lingual change. At T3, the mean interincisal angle in the treatment group was 130.6°.
Discussion
Proffit (11) suggested that an early Class II treatment is indicated only for a selected group of children and recommended adolescent growth spurt as the best time for treatment. As a contrasting approach, the present study investigates short- and long-term effectiveness of a Class II treatment that was carried out with EGA in early mixed dentition, during a period that coincides with the juvenile growth spurt. Earlier studies have indicated that EGA is effective in Class II treatment but the patients in these studies were older (16–18, 20, 27). An intervention in early mixed dentition was of interest because it could potentially prevent an increase in the severity of the malocclusion. Several studies have shown that very little if any correction of Class II relationship can be expected with growth (1–4, 28). A longitudinal analysis from 7 to 15 years of age showed that while both positive and negative changes occurred in occlusion, the need for treatment increased not decreased with age (29). A follow-up study of untreated children with Class II, Division I deep bite malocclusion reported statistically significant improvements from adolescence to adulthood (30) but clinically the changes were only marginal.
The present study showed that a treatment modality of Class II malocclusion that was based on the use of EGA during early mixed dentition gave consistently good results that were relatively stable in the early permanent dentition. None of the 65 Class II children that participated the present study showed moderate or severe signs of malocclusion such as tooth malpositions, crowding, excess overjet or overbite, openbite, crossbite, scissorsbite (buccal crossbite), or Class II relationship at T2. Therefore, they were not considered to need a second treatment phase after the initial treatment period during early mixed dentition. EGA treatment during the eruption of the permanent incisors resulted in good incisor alignment, and overjet and overbite close to 2 mm. In case of predicted space deficiencies, a good alignment of the incisors was achieved by using a series of consequently larger appliances until sufficient space for the incisors was created. In early permanent dentition, at the age of 16.7 years, a decrease of 0.1 mm was observed in overjet and an increase of 0.9 mm in overbite. This is in line with the results of an earlier study (20). No change was seen in the alignment of the upper incisors but crowding of the lover incisors increased from 2 to 14%. The late lower crowding typically occurs in both treated and untreated subjects. In the present study, it might have been possible to avoid this by using a different retention protocol, for example fixed retainers.
In the present group of 65 children that underwent early Class II treatment, the assessment of treatment need was based on the sagittal relationship of the second deciduous molars and canines. The Class II diagnosis was further supported by the finding that the mean ANB angle was 5.5° at the age of 5. As a result of the EGA treatment, the sagittal relationship was corrected from Class II to Class I in 86% of the cases during the active treatment, and it showed further improvement post-treatment. At the age of 16.7 years, 98% of the treatment children, who all had a Class II relationship at the onset of the early mixed dentition, had a Class I relationship. Similar stable Class II correction with EGA has been reported earlier in older patients (19, 20).
As a result of the treatment, the mandible of the treated children grew 5 mm more compared to controls during the period of early mixed dentition. The EGA treatment had no effect on the position or size of the maxilla. These findings are in line with those reported earlier (16). The higher mandibular growth rate seemed to be a major factor contributing to the shift from a Class II to Class I molar relationship in the treatment group. There was no indication that the enhanced growth of the mandible would have been only temporary. Comparison to the Burlington Growth Study standards (31), 118.9 mm for girls and 127.2 mm for boys at the age of 18 years, suggests that no slowing down took place in the mandibular growth after the active treatment period. It thus seems that the early EGA treatment not only corrected the occlusion but also set the skeletal development on a more normal Class I developmental path. However, a contrasting finding has been reported in older patients (32). In the RCTs that did not find long-term advantages in early growth modification, the modification phase was carried out during the period of minimum growth velocity (6–9). More consistent long-term skeletal responses were obtained when the orthopaedic treatment was initiated at the outset of the pubertal growth (33). On the other hand, our earlier findings indicated that a significant enhancement of mandibular growth resulted from a functional treatment during early mixed dentition (14). It therefore seems that the best time to carry out an orthopaedic intervention would be during a period of rapid growth, either during the juvenile growth spurt or the adolescent growth spurt.
In addition to EGA, many orthodontic appliances, for example orthopaedic headgear, twin-block, and the Fränkel appliance, can be used for growth modification in Class II treatment (6, 9, 32, 34–37). While prefabricated appliances may be less effective than custom-made activators (38, 39), the wide scope of action of the EGAs offers advantages over other appliances (40). In addition to enhancement of the mandibular growth, EGA can be used to adjust the upper and lower arch perimeter and positions of the permanent teeth. If the EGA treatment is carried out during early mixed dentition, as was the case in the present study, growth modification takes place during the juvenile growth spurt and the erupting incisors can simultaneously be guided in good alignment, with favourable overjet and overbite. With the early growth modification and adjustment of the arch perimeter there was no need for orthodontic extractions or a second treatment phase in any of the present 65 Class II children.
The treatment time of 3.1 years might be considered lengthy but during this period it was possible to achieve growth modification, Class II correction, alignment of incisors, and correction of overjet and overbite. It might be possible to shorten the treatment time but in order to fully benefit from the effects of EGA, particularly in case of more severe Class II, it seems advisable to use the appliance during the entire length of early mixed dentition period. The present study did not include a cost-benefit analysis of the treatment but the clinical experience indicated that the costs remained low because EGA treatment allows long check-up intervals, up to 3 months, and short chair-side time at check-ups. Furthermore, the early EGA treatment eliminated need for a second treatment phase. The present results corroborate the earlier finding that early intervention seems particularly beneficial in public health care with limited resources (41).
The present treatment modality, where the treatment is carried using EGA during early mixed dentition, represents a single-phase early treatment as opposed to the more common two-phase treatment protocols consisting of an early growth modification phase and a subsequent second treatment phase in the early permanent dentition (6–9). The present treatment sample was obtained from entire age cohorts of children in two municipalities and it included all types of Class II cases from mild to severe that are normally encountered in orthodontic clinics (see Table 2). There was no selection of cases on the basis of the Class II severity. An early treatment with EGA seems therefore to be a suitable treatment strategy for all types of Class II patients regardless of severity of the condition or presence of other malocclusions. Nevertheless, several questions remain open including, for example the type and length of optimal retention.
Conclusions
Class II treatment with an EGA in early mixed dentition resulted in a clinically significant correction of the molar relationship, with a favourable overjet and overbite, and good incisor alignment.
The treatment results remained largely stable during early permanent dentition, at the age of 16.7 years. Overbite increased by 0.9 mm; late crowding of the lower incisors was observed in 14% of the children.
Enhancement of the mandibular growth was observed during the active treatment. Subsequently, the mandible continued to grow on a normal path resulting in Class I skeletal relationship in early permanent dentition.
The early intervention eliminated the need for a second treatment phase. The present treatment modality using EGA in the early mixed dentition represents a single-phase early treatment of Class II malocclusion.
The children in this study were not patients in a clinical trial but normal orthodontic patients in municipal clinics. This study uses patient records of these children, and according the rules of late 1990s when the study began, the permission to use patients records for research purposes, was granted by the local health authorities who considered the ethical aspects of the research before giving the permit, and their decision thereby was considered as the ethical committee approval.
Conflict of interest
The authors have no conflict of interest.

