


Abstract
As the population of the United States ages, the incidence of age-related neurodegenerative and systemic diseases including Alzheimer’s disease (AD) and diabetes is increasing rapidly. Multiple studies report that patients with diabetes have a 50–75% increased risk of developing AD compared with age- and gender-matched patients without diabetes. Abnormally phosphorylated tau is a major building block of neurofibrillary tangles, a classic neuropathological characteristic of AD. In addition, proteolytic tau cleavage promotes AD progression due to cleaved tau serving as a nucleation center for the pathological assembly of tau filaments. The current study examines tau modification in type 1 (streptozotocin-injected) and type 2 (db/db) mouse models of diabetes. Tau phosphorylation is increased in the cortex and hippocampus of db/db mice compared with db+ control mouse brain. Interestingly, there is an age-dependent increase in tau cleavage that is not observed in age-matched control db+ animals. Streptozotocin injection also increased tau phosphorylation; however, the increase was less significant compared with the type 2 mouse model, and more importantly, no tau cleavage was detected. Our results suggest tau modification caused by insulin dysfunction and hyperglycemia may contribute to the increased incidence of AD in diabetes. We hypothesize that type 1 and type 2 diabetes may contribute to AD through different mechanisms; in type 2 diabetes, hyperglycemia-mediated tau cleavage may be the key feature, whereas insulin deficiency may be the major contributing factor in type 1 diabetes.
As the population of the United States ages, the incidence of age-related neurodegenerative and systemic diseases is increasing. Alzheimer’s disease (AD) and type 2 diabetes are two age-related diseases with high morbidity and mortality. AD currently affects 4.5 million Americans, more than double the number in 1980, and the incidence is expected to reach over 13 million by 2050 (1). In parallel, over 20 million Americans have diabetes, and the incidence of diabetes is increasing by 5% per year (2). These diseases do not occur in isolation, and multiple studies report that patients with diabetes have up to a 75% increased risk of developing AD compared with age- and gender-matched patients without diabetes (3–5). Hyperglycemia is associated with impaired cognitive performance and an increased number of mental subtraction errors in individuals with diabetes (6). Type 1 and type 2 diabetic patients demonstrate cognitive changes in learning and memory, mental flexibility, and mental speed (3, 4). In parallel, a recent study of the Mayo Clinic AD Patient Registry reveals that 80% of AD patients have either type 2 diabetes or impaired fasting glucose (7). Many features of the metabolic syndrome, including obesity, dyslipidemia, and high blood pressure, are risk factors not only for diabetes and cardiovascular disease but also for AD (8).
Two major histopathological features of AD are amyloid plaques and neurofibrillary tangles (NFT). Amyloid plaques are composed of β-amyloid (Aβ) produced by the proteolytic cleavage of amyloid precursor protein (9). The main component of NFT is hyperphosphorylated tau (10). In AD, abnormally phosphorylated tau aggregates into filaments in the cell body and proximal dendrites (11). Along with hyperphosphorylation, tau cleavage also plays an important role for the progression of NFT pathology. Tau cleaved at Asp421 by caspase-3 is more likely to form tau filaments in vitro (12), suggesting that cleaved tau serves as a nucleation center, accelerating the formation of NFT (13, 14).
Increased tau phosphorylation has been reported in diabetic animal brains (15–19). Even though a majority of the human studies focus on the connection between type 2 diabetes and AD (20, 21), most animal studies use streptozotocin (STZ)-injected animals, a model of type 1 diabetes (15, 16). We hypothesize that tau modification (hyperphosphorylation and cleavage) may serve an important connection between diabetes and AD and examined this possibility in mouse models of both type 1 (STZ-injected mice) and type 2 diabetes. The BKS.Cg-m +/+ Leprdb/J mouse (commonly known as db/db) is the best-characterized genetic model of type 2 diabetes (22, 23). In this report, we demonstrate that tau phosphorylation is increased in the cortex and hippocampus of both db/db and STZ-injected mice. In STZ-injected mice, increased tau phosphorylation is dependent on the method of STZ administration and inversely correlates with the decreased blood insulin level. In db/db mice, tau phosphorylation is more prominent compared with STZ-injected mice with similar duration of diabetes and accompanied by an age-dependent increase in tau cleavage. Tau cleavage, however, is not observed in STZ-treated mice regardless of tau phosphorylation or blood insulin levels. Our results suggest that tau modification may be a key link for the increased incidence of AD in diabetic patients. Based on the differential modification of tau phosphorylation and cleavage between db/db and STZ-injected mice, we hypothesize that type 1 and type 2 diabetes may contribute to AD through different mechanisms. In type 1 diabetes, insulin deficiency may be the major contributing factor for the increased tau phosphorylation whereas hyperglycemia-mediated tau cleavage along with insulin dysfunction may contribute to more severe tau pathology in type 2 diabetes.
Materials and Methods
Antibodies and chemicals
Polyclonal antibodies against phosphorylated tau (pTau, pS199/202, pS396, pT231, and pS422) were purchased from Biosource International (Camillo, CA). TauC3 (detecting cleaved tau) was from Millipore (Billerica, MA). Tau1 (recognizing dephosphorylated tau), Tau5 (for total tau), and anti-glyceraldehyde 3-phosphate dehydrogenase antibodies were from Chemicon (Temecula, CA). Tau46 (detecting total tau) was from Abcam (Cambridge, MA).
Induction of diabetes
The db+ and db/db mice (BKS.Cg-m +/+ Leprdb/J, JAX mice stock no. 000642) were purchased from The Jackson Laboratory (Bar Harbor, ME) and used as a model of type 2 diabetes. The db/db mice displayed elevated plasma insulin levels by 2 wk of age, hyperglycemia developed at 3–4 wk of age, and frank diabetes was always present by 5 wk of age. At least six animals were tested for each age group for both db+ and db/db except 16 wk (n = 4).
Type 1 diabetes was induced by STZ injection when mice (C57BL/6J, JAX mice no. 000664) reached a weight of 25 g (∼12 wk old). STZ was injected at the concentration of 50 mg/kg for 5 consecutive days (http://www.amdcc.org/shared/Protocols.aspx) (low-dose STZ) or 150 mg/kg once (high-dose STZ). At least six animals were used for each group. Mice were euthanized at 24 wk of age (12 wk diabetes). At least 10 animals were used for each group.
Fasting blood glucose levels were measured every 4 wk to document the persistence of diabetes. After a 6-h fast, one drop of tail blood was analyzed using a standard Glucometer (OneTouch; LifeScan Inc., Milpitas, CA). Insulin level was determined as previously described by ELISA (24).
Mouse brain preparation
The mice were euthanized according to our published protocols (25) with an overdose of sodium pentobarbital. For Western blotting analyses, dissected brains were cut in half, and the cortex and hippocampus were separated, snap frozen in liquid nitrogen, and stored at −80 C until use. For immunohistochemistry (IHC), mice were perfused intracardially with 30 ml 2% paraformaldehyde-lysine-periodate after euthanasia. After perfusion, whole brains were removed and immersed in the same fixative for 2 h to overnight and then cryoprotected in PBS (0.1 m, pH 7.2) with 30% sucrose and embedded in OCT compound (Sakura Finetek, Torrance, CA). The embedded brains were sectioned (20 μm) using a CM1850 cryostat (Leica Microsystems Inc., Bannockburn, IL). Brain sections were mounted on SuperFrost glass slides (Fisher Scientific, Pittsburgh, PA) and stored at −20 C until use.
Western immunoblotting
Western immunoblotting was performed as described previously (26). Mouse cortex and hippocampus were homogenized using a plastic pestle in a microcentrifuge tube in T-PER tissue protein extraction reagent (Pierce, Rockford, IL) containing aprotinin, leupeptin, and phenylmethylsulfonyl fluoride. The lysates were separated by SDS-PAGE and transferred to nitrocellulose membranes. Superblock solution (Pierce) with 0.1% Tween 20 was used for the blocking of the nitrocellulose membranes and dilution of the antibodies. The signal was visualized using enhanced chemiluminescence reagents (ECL; Amersham Bioscience, Piscataway, NJ) or SuperSignal West Femto maximum sensitivity substrate (Pierce) depending on the signal strength. Images were captured using the Chemidoc XRS system and analyzed by Quantity One software (Bio-Rad Laboratory, Hercules, CA). All experiments were repeated at least three times, and representative results are presented in the figures.
IHC
Slides were heated on a slide warmer (55 C) for 10 min followed by hydration in PBS for 5 min and permeabilization with PBS containing 1% BSA, 0.1% Triton X-100, and 1% normal goat serum (IHC buffer). Brain sections were incubated in primary antibody diluted in IHC buffer in a humidified chamber at room temperature overnight. After rinsing with PBS three times for 5 min each, sections were incubated with the appropriate secondary antibody conjugated with AlexaFluor 594 or 488 (Molecular Probes, Eugene, OR) for 2 h at room temperature. After rinsing with PBS, the coverslips were mounted with ProLong anti-fade mounting medium containing 4′,6-diamidino-2-phenylindole (DAPI) (Molecular Probes). The digital images were captured using a Spot-RT camera (Diagnostic Instruments Inc., Sterling Heights, MI) attached to Nikon Microphot-FXA microscope.
Results
Age-dependent increase in tau phosphorylation and cleavage in type 2 diabetes mouse model
Our preliminary in vitro studies using embryonic cortical neurons demonstrated that high-glucose treatment induces tau cleavage and apoptosis (27), suggesting that hyperglycemic conditions of diabetes induced tau dysregulation and might be a trigger for increased risk of AD in diabetic patients. Therefore, we examined this possibility using a mouse model of type 2 diabetes, BKS.Cg-m +/+ Leprdb/J, commonly known as db/db. The db/db mice express a homozygous mutation of the leptin receptor, whereas db+ mice are heterozygous for this mutation and serve as a control. The db/db mice demonstrated elevations of plasma insulin at approximately 2 wk and of blood sugar at 4–6 wk. On the C57BLKS background, there was an uncontrolled rise in blood sugar that does not respond to exogenous insulin (22, 23). At 5 wk, we detected wide variability in insulin levels among the db+ and db/db mice (data not shown); however, by 8 wk of age, hyperinsulinemia and hyperglycemia were stable phenotypes of the db/db mice. These parameters remained normal in the db+ mice (Table 1).
Blood insulin and glucose levels of db+ and db/db mice
| 8 wk (n = 8) | 16 wk (n = 4) | 24 wk (n = 10) | ||||
|---|---|---|---|---|---|---|
| db+ | db/db | db+ | db/db | db+ | db/db | |
| Glucose (mg/dl) | 163.9 ± 6.1 | 305.0 ± 53.3a | 89.8 ± 12.4 | 247.3 ± 23.6b | 144.4 ± 9.8 | 454.1 ± 53.0c |
| Insulin (μU/ml) | 40.1 ± 9.2 | 516.6 ± 81.9c | 22.8 ± 2.2 | 424.6 ± 40.5c | 20.2 ± 2.6 | 246.3 ± 40.6c |
Glucose and insulin levels are significantly higher in db/db mice compared with db+ in all age groups. We could not measure glucose and insulin levels from 2-wk animals because we were unable to collect enough blood samples for the measurement.
P < 0.02;
P < 0.002;
P < 0.0001.
As the initial experiment, we measured tau phosphorylation in the cortex and hippocampus of db+ and db/db mice at 2, 8, 16, and 24 wk of age. These ages approximately represent prediabetic (2 wk) and diabetes duration of 4, 12, and 20 wk. Tau phosphorylation of Ser199/202, Thr231, and Ser396 were measured using polyclonal antibodies directed against phosphorylated status of these residues. Total tau level was measured using Tau5 monoclonal antibody.
In 2-wk-old db/db mouse brain, there was no detectable difference in tau phosphorylation between db+ and db/db (Fig. 1A). However, as the animals became older (at 8 and 16 wk), tau phosphorylation increased in db/db mice but not in db+ mice (Fig. 1). At 24 wk, the phosphorylation levels of tau from the cortex and hippocampus of db/db mice were greatly increased at all residues examined compared with db+ control mice (Fig. 1B). There was also decreased immunoreactivity of Tau1 antibody, which detected dephosphorylated tau. When total tau was examined using Tau5 and Tau46 antibodies, we observed a slight decrease in the mobility of tau from db/db mice brain in SDS-PAGE, which might represent the massive phosphorylation of tau in these animals (Fig. 1B). When tau phosphorylation was adjusted to total tau (using Tau5 antibody), there was a slight increase in tau phosphorylation compared with db+ mice at 2 wk; however, only the increased phosphorylation at the Ser199/202 residue in the hippocampus was statistically significant (Fig. 1C). However, a statistically significant difference in tau phosphorylation was detected between db+ and db/db as the animals aged. By 24 wk, all tau residues examined demonstrated significantly increased phosphorylation in db/db mice compared with db+ in both the cortex and hippocampus (Fig. 1C).
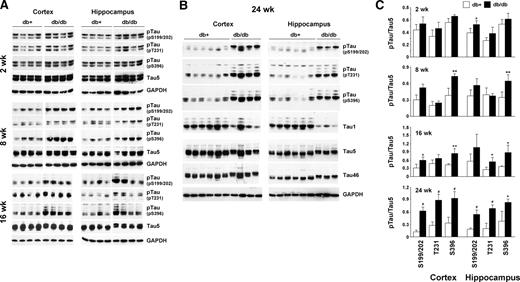
Age-dependent increase of tau phosphorylation in db/db mouse brain. Cortex and hippocampus from db+ and db/db mouse brains at 2, 8, 16 (A), and 24 (B) wk of age were homogenized in T-PER buffer. A and B, Lysates immunoblotted with the indicated antibodies; C, relative density of phosphorylated tau (pTau) over total tau (Tau5) from the same mouse measured after immunoblotting. *, P < 0.05; **, P < 0.01; #, P < 0.001 by t test. GAPDH, Glyceraldehyde 3-phosphate dehydrogenase; pT231, phosphorylated threonine 231.
Similar results were obtained with IHC. IHC staining of the brain sections of 24-wk-old animals with a tau antibody against phosphorylated Ser396 (pS396) clearly demonstrated increased phospho-tau immunoreactivity in db/db (Fig. 2B, arrows) mouse hippocampus compared with db+ (Fig. 2A). We also detected increase in tau phosphorylation in the cortex of 24-wk-old db/db mice using phospho-tau antibodies against pS396 and pS422 (Fig. 2, C–F). We obtained similar results using AT8 monoclonal antibody and antibodies against pS199/202 and pT231 (data not shown).
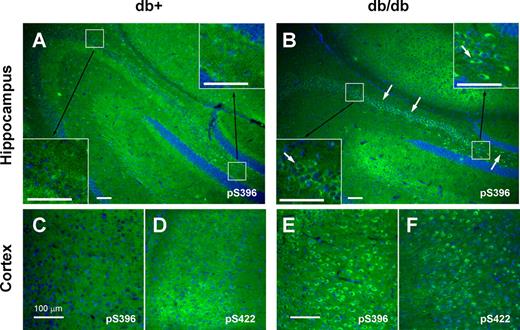
Tau phosphorylation is increased at multiple sites in 24-wk-old db/db mouse brain. Brain slices from db+ (A, C, and D) and db/db (B, E, and F) mouse are stained with antibodies against phosphorylated tau (green) at Ser396 (pS396; A, B, C, and E) or Ser422 (pS422; D and F) and DAPI for nuclear staining (blue). Arrows indicate the increased tau staining in db/db brains in both hippocampus (A and B) and cortex (C–F). Insets show the increased tau phosphorylation in each hippocampal region in higher magnification. Bar, 100 μm.
Tau cleavage as well as tau hyperphosphorylation play important roles in the progression of AD (12–14). Therefore, we next examined the possibility of tau cleavage in db/db mouse brains. When the lysates from the cortex and hippocampus of db/db mice were immunoblotted with TauC3 antibody detecting tau cleaved at Asp421, there was an age-dependent increase in tau cleavage in db/db mice, starting as early as 8 wk (Fig. 3). In 16- and 24-wk db/db mouse brain, we also observed a smaller cleavage product around 25 kDa. These cleaved bands, however, were not detected in 2-wk-old brains. IHC of 24-wk brain also display the increased TauC3 immunostaining in the hippocampus CA2/CA3 region of db/db mice (Fig. 4).
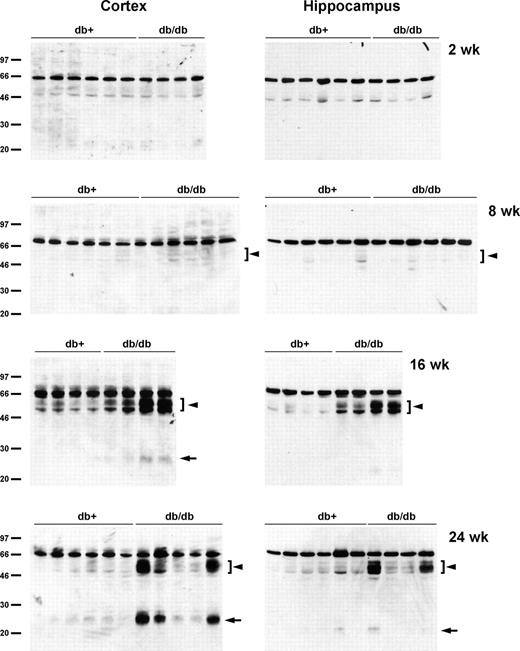
Increased expression of cleaved tau in older db/db mouse brain. The lysates of cortex or hippocampus from db+ and db/db mouse brains were immunoblotted with TauC3 antibody. There is an age-dependent increase of cleaved tau expression (arrowheads), including a smaller fragment around 25 kDa (arrows), in db/db mouse brains.
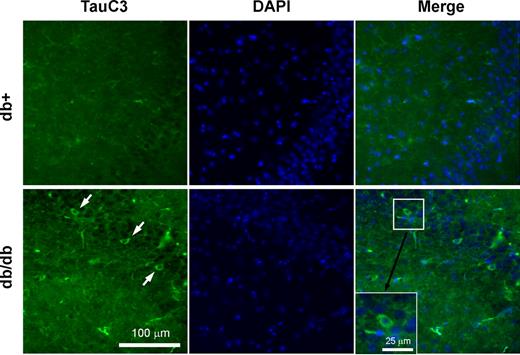
Increased TauC3 immunostaining in 24-wk-old db/db mouse hippocampus. Brain slices from 24-wk-old db+ and db/db mice were processed for IHC using TauC3 antibody detecting cleaved tau (green). Nuclei are stained with DAPI (blue). Arrows indicate TauC3-immunopositive cells in db/db mouse hippocampus. Bar, 100 μm.
Tau phosphorylation, but not cleavage, is increased in STZ-injected type 1 diabetes mouse model
Type 1 diabetic patients also develop diminished cognitive performance (3). Therefore, we next examined whether similar changes in tau are occurring in type 1 diabetic mice. C57BL/6J mice were injected with STZ at 12 wk and euthanized 12 wk later. The low-dose STZ group was injected with 50 mg/kg STZ for 5 consecutive days, and the high-dose STZ group received a single injection of 150 mg/kg STZ. At 24 wk, both low-dose STZ (25.21 ± 1.4 g) and high-dose STZ (25.19 ± 3.7 g) groups demonstrated decreased body weight compared with control (29.17 ± 2.5 g). Glucose levels were significantly higher (P < 0.0001) in both low (433.5 ± 89.1 mg/dl) and high (493.3 ± 81.4 mg/dl) STZ-injected groups compared with control (164.6 ± 29.5 mg/dl), whereas there was no difference between low- and high-dose STZ groups. Interestingly, insulin levels were not statistically different between control (1.83 ± 0.18 μU/ml) and low-STZ (2.01 ± 0.59 μU/ml) groups. Insulin levels from six of seven animals in the high-STZ group were below the detection limit (1.5 μU/ml; one mouse was 1.6 μU/ml).
In agreement with the published reports (15, 16), we detected increased tau phosphorylation in the high-dose STZ group at residues of Thr231 and Ser199/202 (Fig. 5, A and B). Despite increased glucose levels and frank diabetes, tau phosphorylation was not increased in the low-dose STZ group. The difference in tau phosphorylation at Ser396 did not reach statistical significance between control and high-dose STZ groups. IHC of the brains also indicated increased tau phosphorylation only in the high-dose STZ group but not in the control or low-dose STZ group (Fig. 5C). Tau phosphorylation in the db/db mice was accompanied with the increased tau cleavage. In contrast, we did not detect tau cleavage even in the high-dose STZ group (Fig. 5D), which displayed increased tau phosphorylation. These results suggest that the increased incidence of AD in type 1 and type 2 diabetes may be mediated by different mechanisms.
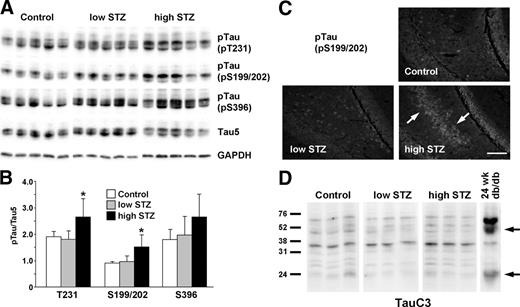
Tau phosphorylation, but not cleavage, is increased in STZ-injected animals. Mice were injected with STZ at 12 wk of age and killed at 24 wk (12 wk diabetes). The low-STZ group received 50 mg/kg STZ for 5 consecutive days, and the high-STZ group received one injection of 150 mg/kg. A, Cortex lysates are immunoblotted for the phosphorylated (pTau) and total tau. B, The densitometric analysis indicates significant increase in tau phosphorylation at pT231 and pS199/202 for the high-STZ group compared with control or low-STZ group. *, P < 0.01. C, Brain slices are stained with antibody against phosphorylated tau at Ser199/202 (pS199/202). Arrows indicate the increased tau staining in high-dose STZ brains. Bar, 50 μm. D, Cortex lysates are immunoblotted with TauC3 antibody to detect cleaved tau (arrows). GAPDH, Glyceraldehyde 3-phosphate dehydrogenase.
Discussion
Multiple studies report that patients with diabetes have an increased risk of developing AD compared with age- and gender-matched patients without diabetes (3–6). Diabetes and AD share many common characteristics including impaired insulin signaling, increased cholesterol levels, and increased incidence of metabolic disorders (20). Two of the most prominent pathological characteristics of AD are extracellular Aβ plaques and intracellular NFT composed of hyperphosphorylated tau. In this report, we present results strongly suggesting that tau dysregulation (phosphorylation and/or cleavage) may be the key factor leading to the increased incidence of AD in diabetic patients.
Both type 1 and type 2 diabetes are characterized by elevated blood glucose levels (23, 28), and hyperglycemia is associated with impaired cognitive performance (6). In addition, type 2 diabetes involves hyperinsulinemia and insulin resistance in the context of metabolic syndrome, which refers to a cluster of metabolic and vascular risk factors including obesity, dyslipidemia, hypertension, and inflammation (21, 29). In contrast, the major defect of type 1 diabetes (insulin-dependent diabetes mellitus) is insulin deficiency caused by autoimmune-mediated destruction of pancreatic β-cells (30). These differences may contribute to broader and severe learning and memory deficits in elderly type 2 diabetics compared with type 1 diabetics (3, 4, 6). Our results also demonstrate that type 2 diabetic mice display more severe tau pathology (increased tau phosphorylation and cleavage) compared with type 1 diabetic animals (less tau phosphorylation and no cleavage).
Our results demonstrate an age-dependent increase of tau phosphorylation in db/db mice that is not observed in control db+ mice. Our results are in agreement with several recent reports of AD-like changes in diabetic animal models. Peripheral hyperinsulinemia, which resembles type 2 diabetes, results in tau hyperphosphorylation in the rat brain (18). BB/Wor (type 1) and BBZDR/Wor (type 2) rats are spontaneous-onset diabetic animal models (19). These rats exhibit increased expression of amyloid precursor protein, β-secretase, and Aβ as well as hyperphosphorylation of tau, with more severe changes occurring in the type 2 animal model (31). Interestingly, a recent study by Masliah and colleagues (17) reports no changes in tau phosphorylation in db/db mice at 8 wk of diabetes. It is possible they did not examine Ser396 residues, which were the only phosphorylation sites to display significant differences at 8 wk in our study; alternatively, this discrepancy may be the result of a mouse strain difference. (They did not specify or mouse strain used in their report.)
In this report, we demonstrate for the first time that increased tau phosphorylation in type 2 diabetic mouse brain is accompanied with enhanced tau cleavage. Mounting evidence suggests that not only the hyperphosphorylation but also the cleavage of tau plays an important role in the progression of AD (12–14). Truncated tau induces apoptosis of cortical neurons in vitro (32) and, when expressed in transgenic animals, results in reduced spatial memory and impaired reflexes (33). In cultured embryonic cortical neurons treated with Aβ, tau cleavage precedes apoptosis (12). It is also reported that N- and C-terminal fragmentation induces toxic tau aggregation in N2a cells (34). It is still not clear whether tau hyperphosphorylation or cleavage occurs first (35, 36). Our results from db/db mice, however, suggest a temporal sequence of hyperinsulinemia/hyperglycemia, tau hyperphosphorylation, and eventual tau cleavage in diabetic animals. It is also suggested that tau phosphorylation occurs before the appearance of tau cleavage products in a mouse model of human tauopathy (37) and in hippocampal neurons undergoing Nerve Growth Factor withdrawal-induced apoptosis (38). We also noticed that tau cleavage in 24-wk db/db mice demonstrated high variability, whereas tau phosphorylation is more consistently observed. These results may suggest that tau cleavage might not be fully progressed at this age and thus results in more variability. In contrast, a recent report by Cotman and colleagues (35) suggest that tau cleavage is an early event in AD tangle pathology preceding hyperphosphorylation in the brains of transgenic animals and AD patients. Tau cleavage was not observed in STZ-injected mice, which display lower levels of tau hyperphosphorylation compared with db/db mice. Therefore, tau hyperphosphorylation combined with cleavage may contribute to the more severe tau pathology in type 2 diabetes animal brains.
Both type 1 and type 2 diabetic patients have up to twice the risk of developing AD (5, 39), and several lines of evidence implicate insulin signaling dysfunction in AD pathophysiology. Hyperglycemia and impaired insulin signaling are common features of AD and diabetes (40, 41). Insulin signaling plays critical roles in the metabolism of Aβ (42, 43) and tau (44–46). Therefore, abnormal insulin signaling affects the development of amyloid plaques and NFT and subsequent learning and memory deficits (47, 48). Insulin regulates tau phosphorylation in neuronal cultures (49, 50) and in vivo (44–46), thus influencing the development of NFT. Tau phosphorylation was increased at Ser396 and Ser202 residues in IGF-I-null mouse brain (44). White and colleagues (45) reported increased NFT containing hyperphosphorylated tau in the hippocampus of IRS-2 knockout mice, which shows the typical pathological signs of type 2 diabetes. Therefore, in diabetic conditions, impaired insulin signaling along with hyperglycemia may increase tau phosphorylation and subsequent cleavage. These changes may contribute to the increased risk of AD in diabetic patients.
In agreement with previous reports (15–17), STZ injection induces increased tau phosphorylation in the mouse brain. All previous studies investigating the effect of STZ on tau phosphorylation used a single high-dose injection. In this report, we administered STZ using two different methods: 50 mg/kg for 5 consecutive days or a single injection of 150 mg/kg. Interestingly, the effect of STZ on tau phosphorylation depends on the method of diabetes induction, even though both protocols induced hyperglycemia as well as weight loss and reduced motor and sensory nerve conduction velocity (51, 52), all hallmarks of type 1 diabetes. The only difference is the sustained insulin level in the low-dose STZ group compared with apparent lack of insulin in the high-dose STZ treatment. It has been reported that administration of insulin along with STZ prevented STZ-induced tau hyperphosphorylation (15, 16). Therefore, it is possible that the sustained insulin level in the low-STZ treatment group inhibited tau hyperphosphorylation. These results suggest that hypoinsulinemia, rather than hyperglycemia, plays a more important role in increased AD progression in type 1 diabetes.
In summary, our results suggest a new mechanistic link between increased susceptibility to AD and diabetes. We demonstrate using type 1 and type 2 diabetic mice that hyperglycemia (diabetic pathology) and tau modifications (AD pathology) are tightly correlated. In type 2 diabetes the combined effect of tau hyperphosphorylation and cleavage may contribute to more prominent AD-like progression. Given the expected dramatic rise in the number of both diabetic and AD patients and multiple recent studies demonstrating a clear increase in AD incidence in diabetic patients, it is imperative to study mechanistic aspects regarding the link between these two diseases. Understanding the mechanisms underlying the interaction of these two diseases will allow for drug development and lifestyle modifications aimed at treating and/or preventing diabetes and AD.
We greatly appreciate the helpful discussion from Dr. K. A. Sullivan.
This work was supported by grants from the Michigan Diabetes Research and Training Center (NIH 5P60-DK020572), Animal Models of Diabetic Complications Consortium (NIH U01-DK076160), the Taubman Institute, and the Program for Neurology Research and Discovery.
Disclosure Summary: The authors have nothing to disclose.
Abbreviations:
- Aβ,
β-Amyloid;
- AD,
Alzheimer’s disease;
- DAPI,
4′,6-diamidino-2-phenylindole;
- IHC,
immunohistochemistry;
- NFT,
neurofibrillary tangles;
- STZ,
streptozotocin.
Kim B, Oh A, Feldman EL, Hyperglycemia-induced tau cleavage in vitro and in vivo: a possible link between diabetes and Alzheimer’s disease. Program of the 91st Annual Meeting of The Endocrine Society, Washington, DC, 2009 (Abstract P2-435)
Amadoro G, Corsetti V, Ciotti MT, Florenzano F, Capsoni S, Amato G, Calissano P 21 July 2009 Endogenous Aβ causes cell death via early tau hyperphosphorylation. Neurobiol Aging 10.1016/j.neurobiolaging.2009.06.005
de la
