


Abstract
Whether prevalence and mortality of patients with heart failure with preserved or mid-range (40–49%) ejection fraction (HFpEF and HFmREF) are similar to those of heart failure with reduced ejection fraction (HFrEF), as reported in some epidemiologic studies, remains highly controversial. We determined and compared characteristics and outcomes for patients with HFpEF, HFmREF, and HFrEF in a prospective, international, multi-ethnic population.
Prospective multi-centre longitudinal study in New Zealand (NZ) and Singapore. Patients with HF were assessed at baseline and followed over 2 years. The primary outcome was death from any cause. Secondary outcome was death and HF hospitalization. Cox proportional hazards models were used to compare outcomes for patients with HFpEF, HFmrEF, and HFrEF. Of 2039 patients enrolled, 28% had HFpEF, 13% HFmrEF, and 59% HFrEF. Compared with HFrEF, patients with HFpEF were older (62 vs. 72 years), more commonly female (17% vs. 48%), and more likely to have a history of hypertension (61% vs. 78%) but less likely to have coronary artery disease (55% vs. 41%). During 2 years of follow-up, 343 (17%) patients died. Adjusting for age, sex, and clinical risk factors, patients with HFpEF had a lower risk of death compared with those with HFrEF (hazard ratio 0.62, 95% confidence interval 0.46–0.85). Plasma (NT-proBNP) was similarly related to mortality in both HFpEF, HFmrEF, and HFrEF independent of the co-variates listed and of ejection fraction. Results were similar for the composite endpoint of death or HF and were consistent between Singapore and NZ.
These prospective multinational data showed that the prevalence of HFpEF within the HF population was lower than HFrEF. Death rate was comparable in HFpEF and HFmrEF and lower than in HFrEF. Plasma levels of NT-proBNP were independently and similarly predictive of death in the three HF phenotypes.
Australian New Zealand Clinical Trial Registry (ACTRN12610000374066).
Introduction
The concept that both prevalence and mortality in patients with heart failure with preserved ejection fraction (HFpEF) are similar to those for those with HF with reduced ejection fraction (HFrEF) reflects epidemiological reports from Olmsted County, USA1 and Ontario, Canada2 published a decade ago. More recent epidemiologic trends in incident HFpEF from Olmsted County reinforced the perception of similar overall mortality (∼20% and ∼53% at 1 and 5 years respectively) in both HFpEF and HFrEF, and indicated no change in mortality over the last decade.3 However, an individual patient-level meta-analysis of studies found 3-year mortality rates were lower for those with HFpEF (25%) compared with those with HFrEF (32%), hazard ratio (HR) 0.68 [95% confidence interval (CI) 0.61–0.71].4 Of note, this meta-analysis did not include all studies of outcome in patients with HF, and in particular it did not include the epidemiologic studies from Olmsted1 and Ontario.2 There is continuing controversy regarding the true relative prevalence and mortality of HFpEF vs. HFrEF.
The higher mortality rates in retrospective epidemiologic studies compared to prospective clinical trials5 have been attributed to selection bias in trials that excluded patients with common serious comorbidities (e.g. renal disease) which may significantly impact mortality.6 Conversely, missing data (especially for EF7) and incomplete follow-up limited retrospective studies. Thus, there remains uncertainty regarding the relative prevalence and mortality and its clinical predictors in HFpEF vs. HFrEF. We sought to acquire prospective data with the primary aim to compare survival of patients with HFpEF vs. HFrEF in an international real world setting across diverse populations, using prospectively collected data with as little missingness and loss to follow-up as possible. Such data are critical for understanding the clinical course of, designing clinical trials for, and planning allocation of public health resources to, HFpEF around the globe.
Methods
Study methods have been reported in full,8 and are summarized here.
Study design and population
We conducted a prospective longitudinal study of adults with HF from New Zealand (NZ, four centres) and Singapore (six centres). All centres were university or public hospitals serving large proportions of the community. Patients were those over age 18 years with a clinical diagnosis of HF, according to the attending physician and verified by the site investigator according to 2012 European Society of Cardiology criteria.9 Recruitment occurred either where the patient was in hospital (NZ 70%; Singapore 61%) for a primary diagnosis of HF (assessment was done following stabilization of the acute HF) or in the outpatient setting (NZ 30%; Singapore 39%) within 6 months of an episode of decompensated HF (requiring hospitalization or treatment in an out-patient setting). Exclusion criteria included severe valve disease, transient acute pulmonary oedema in the context of primary acute coronary syndrome, end-stage renal failure, specific HF subgroups (including constrictive pericarditis, congenital heart disease, hypertrophic cardiomyopathy, cardiac amyloid, and chemotherapy-associated cardiomyopathy), isolated right HF, life-threatening co-morbidity with life expectancy <1 year and inability to provide consent.
Procedures
Patients were assessed at recruitment (baseline visit), clinic visits at 6 weeks and 6 months, and phone calls at 1 and 2 years. Importantly, all baseline measurements, including blood sampling, were performed when patients were assessed as stable and compensated and considered fit for discharge or ongoing outpatient management rather than in the acute decompensated state.
Clinical data
Clinical assessment at the study visits included collection of patient demographics, medical history, physical examination, and 12-lead electrocardiography.
Echocardiography
Comprehensive echocardiography was undertaken at each centre at baseline and 6 months, by experienced echocardiographers following a standardized protocol (American Society of Echocardiography guidelines). The average of three measurements was used for each variable. Left ventricular (LV) volumes were measured using the biplane method of disks (apical 4/2-chamber views), and left ventricular ejection fraction (LVEF) was derived. Left ventricular ejection fraction categories were determined based on quantitative LVEF (90.5% of patients), or, where this was not available and in descending hierarchy: qualitative LVEF (7%), M-mode (1.5%), and most recent prior echo (1%). Heart failure with preserved ejection fraction was defined as LVEF ≥ 50% or qualitatively ‘normal’ EF; HFmidrangeEF (HFmrEF) as LVEF 40–49%, and HFrEF as LVEF < 40% according to 2016 ESC Guidelines.10 Left ventricular diastolic parameters included mitral annulus tissue Doppler, trans-mitral to mitral annular early diastolic velocity ratio (E/e′), and left atrial volume (LAvol; biplane area-length method). Left ventricular and LA volumes were indexed to body surface area calculated using the Du Bois formula. Relative wall thickness (RWT) was calculated as (2*PWT)/LVEDD (PWT, posterior wall thickness and LVEDD, LV end-diastolic dimension).
Blood sampling
At baseline, 6 week and 6 month visits blood samples were drawn into EDTA tubes, spun and stored at −80°C and later assayed for N-terminal pro-B-type natriuretic peptide (NT-proBNP). Samples for routine clinical laboratory tests (creatinine, electrolytes, blood count) were collected at each visit for immediate analysis.
Outcomes
Patient follow-up was for 2 years for all-cause death and hospitalization for HF. Clinical outcomes were ascertained through direct phone calls to patients, access to local hospital, national hospital admission, and mortality databases.
Study size
The study was powered for the primary outcome comparison of death from any cause between HFpEF and HFrEF. A meta-analysis of previous studies comparing outcomes in HFpEF vs. HFrEF11 estimated an odds ratio of 0.56 (95% CI 0.48–0.66) from prospective and 0.74 (95% CI 0.70–0.78) from retrospective studies over an average of 2 years. An expected mortality rate of 35% at 2 years (observed in the control arms of the meta-analysis) in those with HFrEF was contrasted with a mortality rate of 27% at 2 years in those with HFpEF. The prevalence of HFpEF in the target population was estimated to vary between 25% and 35%. We assumed that only 25% of recruited patients will have HFpEF, this yielded a total sample size of 2394 patients (which included an allowance of 15% for loss to follow-up) of whom 598 would be expected to have HFpEF and yield statistical significance for a HR of at least 0.73 [assuming 90% power at the 5% significance level for a two sided log rank test with 65% survival vs. 73% survival for HFrEF and HFpEF, respectively PASS 2002 (Hintz, J, 2006). PASS Kaysville, UT, USA].
The first patient was recruited in March 2010, and study recruitment was stopped on 31 August 2014 when it was clear the mean follow-up of more than 2.5 years would provide sufficient clinical events to ensure adequate power for the major study endpoint with a sample of 2000 patients. The decision to stop recruitment was made blinded to the EF classification.
Statistical methods
Data from all sites were collected in standardized fashion and entered into a central electronic database maintained in Singapore. Data quality checks and statistical analyses were performed using SAS version 9.4 (SAS Institute Inc., Cary, NC, USA) in NZ and STATA in Singapore. Additional data quality control and consistency checks were performed on the final merged data set. Statistical tests are two-sided and a 5% significance level was maintained throughout the analyses. No adjustment for multiple comparisons was made for analyses addressing the primary objective. The baseline variables for the EF groups were compared using analysis of variance for continuous variables and the χ2 tests of proportions for categorical variables using exact methods where possible. Results were presented for the EF groups for the whole cohort and by country. Multiple linear regression was used to determine independent predictors of baseline NT-proBNP with log(NT-proBNP) as the dependent variable and incorporating variables chosen on the basis of expert clinical judgement: age, sex, history of hypertension and diabetes, aetiology (ischaemic or non-ischaemic), body mass index (BMI), New York Heart Association (NYHA) functional class, atrial fibrillation (AF), systolic blood pressure (BP), heart rate, log(creatinine), LVEDD/BSA, LAvol/BSA, and RWT.
Hospital admission and discharge on the same calendar day were not considered a hospital readmission. The rate of all-cause death at 2 years follow-up is reported as proportion dead at 2 years and deaths per 1000-patient years with 95% CI calculated using an exact MID-P method (www.openepi.com). Time to death was summarized using the standard Kaplan–Meier survival statistics for HFpEF, HFmrEF, and HFrEF in the total cohort and stratified by country. Mutivariable Cox proportional hazard models were used to estimate the adjusted hazard of HFpEF and HFmrEF compared to HFrEF for time to death. Covariates were selected a priori based on clinical relevance for this HF cohort, with checks for degree of missing data for each variable and when combined with other variables, and included: age, sex, history of hypertension, history of diabetes, aetiology (ischaemic or non-ischaemic), New York Heart Association functional class, AF, systolic BP, heart rate, left bundle branch block, log(creatinine), and log (NT-proBNP), and stratified by country. The correlation between scaled Schoenfeld residuals and length of follow-up were checked to ensure that there was no violation of the proportional hazards assumption for all analyses. Direct adjusted hazards functions were plotted.
Role of the funding source
The funders had no role in the study design, the collection, analysis, and interpretation of data, in the writing of the report or in the decision to submit the paper for publication. The first and corresponding author had full access to all data for this study and had final responsibility for the publication.
Results
Screening and recruitment
A total of 2039 patients were recruited, 1098 (54%) from six centres in Singapore and 941 from four centres in NZ. In NZ, 4789 patients were potentially eligible for the study, 869 were unable to provide informed consent, and a further 2979 met one or more of the study exclusion criteria, leaving 941 patients included in the study; in Singapore 4809 patients were potentially eligible for the study, 391 were unable to provide informed consent, and a further 3320 met one or more of the study exclusion criteria and thus 1098 patients were included in the study (Figure 1). In both countries, compared to potentially eligible patients at screening, recruited patients were younger [NZ: 69 standard deviation (SD 14) vs. 73 (SD 15) years; Singapore: 62 (SD 12) vs. 69 (SD 13) years] and more predominantly male (NZ: 70 vs. 56%; Singapore: 76 vs. 61%).
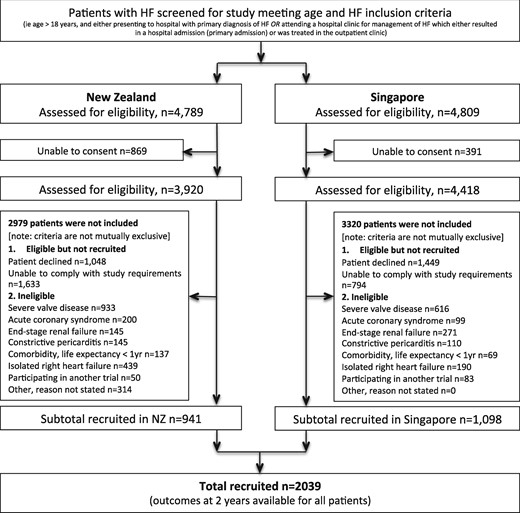
STROBE diagrams. Recruitment by country, and reasons for exclusion. HF, heart failure.
Definition of ejection fraction group
Echocardiographic data from the patients screened for the study showed that 31% had HFpEF [NZ 33% (1599/4789) and Singapore 28% (1345/4809)], 55% had LVEF < 50% and 14% had no prior echo data available. In those recruited, echocardiographic data was available for all patients at the baseline visit: 1845 (90.5%) had quantitative LVEF data, 148 (7.3%) semi-qualitative LVEF, 17 (0.8%) LV mode and for 29 (1.4%) a prior recent echo LVEF (Supplementary material online, Figure S1). In the entire recruited cohort, 574 (28%) patients had HFpEF [NZ 331 (35%); Singapore 243 (22%)], 256 (13%) had HFmrEF and 1209 (59%) had HFrEF [NZ 476 (51%); Singapore 733 (67%)].
Baseline clinical characteristics
Overall, mean age was 65 (SD 13) years, and 551 (27%) were women (Table 1). Compared to patients with HFrEF, those with HFpEF were older (mean age 72 vs. 62 years), more often female (48% vs. 17%), more likely to have a history of hypertension (78% vs. 61%) and AF (52% vs. 33%) and less often a history of coronary artery disease (CAD) (41% vs. 55%). Heart failure medications were commonly used at the time of the baseline assessment, with 1715 (84%) of the whole group receiving an angiotensin converting enzyme inhibitor (ACEI) or angiotensin receptor blocker (ARB) (78% in HFpEF, 86% in HFrEF), 1729 (85%) receiving a beta-blocker (79% in HFpEF, 88% in HFrEF), and 1849 (91%) a loop diuretic (86% in HFpEF, 93% in HFrEF). Functional status (NYHA class) and quality of life (Minnesota Living with Heart Failure score) were similar in HFpEF and HFrEF. Patients with HFpEF had slower heart rate (71 vs. 76 b.p.m.) and higher systolic BP (131vs.121 mmHg) compared to those with HFrEF.
Baseline characteristics
| HFpEF (LVEF ≥ 50%) | HFmrEF (LVEF 40–49%) | HFrEF (LVEF < 40%) | |
|---|---|---|---|
| N | 574 (28%) | 256 (13%) | 1209 (59%) |
| Age | 71.5 (11.8) | 65.8 (12.7) | 62.1 (13.2) |
| Women | 274 (47.7%) | 77 (30.1%) | 200 (16.5%) |
| Ethnicity | |||
| NZ European | 259 (45%) | 91 (36%) | 310 (26%) |
| Maori | 37 (6%) | 22 (9%) | 103 (9%) |
| Pacific | 20 (3%) | 16 (6%) | 47 (4%) |
| Chinese | 157 (27%) | 74 (29%) | 446 (37%) |
| Malay | 67 (12%) | 35 (14%) | 194 (16%) |
| Indian | 28 (5%) | 13 (5%) | 100 (8%) |
| Other | 6 (1%) | 5 (2%) | 9 (1%) |
| Medical history | |||
| Prior coronary artery disease | 236 (41%) | 134 (52%) | 662 (55%) |
| Prior myocardial infarction | 120 (29%) | 78 (39%) | 381 (42%) |
| Prior PCI | 81 (14%) | 53 (21%) | 226 (19%) |
| Prior CABG | 97 (17%) | 50 (20%) | 217 (18%) |
| Hypertension | 447 (78%) | 193 (75%) | 743 (61%) |
| Diabetes | 261 (45%) | 113 (44%) | 552 (46%) |
| Stroke | 78 (14%) | 32 (13%) | 148 (12%) |
| COPD | 118 (21%) | 54 (21%) | 171 (14%) |
| Heart failure history | |||
| Ischaemic aetiology | 250 (44%) | 137 (54%) | 697 (58%) |
| Prior HF hospitalization | 252 (44%) | 132 (52%) | 678 (56%) |
| HF device-therapies | |||
| ICD | 3 (1%) | 4 (2%) | 68 (6%) |
| CRT-D | 1 (0.1%) | 2 (0.8%) | 22 (1.8%) |
| CRT-P | 4 (0.7%) | 2 (0.8%) | 11 (0.9%) |
| AFa | 296 (52%) | 126 (49%) | 401 (33%) |
| LBBB | 46 (8%) | 38 (15%) | 208 (17%) |
| Medications | |||
| ACE inhibitor/ARB | 78% | 88% | 86% |
| Beta-blocker | 79% | 83% | 88% |
| Loop diuretic | 86% | 90% | 93% |
| Spironolactone | 13% | 32% | 51% |
| Anticoagulant | 30% | 29% | 26% |
| Antiplatelet | 40% | 42% | 37% |
| Statin | 70% | 75% | 73% |
| Total medications, n | 7 (6, 9) | 7 (6, 9) | 8 (6, 9) |
| Clinical status | |||
| NYHA class, % in Classes 1–IV | 19/54/22/3 | 20/57/18/4 | 23/50/22/4 |
| MLWHF score | 36.5 (22.5) | 37.7 (25.8) | 39.1 (24.7) |
| Heart rate (b.p.m.) | 71 (13.3) | 73 (13.0) | 77 (14.3) |
| Systolic BP (mmHg) | 130 (22.0) | 129 (24.7) | 119 (20.1) |
| Diastolic BP (mmHg) | 71 (12.1) | 73 (13.7) | 71 (12.5) |
| Laboratory variables | |||
| Creatinine (μmol/L) | 106 (84, 140) | 101 (84, 133) | 105 (87, 132) |
| Sodium (mmol/L) | 139 (137, 141) | 139 (138, 142) | 139 (137, 141) |
| Haemoglobin (g/dL) | 123 (110, 138) | 132 (120, 144) | 136 (122, 148) |
| NT-proBNP (pg/mL) | 1184 (482, 2441) | 1532 (627, 2784) | 2358 (1193, 5056) |
| Echo data | |||
| LVEDVi (mL/m2) | 48 (38, 63) | 68 (55, 85) | 93 (73, 114) |
| LVESVi (mL/m2) | 20 (14, 26) | 38 (31, 47) | 67 (52, 87) |
| LVEF (%) | 60 (56, 64) | 44 (42, 46) | 26 (20, 32) |
| LAvoli (mL/m2) | 44 (31, 59) | 43 (32, 57) | 46 (35, 60) |
| E/e′ average | 13 (10, 16) | 14 (10, 18) | 16 (13, 21) |
| Number of deaths | 80 (14%) | 30 (12%) | 233 (19%) |
Values are mean (SD) or median (25% and 75% quartiles).
ACE, angiotensin converting enzyme inhibitor; AF, atrial fibrillation; ARB, angiotensin receptor blocker; BP, blood pressure; CABG, coronary artery bypass grafting; CAD, coronary artery disease; CRT, cardiac resynchronization therapy; E/e′, mitral Doppler early velocity/mitral annular early velocity; HF, heart failure; ICD, implantable cardiac defibrillator; LAvoli, left atrial volume index; LVEDVi, left ventricular end-diastolic volume index; LVEF, left ventricular ejection fraction; LVESVi, left ventricular end-systolic volume index; MI, myocardial infarction; MLWHF, Minnesota Living with Heart Failure; NYHA, New York Heart Association functional class; PCI, percutaneous coronary intervention.
Atrial fibrillation determined from either baseline ECG or if a history of AF.
The clinical characteristics of the patients with HFmrEF were similar to the HFpEF group, except for age (66 years), proportion of women (30%) and history of coronary artery disease, which were similar to HFrEF (Table 1). When compared with patients in the NZ cohort, those in Singapore were younger, had a higher prevalence of hypertension, diabetes, and ischaemic aetiology. However, similar differences were seen in these characteristics between the EF phenotypes within each country (Supplementary material online, Table S1).
Echocardiographic characteristics according to ejection fraction phenotype
Median (25th, 75th percentile) LVEF was 60% (56%, 64%) among patients with HFpEF, 44% (42%, 46%) among those with HFmrEF and 26% (20%, 32%) among those with HFrEF. Patients with HFpEF had smaller indexed LV end-diastolic volume [median 48 (38, 63) mL/m2 vs. 93 (73, 114) mL/m2], and smaller LV end-systolic volume [20 (14, 26) mL/m2 vs. 67 (52, 87) mL/m2], but similar LA volume [44 (31, 59) mL/m2 vs. 46 (35, 60) mL/m2] compared to those with HFrEF. Despite similar functional status, median E/e′ was lower in HFpEF than HFrEF [13 (10, 16) vs. 16 (13, 21): Table 1].
The echocardiographic characteristics of the patients with HFmrEF were intermediate between the HFpEF and HFrEF groups for LV volumes, but the median E/e′ was similar to that of the HFpEF patients (Table 1). There were no differences in LV size between Singapore and NZ and consistent differences were seen between EF phenotype within each country (Supplementary material online, Table S1). However, patients in NZ had larger LA size compared with those from Singapore.
Laboratory data
Creatinine, sodium, and haemoglobin were similar in the three EF groups (Table 1). Median (25th, 75th percentile) NT-proBNP was 1184 (482, 2441) pg/mL in HFpEF, 1532 (627, 2784) pg/mL in HFmrEF, and 2195 (1040, 4548) pg/mL in HFrEF (P < 0.001). Differences in NT-proBNP between these EF groups were consistent within Singapore and NZ (Supplementary material online, Table S1). The predictors of baseline NT-proBNP for the EF groups included age, AF, BMI, renal dysfunction, and LA size (Supplementary material online, Table S2). The major differences were that ischaemic aetiology, larger heart size, and higher HR were stronger predictors of high NT-proBNP in HFrEF than HFpEF; whereas the presence of higher SBP and RWT were more strongly associated with high NT-proBNP in HFpEF than HFrEF.
All-cause mortality
Data on death status was available for all patients. During 2 years of follow-up, 343 (17%) patients died from any cause [Singapore 161/1098 (15%); NZ 182/941 (19%)]. In the entire cohort, 80 (14%) patients with HFpEF died, 30 (12%) patients with HFmrEF and 233 (19%) patients with HFrEF (P = 0.0013). There were 75 (95% CI 60–93) deaths/1000-patient years in those with HFpEF, 63 (95% CI 43–88)/1000-patient years in those with HFmrEF and 109 (95% CI 96–124)/1000-patient years among those with HFrEF (P < 0.0001).
In the Cox proportional hazards model, including age and sex, patients with HFpEF and HFmrEF had lower mortality than those with HFrEF [HR 0.49 (95% CI 0.38–0.65: P < 0.0001) for HFpEF and 0.50 [95% CI 0.34–0.73: P = 0.0004) for HFmrEF; Table 2, Model 1, Figure 2A]. When age, sex, history of hypertension and diabetes, ischaemic aetiology, NYHA class, AF, SBP, HR, LBBB, and log(creatinine) were included, patients with HFpEF and HFmrEF remained at lower risk of death from any cause compared to those with HFrEF [adjusted HR 0.62 (95% CI 0.46–0.85: 0.003) for HFpEF and adjusted HR 0.55 (95% CI 0.36–0.84: P = 0.006) for HFmrEF; Table 2, Model 2]. However, the mortality difference between HFpEF, HFmrEF, and HFrEF was attenuated when logNT-proBNP was added to this model [HR 1.19 (95% CI 0.84–1.68: P = 0.33) for HFpEF and HR 0.77 (95% CI 0.49–1.20: 0.24) for HFmrEF; Table 2, Model 3]. Independent predictors of all-cause death were age, ischaemic aetiology, higher NYHA Class (III or IV), lower SBP, and higher NT-proBNP. When HF medications (ACEI/ARB, beta-blockers) were included in this latter model, beta-blockers were independently related to lower risk of death (HR 0.56, 95% CI 0.42–0.74; P < 0.0001). All results were consistent for both countries (Supplementary material online, Table S3) despite the differences in demographics and risk factors between Singapore and NZ.
Multivariable associations with outcomes
| Model 1 | Model 2 | Model 3 | |
|---|---|---|---|
| (Age and sex) | (+clinical variables) | (+clinical variables | |
| + NT-proBNP) | |||
| Variable | HR (95% CI) | HR (95% CI) | HR (95% CI) |
| All-cause mortality | |||
| HRrEF < 40% | 1 | 1 | 1 |
| HRmrEF 40–49% | 0.50 (0.34, 0.73) | 0.55 (0.36, 0.84) | 0.77 (0.49, 1.20) |
| HFpEF ≥ 50% | 0.49 (0.38, 0.65) | 0.62 (0.46, 0.85) | 1.19 (0.84, 1.68) |
| Age (years) | 1.05 (1.04, 1.06) | 1.04 (1.03, 1.05) | 1.02 (1.01, 1.03) |
| Female sex | 0.74 (0.57, 0.97) | 0.99 (0.74, 1.33) | 0.85 (0.63, 1.15) |
| Hypertension | 1.02 (0.78, 1.32) | 1.00 (0.76, 1.31) | |
| Diabetes | 1.00 (0.78, 1.29) | 1.08 (0.84, 1.40) | |
| Ischaemic etiology | 1.33 (1.03, 1.73) | 1.40 (1.07, 1.83) | |
| NYHA Class (III/IV) | 2.00 (1.58, 2.56) | 1.75 (1.37, 2.25) | |
| Atrial fibrillation | 1.21 (0.93, 1.56) | 1.15 (0.88, 1.50) | |
| Systolic BP (per 10 mmHg) | 0.88 (0.83, 0.94) | 0.88 (0.82, 0.94) | |
| Heart rate (per 10 b.p.m.) | 1.00 (0.92, 1.09) | 0.95 (0.87, 1.03) | |
| Left bundle branch block | 1.05 (0.78, 1.41) | 1.09 (0.80, 1.63) | |
| log creatinine | 2.19 (1.58, 3.03) | 1.14 (0.80, 1.63) | |
| log NT-proBNP | 1.84 (1.61, 2.10) | ||
| Combined all-cause death or HF hospitalization | |||
| HRrEF < 40% | 1 | 1 | 1 |
| HRmrEF 40–49% | 0.87 (0.71, 1.08) | 0.95 (0.75, 1.19) | 1.09 (0.85, 1.40) |
| HFpEF ≥ 50% | 0.66 (0.55, 0.79) | 0.77 (0.63, 0.94) | 1.13 (0.90, 1.40) |
| Age (years) | 1.02 (1.02, 1.03) | 1.01 (1.01, 1.02) | 1.00 (1.00, 1.01) |
| Female sex | 0.82 (0.69, 0.97) | 1.01 (0.84, 1.21) | 0.92 (0.77, 1.11) |
| Hypertension | 1.11 (0.94, 1.33) | 1.13 (0.95, 1.35) | |
| Diabetes | 1.27 (1.09, 1.49) | 1.32 (1.20, 1.55) | |
| Ischaemic aetiology | 1.30 (1.10, 1.53) | 1.30 (1.10, 1.54) | |
| NYHA Class (III/IV) | 1.68 (1.43, 1.98) | 1.59 (1.34, 1.87) | |
| Atrial fibrillation | 1.18 (0.99, 1.00) | 1.12 (0.94, 1.33) | |
| Systolic BP (per 10 mmHg) | 0.95 (0.91, 0.98) | 0.95 (0.91, 0.98) | |
| Heart rate (per 10 b.p.m.) | 1.03 (0.98, 1.09) | 1.00 (0.95, 1.06) | |
| Left bundle branch block | 1.17 (0.95, 1.43) | 1.19 (0.97, 1.47) | |
| log creatinine | 1.86 (1.53, 2.27) | 1.31 (1.06, 1.63) | |
| log NT-proBNP | 1.41 (1.30, 1.52) | ||
NYHA, New York Heart Association functional class.
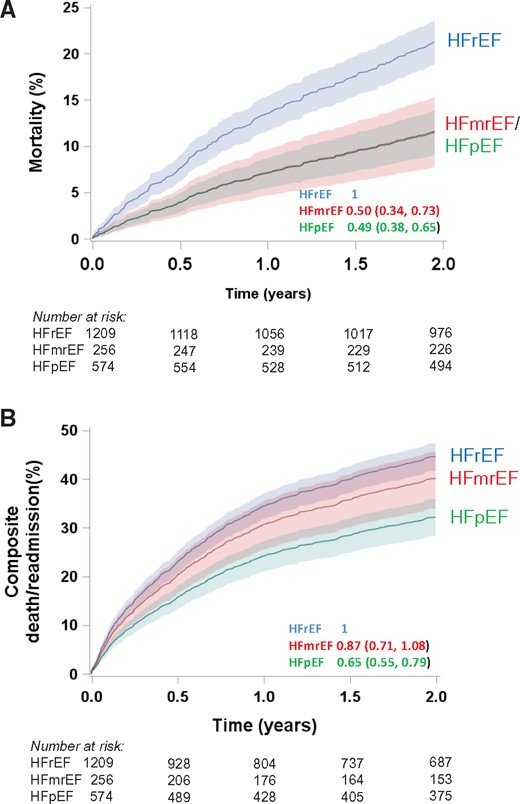
Hazards plots for heart failure with preserved ejection fraction, heart failure with mid-range ejection fraction, and heart failure with reduced ejection fraction. (A) All-cause mortality adjusted for age and sex and (B) All-cause mortality or heart failure hospitalization adjusted for age and sex. Data for curves represent cumulative mortality with shading representing 95% confidence intervals.
Adjusting for age and sex, logNT-proBNP was strongly associated with all-cause mortality regardless of EF group (HR 1.85, 95% CI 1.65–2.07; P < 0.0001). Across NT-proBNP quartiles the risk of death increased (Figure 3), and there was no evidence of an interaction in survival between logNT-proBNP and EF subgroup (P = 0.69).
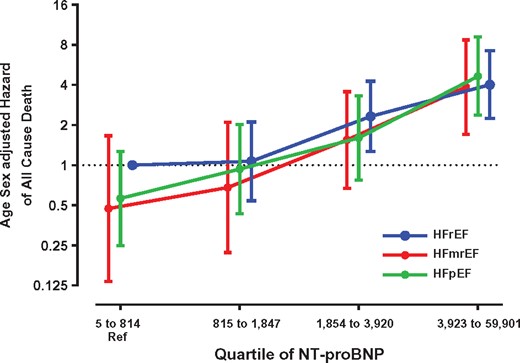
All-cause death by quartiles of N-terminal pro-B type natriuretic peptide at baseline. Adjusted for age and sex and using the lowest quartile of N-terminal pro-B type natriuretic peptide in heart failure with reduced ejection fraction as referent. HFmrEF, heart failure with mid-range ejection fraction; HFpEF, heart failure with preserved ejection fraction; HFrEF, heart failure with reduced ejection fraction.
Combined all-cause death and heart failure hospitalization
During 2 years of follow-up, 824 patients (40%) either died from any cause or were hospitalized for HF; 199 (35%) patients with HFpEF, 103 (40%) patients with HFmrEF and 522 (43%) patients with HFrEF. In the Cox proportional hazards model including age and sex, patients with HFpEF had lower risk of death or HF readmission than those with HFrEF or those with HFmrEF [HR for HFpEF 0.66 (95% CI 0.55–0.79; P < 0.0001), Table 2 Model 1, Figure 2B]. When age, sex, history of hypertension and diabetes, aetiology (ischaemic or non-ischaemic), NYHA class, AF, SBP, HR, LBBB, and log(creatinine) were included in the model, patients with HFpEF remained at lower risk of death or HF readmission compared to HFrEF or HFmrEF [HR 0.77 (95% CI 0.63–0.94; P = 0.0095) Table 2, Model 2]. However, when logNT-proBNP was added to the fully adjusted model there was no difference in the risk of death or HF readmission between patients with HFpEF, HFmrEF and HFrEF [adjusted HR for HFpEF 1.13 (95% CI 0.90–1.40; P = 0.38) Table 2, Model 3]. Independent predictors of death or HF readmission included diabetes, ischaemic aetiology, higher NYHA Class (III or IV), lower SBP, higher creatinine, and higher NT-proBNP. Adding medications (ACEI/ARB, beta-blocker) and history of prior HF hospitalization to the final model, patients with a prior history of HF hospitalization had a higher risk (HR 1.3, 95% CI 1.10–1.54, P = 0.0013), and those taking a beta-blocker at baseline a lower risk (HR 0.66, 95% CI 0.54–0.78, P < 0.0001) of death or HF readmission. Similar to the results for all-cause mortality, these results for the combined endpoint of death or HF readmission were consistent for both countires (Supplementary material online, Table S2).
Discussion
Our current prospective international data with complete EF assessment and follow-up, firmly establish that overall prevalence, mortality, and risk of HF readmission of HFpEF are lower than in HFrEF, even after adjusting for age, sex, and clinical covariates. Importantly, NT-proBNP is strongly and similarly related to survival in HF regardless of EF, and a given level of NT-proBNP portends the same risk of death in HFpEF, HFmrEF, and HFrEF. The primary determinant of cardiac synthesis and release of NT-proBNP is myocardial wall stress which, in accord with the Law of LaPlace, is directly related to the transmural pressure gradient and chamber diameter and inversely to wall thickness. Therefore the ‘drivers’ of a given elevation in NT-proBNP must differ in HFpEF vs. HFrEF. Accordingly, we find ischaemia and eccentric LV remodelling playing a stronger role in HFrEF, and increased RWT and afterload playing a stronger role in HFpEF. This implies that while clinicians may, in general, anticipate better outcomes in their patients with HFpEF compared to those with HFrEF, a high NT-proBNP level should alert them of high risk, and prompt a search for correctable drivers of the high NT-proBNP level. These findings are applicable in both Asian and Western settings. These findings also carry implications for designing therapeutic trials in HFpEF regionally and globally. Inclusion by natriuretic peptide levels will influence the power of trials for outcome results.
Previous studies of outcome in patients with heart failure with preserved ejection fraction
For many years, there has been uncertainty and controversy surrounding the clinical outcomes for patients with HFpEF compared with HFrEF. Ten years ago, two epidemiological studies from Olmsted1 and Ontario2 reported similar outcomes for patients with these two HF phenotypes. As other studies had shown conflicting results, a literature-based meta-analysis incorporating data from a large number of studies without EF inclusion criteria demonstrated that overall those patients with HFpEF had a lower risk of death than patients with HFrEF.11 Literature-based meta-analyses are limited by the requirement to aggregate overall study results and thus cannot adjust for potential confounders. The subsequent MAGGIC meta-analysis collated patient-level data from 31 studies, and reported that patients with HFpEF had lower risk of death from any cause compared with those with HFrEF independent of age, sex, and aetiology. However, the individual studies in this meta-analysis had inherent limitations including missing data (especially missing EF7), selection biases (e.g. hospitalized cases only) and data for NT-proBNP were not available. Our current, prospective data from a cohort recruited without EF entry criteria, with complete EF assessment, incorporating important risk factors, comorbidities and NT-proBNP and complete follow-up, firmly establish that prevalence and mortality are lower in HFpEF than HFrEF. Our consistent results in two different countries with different distributions of background risk factors (including for example, diabetes) and ethnicity, 5000 miles apart, is especially unique, and speaks to the robustness of our findings.
The cohort of patients in the current study is representative of patients in the community with HF, as by design the patient baseline assessment was undertaken following a period of stabilization for patients hospitalized with HF or following an exacerbation of HF that was managed without hospitalization. Consistent with this, clinical outcomes of this cohort are intermediate between those of previous clinical trials involving patients with HFpEF and studies involving patients with acute decompensated HF. For example, the death rates in the current study for patients with HFpEF were 75/1000-patient years: compared with 53/1000-patient years and 54/1000-patient years in CHARM-Preserved12 and I-PRESERVE,13 respectively, and 115/1000-patient years in patients with acute HF.14 Similarly, the NT-proBNP levels at baseline in the current study were intermediate between levels in acute HF and previous HFpEF trial cohorts (CHARM-Preserved and I-PRESERVE). Thus, the results from the current study are likely to be generalizable to patients with HF in the real world setting.
N-terminal pro-B-type natriuretic peptide and outcome in patients with heart failure with preserved ejection fraction
Numerous studies have reported the prognostic importance of NT-proBNP in patients with HFrEF, although fewer studies have reported on the relationship of NT-proBNP to outcomes in patients across the full range of LVEF in HF. The ICON study reported data from a pooled analysis involving patients assessed acutely in hospital for symptoms of breathlessness.15 Seven hundred and twenty of these patients had acute HF, of whom 293 had HFpEF (LVEF > 45%) and NT-proBNP was an independent predictor of death. The Korean HF Registry involved 3200 patients hospitalized with HF, 528 of whom had HFpEF (LVEF ≥ 50%), with 1-year follow-up.14 The risk of death increased linearly with increasing levels of NT-proBNP, with no interaction by EF group. Both the ICON Study15 and Korean Heart Failure Registry14 involved patients in the acute phase of decompensated HF, and the latter had limitations of missing data (32% missing NT-proBNP and 24% missing outcome data). A retrospective subgroup analysis from the COACH study, involving more stable outpatients with HF reported that at any given level of BNP the risk of death was similar for patients with HFpEF and HFrEF.16 Data from clinical trials in patients with HFpEF (PEP-CHF17 and I-PRESERVE18) have demonstrated that NT-proBNP is an independent prognostic marker in patients with HFpEF. N-terminal pro-B-type natriuretic peptide was not available in the prior Olmsted,1 Ontario,2 or MAGGIC4 studies. The current study has now extended these observations in this carefully characterized group of patients with HF, representative of those in the community, and clearly demonstrates that while the risk of death was lower for patients with HFpEF, the risk of death for any HF phenotype is similar at a given level of NT-proBNP.
The strong association between NT-proBNP and outcomes in HF regardless of EF is clinically important. NT-proBNP reflects LV wall stress, and is therefore expected to be lower in HFpEF than HFrEF on the basis of LaPlace’s Law. Yet, for a given level of NT-proBNP, prognosis for HFpEF was as poor as for HFrEF. NT-proBNP measurements thus provide a critical tool for clinicians to risk stratify their patients with HFpEF, whether in the stable situation,16 or the acute decompensated state.19 Notably, although risk of death at any given level of NT-proBNP was demonstrably the same for both HF phenotypes, the defining differences in ventricular morphology and therefore determinants of wall stress (the key determinant of NT-proBNP release20) in HFpEF vs. HFrEF necessarily mean the drivers of plasma NT-proBNP cannot be the same. The current data support these contentions, with the important findings that NT-proBNP related more strongly to different factors in patients with HFpEF (systolic BP and increased RWT) and HFrEF (ischaemic aetiology, LV size, and heart rate). This implies that clinicians facing patients with HF and high NT-proBNP should look at a wide range of indices according to the EF phenotype, not just the cardiac haemodynamics. While yet to be proven, addressing both haemodynamic and non-haemodynamic/non-cardiac factors may be especially important in HFpEF for the improvement of patient outcomes. Finally, these findings also carry implications for designing clinical trials in HFpEF, where inclusion by natriuretic peptide levels will clearly influence the power of the trial for outcome results.21
Heart failure with mid-range ejection fraction
The 2016 ESC HF guidelines10 drew renewed attention to the patients with LVEF between 40 and 49%, a grey area between HFrEF and HFpEF, so-called ‘HFmidrangeEF’ (HFmrEF). In this current study 13% of the patients had HFmrEF, similar to prior reports from a large MediCare population.22 Also similar to prior population-based reports from Sweden,23 patients with HFmrEF had similar burden of coronary artery disease as those with HFrEF but similar risk of all-cause death compared with those with HFpEF, although the combined risk of death or HF readmission for this group was similar to those with HFrEF.
Study limitations
There were lower proportions of patients with HFpEF than HFrEF in both the screened and recruited populations in Singapore compared with NZ in the current study. The patients in Singapore were younger than those in NZ, HFpEF is well described to occur more commonly among older patients, and it is likely that these differences in age account for the inter-country differences in proportions of patients with HFpEF and HFrEF in the current study. This is likely to be generalizable to patients with HF in Asia in general not just Singapore as contemporary data indicate patients with HF are younger in most Asia cohorts that in those from European countries.24 , 25 Thus, overall it can be expected that HFpEF will be less common in Asia than the West.
Potential for selection bias in recruited patients
Both the Olmsted1 and Ontario2 patient populations were older than the current study, particularly for HFrEF (HFrEF mean age 72 years in Olmsted/Ontario vs. 63 years in Singapore/NZ; HFpEF mean age 74–75 years in Olmsted/Ontario vs. 72 years in Singapore/NZ). While prospective recruitment using standardized protocols minimized missing data in our study, participation bias may have resulted in the relatively younger patient population. However the age differences in the screened vs. recruited patients in Singapore/NZ were small, and inclusion criteria were broad by design. Of note, despite younger age, the prevalence of comorbidities was either similar or higher (hypertension, diabetes) in our patients compared to the Olmsted/Ontario populations. The older age of both HFpEF and HFrEF groups, and restriction to acutely hospitalized HF, may explain the similar mortality in HFpEF and HFrEF in the prior studies. The MAGGIC meta-analysis showed that there was significant interaction between age and EF group on outcomes, where the difference in risk of death between HFpEF and HFrEF was smaller among older patients compared to younger patients.4 Furthermore, the difference in risk of death between HFpEF and HFrEF was smaller in hospitalized than in ambulatory patients.4 The potent prognostic impact of prior HF hospitalization in HFpEF26 may be relevant. We found a prior HF hospitalization was associated with worse outcomes in our study and was more frequent in HFrEF than HFpEF. While patients with ischaemic aetiology of heart failure were included we excluded patients who presented with transient acute pulmonary oedema due to a primary acute myocardial infarction (MI). This was to reduce the influence of the acute interventional management for acute MI at the time of the baseline assessment. These results cannot thus be generalized to the 14% of acute heart failure patients with acute MI.27 Data for HF devices (implantable cardiac defibrillator and/or cardiac resynchronization therapy) were available at baseline but some patients with HFrEF may have had devices implanted during follow-up after appropriate medical therapy.
We acknowledge that participation bias may have influenced our results. However the broad inclusion criteria, consecutive screening and nation-wide approach in both Singapore and NZ were efforts to minimize bias. The prospective design, low rate of missing data, and identical parallel protocols in NZ and Singapore including comprehensive echocardiography and measurement of circulating biomarkers, and the use of nationwide mortality/hospital admission registers for complete follow-up, are strengths of this study.
Conclusions
In conclusion, HFpEF and HFrEF represent important subgroups of patients with HF in this multi-ethnic contemporary population of patients with HF, with consistent characteristic phenotypes. Overall, and within two cohorts from differing geographic and ethnic backgrounds, the prevalence of HFpEF was lower than that of HFrEF. The risk of death from any cause was comparable in HFpEF and HFmrEF and lower than for HFrEF. The risk of death or HF hospitalization was lower for HFpEF than HFrEF or HFmrEF. Traditional risk factors, including age, aetiology, and clinical status, were associated with clinical outcomes in each EF phenotype. Plasma NT-proBNP related independently and similarly to risk of death in the three HF phenotypes, although the relative importance of a range of drivers of natriuretic peptide release differed between each of the HF phenotypes. These findings will inform projections of health care needs in heart failure and the design of therapeutic trials in HFpEF around the world.
Supplementary material
Supplementary material is available at European Heart Journal online.
Acknowledgements
We thank the clinical and research teams from the participating hospitals. New Zealand: University of Auckland and Auckland City Hospital (M. Copley, N. Earle, M. Fish, J. Hannah, G. Quill, M. Matthews, H. McGrinder, M. ter Bals); Middlemore Hospital (M. Oldfield, L. M. Pearce); Christchurch Heart Institute, University of Otago, Christchurch (L. Skelton, B. Neame, S. Rose); Waikato Hospital (R. Fisher, F. Bartley, A. Silverstone). Singapore: National University Hospital (C. S. P. Lam, A. M. Richards, L. H. Ling, R. C. C. Wong, P. Chai, K. K. Poh, C.F. Xu, N. F. M. Fadzillah); National University of Singapore (T. P. Ng, S. P. Chan, L. L. Gong, J. B. Lunaria, H. M. Hazli, T. Kwan, J. P. C. Chong, J.Y.X. Ng); Tan Tock Seng Hospital (D. P. S. Yeo, S. Y. Loh, F. F. Yin); Khoo Teck Puat Hospital (H. Y. Ong, B. Jeevith, L. Chen); Singapore General Hospital (F. R. Jaufeeraly, J. H. Chen); National Heart Centre Singapore (D. K. L. Sim, G. S. H. Lee); Changi General Hospital (G. K. T. Leong, W. Esa).
Funding
Singapore National Medical Research Council and NZ Health Research Council. National Medical Research Council, Singapore (Grant Number: R-172-003-219-511); A*STAR-NZ HRC (Grant Number: JGC 10_027); Clinician Scientist Award (CSPL); NZ Heart Foundation Project Grant, TM Hosking Trust (Auckland); Waikato Medical Research Foundation; HRC Programme Grant; New Zealand Heart Foundation Chair in Cardiovascular Studies (AMR); New Zealand Heart Foundation Chair of Heart Health (RND), Auckland Medical Research Foundation.
Conflict of interest: CSPL reports grants from National Medical Research Council Singapore, during the conduct of the study; grants from Clinician Scientist Award from the National Medical Research Council of Singapore; research support from Boston Scientific, Bayer, Thermofisher, Medtronic, and Vifor Pharma;, personal fees from consulted for Bayer, Novartis, Takeda, Merck, Astra Zeneca, Janssen Research & Development, LLC, Menarini, Boehringer Ingelheim and Abbott Diagnostics, outside the submitted work; RT reports personal fees from St Jude Medical, outside the submitted work;. Dr Doughty reports research support from NZ Heart Foundation, NZ Health Research Council, Auckland Medical Research Foundation, TM Hosking Trust (NZ), and Roche Diagnostics during the conduct of the study. G.D.G., L.H.L., D.S., K.T.G.L., H.Y.O., P.S.D.Y., F.J., T.P.N., V.A.C., K.P., M.L., G.D., and A.M.R. have no competing interests.
References
Author notes
The last two author are the co-senior authors.
See page 1781 for the editorial comment on this article (doi: )

