


Abstract
The differentiation of type 1 and type 2 myocardial infarction (T1MI, T2MI) is important, but challenging in the emergency department. We aimed to investigate the clinical characteristics and cardiovascular outcome of T2MI patients and to develop a clinical decision tool to differentiate T1MI and T2MI patients.
We prospectively enrolled 1548 patients with suspected MI. All patients were followed for up to 2 years to assess mortality. We used logistic regression with backward step-down selection to determine the most important predictors of T2MI. Based on these regression coefficients, we developed a diagnostic prediction model (score) to diagnose T2MI. T2MI was the final diagnosis of 99 patients. Patients with T2MI showed a high 1-year mortality rate (13.8%), which equals that of T1MI patients (9.4%). Female sex (Beta 1.27 [95% confidence interval; CI 0.67–1.90]), not having radiating chest pain (Beta 1.62 [CI 0.96–2.34]) and a baseline high-sensitivity troponin I concentration ≤ 40.8 ng/L (Beta 1.30 [CI 0.74–1.89]) were the strongest predictors for T2MI. Their combination resulted in an area under the curve of 0.71 to discriminate T1MI and T2MI. The binary score based on this model assigns one point to each of the predictors. Patients with the highest score value of 3 had a 72% probability of T2MI.
T2MI patients are a heterogeneous population with high-cardiovascular risk. A score based on laboratory and clinical parameters might help to differentiate T1MI and T2MI patients. The additional use of this score in clinical routine needs to be investigated prospectively.
www.clinicaltrials.gov (NCT02355457)
Introduction
Patients with suspected acute myocardial infarction (MI) account for approximately 10% of all emergency department (ED) patients.1,2 Those patients with MI are at high risk and require further diagnostic evaluation or invasive treatment. According to the current universal definition type 1 and type 2 MI (T1MI, T2MI) are differentiated based on the pathophysiological background.3 T1MI is defined by an acute coronary plaque disruption, while T2MI is defined by an imbalance of myocardial oxygen supply and demand. Those patients with T1MI usually require an urgent invasive approach to improve outcome.4 Patients with T2MI on the other hand reflect a heterogeneous population with various other causes of symptoms, and an early invasive approach might not only be not warranted, but even harmful in those patients. Therefore, differentiation of both MI types represents a clear clinical need.
The causes of T2MI include e.g. arrhythmias, cardiogenic shock, coronary spasm, and other causal factors. The prevalence of T2MI has been reported between 2 and 30% of all MI patients.5 As elevated troponin concentrations are essential for the diagnosis of T1MI as well as T2MI, it is not surprising that troponin measured by medium-sensitivity assays was not able to differentiate between both types.6 Nevertheless, the clinical characteristics differ as T2MI patients tend to be older, are more often females and have different symptoms compared to T1MI patients.7–9 Furthermore, earlier studies reported a poor outcome of T2MI patients with mortality rates of up to 50% after 4 years.9–12 The large Swedeheart register identified coronary artery disease (CAD) as an important determinant for T2MI since these were at highest risk for death and had more often cardiovascular comorbidities.10 Again, this highlights that differentiation of these two subtypes of MI is clinically important, but remains a challenging task for ED physicians or the consulting cardiologists.
Therefore, in the present article, we aim to investigate the clinical characteristics and the cardiovascular outcome of patients with T2MI in a large prospective cohort of patients with suspected MI. Furthermore, we aim to differentiate patients with T2 from T1MI patients based on available clinical findings in order to improve decision making for ED physicians.
Methods
Study population
Data from the Biomarkers in Acute Cardiac Care (BACC) study were used for the analyses. An earlier version of this study population has been published before.13,14 In the present analyses, we had data of 1641 patients who presented with suspected MI to the ED of the University Heart Center Hamburg. The enrolment took place between 19 July 2013 and 10 April 2016. Patients were not included when the age was below 18 years or the patient was not able or willing to provide written informed consent. Patients with ST-elevation MI (n = 75) and with non-ST-elevation MI type 4 (n = 2) were excluded from the analyses. Sixteen patients were excluded due to missing hs-TnI values. The BACC study was approved by the local Ethics Committee and registered at www.clinicaltrials.gov (NCT02355457). The study design complied with the Declaration of Helsinki.
Study design
All patients with suspected MI were treated according to the current ESC Guidelines, including electrocardiogram (ECG), monitoring, serial measurement of high-sensitivity troponin T (hs-TnT, Elecsys®, Roche diagnostics) at admission and after 3 h as well as further imaging.2,15 Depending on the individual results, each patient was discharged or admitted for further treatment. Independently from clinical routine, hs-TnI was measured using the Architect immunoassay (Abbott Diagnostics, ARCHITECT i1000SR) at admission, after 1 and 3 h. This assay had a limit of detection at a concentration of 1.9 ng/L and a 10% coefficient of variation at a concentration of 5.2 ng/L.16 In the general population, the 99th percentile has been reported at 27 ng/L.17
An ECG was performed immediately after presentation to the ED and directly interpreted by the ED physician. The ECG interpretation and the clinical assessment are described in the Supplementary material online.
Adjudication of myocardial infarction diagnosis
The final diagnosis of each patient was determined by two physicians (J.T.N. and N.A.S.) separately. In cases of disagreement, a third cardiologist (D.W.) reviewed the case. The final diagnosis was based on all available clinical and imaging results, ECG and standard laboratory testing, including hs-TnT and creatinine. Adjudication was performed according to the ESC guidelines at least 30 days after the index admission.2,15 The diagnosis of MI was adjudicated, when evidence of myocardial necrosis and a clinical setting of myocardial ischaemia were present. Myocardial necrosis was defined by a hs-TnT concentration above the 99th percentile in combination with a significant change within 3 h (according to the ESC working group18). The differentiation between T1MI and T2MI based on the 2012 universal definition of MI3: Patients with acute plaque disruption (observed via angiography or clinically highly suspected) were classified as T1MI. Patients with other causes of symptoms (e.g. arrhythmias, severe hypertension, or acute decompensated heart failure) were classified as T2MI.
Outcome
All patients were followed after the index presentation. Overall 1638 of 1641 patients (99.8%) completed the follow-up. The follow-up was performed up to 2 years after admission and completed on the 31 of August 2016. The median follow-up time for death was 450 days. The assessment and definition of follow-up events are provided in the Supplementary material online.
Statistical analysis
Continuous variables were described as quartiles; categorical variables as absolute numbers and percentages. The Wilcoxon rank-sum (for continuous variables) or the χ2 (for categorical variables) test were employed for between-group comparisons.
Outcome
Survival curves for the non-MI, T1MI, and T2MI patients were produced using the Kaplan–Meier method. Survival curve differences were tested with the log-rank test. Hazard ratios for each adverse event (adjusted for age, sex, and CAD) were estimated using Cox regression.
Score development
The detailed score development is described in the Supplementary material online.
Results
Baseline characteristics
Out of 1548 patients with suspected MI, 188 were diagnosed with T1MI and 99 (34.5% of all MI) with T2MI (Table 1). The median age for the overall study population was 65 (25th and 75th percentile 51, 75) years, while patients with T2MI were significantly older than T1MI patients (69 vs. 72 years, P-value = 0.039). Patients with T2MI were more often female (48.5% vs. 28.2%, P-value < 0.001) and more likely to have atrial fibrillation (34.3% vs. 10.6%, P-value < 0.001). Not having a history of CAD (70.7% vs. 48.9%, P-value < 0.001), not presenting with typical radiating chest pain (82.7% vs. 56.1%, P-value < 0.001) and no pathological changes in echocardiography or ECG (43.8% vs. 30.3%, P-value = 0.034) were more common in T2MI patients compared to T1MI. The concentration of hs-TnI was lower in T2MI compared to T1MI patients. This effect was most pronounced 3 h after admission with a median hs-TnI concentration of 108.4 ng/L (30.3, 602.2) among T2MI patients compared to 505.3 ng/L (97.8, 2008.4, P-value < 0.001) among T1MI patients (Supplementary material online, Figure S1). Patients with T2MI underwent angiography in 38.3% (T1MI 86.7%, P-value < 0.001) and none of these patients received PCI. In T2MI patients undergoing angiography, 60.5% had only non-significant CAD or microvessel disease, while 10.5% had one-vessel disease, 7.9% two-vessel disease, and 21.1% had three-vessel disease (all non-obstructive, Supplementary material online, Table S1). The most common causes of T2MI (covering 74% of all cases) were severe hypertension, arrhythmias, and acute decompensated heart failure. The exact causes of T2MI are displayed in Supplementary material online, Table S2.
Baseline characteristics
| All (n = 1548) | T1MI (n = 188) | T2MI (n = 99) | P-value for T1MI vs. T2MI | |
|---|---|---|---|---|
| Age (years) | 65.0 (51.0, 75.0) | 69.0 (59.4, 76.0) | 72.0 (63.2, 78.0) | 0.039 |
| Female (%) | 561 (36.2) | 53 (28.2) | 48 (48.5) | <0.001 |
| BMI (kg/m2) | 26.1 (23.6, 29.4) | 26.7 (24.2, 30.0) | 26.1 (22.7, 28.7) | 0.042 |
| Hypertension (%) | 1050 (68.1) | 154 (82.4) | 77 (77.8) | 0.44 |
| Systolic blood pressure (mmHg) | 146.0 (130.0, 161.0) | 150.0 (132.2, 165.0) | 143.0 (119.7, 160.0) | 0.059 |
| Hyperlipoproteinaemia (%) | 609 (39.3) | 108 (57.4) | 40 (40.4) | 0.009 |
| Family history of CAD (%) | 282 (18.9) | 43 (23.8) | 14 (14.6) | 0.1 |
| History of MI (%) | 255 (16.5) | 55 (29.4) | 14 (14.1) | 0.006 |
| Diabetes (%) | 207 (13.5) | 42 (22.5) | 12 (12.1) | 0.049 |
| No history of CAD (%) | 1018 (65.8) | 92 (48.9) | 70 (70.7) | <0.001 |
| Former smoker (%) | 462 (29.9) | 61 (32.4) | 28 (28.3) | 0.55 |
| Current smoker (%) | 357 (23.1) | 52 (27.7) | 17 (17.2) | 0.067 |
| Atrial fibrillation (%) | 271 (17.5) | 20 (10.6) | 34 (34.3) | <0.001 |
| Congestive heart failure (%) | 231 (14.9) | 36 (19.1) | 25 (25.3) | 0.29 |
| Haemoglobin (g/dL) | 13.8 (12.8, 14.8) | 13.9 (12.8, 14.8) | 13.7 (12.6, 14.7) | 0.34 |
| eGFR (mL/min for 1.73 m2) | 76.9 (58.6, 92.5) | 69.5 (50.2, 83.0) | 62.8 (49.4, 79.2) | 0.23 |
| No radiating chest pain (%) | 1109 (72.3) | 105 (56.1) | 81 (82.7) | <0.001 |
| No pathological echo or ischaemic ECG (%) | 982 (64.1) | 57 (30.3) | 42 (43.8) | 0.034 |
| hs-TnI 0 h (ng/L) | 6.4 (2.9, 17.1) | 116.1 (25.9, 1040.9) | 24.6 (10.9, 159.2) | <0.001 |
| hs-TnI 1 h (ng/L) | 6.5 (2.9, 21.0) | 276.3 (53.0, 1325.0) | 49.0 (19.4, 253.8) | <0.001 |
| hs-TnI 3 h (ng/L) | 7.8 (3.4, 25.9) | 505.3 (97.8, 2008.4) | 108.4 (30.3, 602.2) | <0.001 |
| Angiography (%) | 377 (24.4) | 163 (86.7) | 38 (38.4) | <0.001 |
| PCI (%) | 175 (11.3) | 126 (67.0) | 0 (0) | <0.001 |
Displayed are the baseline characteristics for all patients and the subcategories of T1MI and T2MI patients. The P-value is given for the comparison of T1MI and T2MI patients.
MI, myocardial infarction; T1MI, type 1 myocardial infarction; T2MI, type 2 myocardial infarction; BMI, body-mass-index; CAD, coronary artery disease; eGFR, estimated glomerular filtration rate; hs-TnI, high-sensitivity troponin I; h, hour; ECG, electrocardiogram; PCI, percutaneous coronary intervention.
When comparing non-MI and T2MI patients, those with T2MI were significantly older (72 vs. 63 years, P-value < 0.001), more often female (36.5 vs. 48.5%, P-value = 0.023), had more often hypertension (65.3 vs. 77.8%, P-value = 0.015), congestive heart failure (13.5 vs. 25.3%, P-value = 0.002), atrial fibrillation (17.2 vs. 34.3%, P-value < 0.001) and worse renal function (estimated glomerular filtration rate 79.6 vs. 62.88 mL/min for 1.73 m2, P-value < 0.001) (Supplementary material online, Table S1). All serial troponin concentrations were significantly higher for T2MI compared to non-MI patients.
Outcome
The events of death, incident MI, PCI, and cardiac rehospitalization were documented for non-MI, T1MI, and T2MI patients separately (Figure 1). The unadjusted 1-year mortality rate was higher for T1MI and T2MI patients compared with non-MI patients (4.1% for the latter vs. 9.4% and 13.8%, respectively), while the difference between T1MI and T2MI was not statistically significant. There were no incident MIs in T2MI patients and only one PCI within the follow-up period. In non-MI patients, the unadjusted rates of incident MI were 0.6% and 3.7% for PCI. Both events were most common in T1MI patients with an unadjusted event rate of 3.9% (MI) and 12.0% (PCI). Adjustment for age, sex, and history of CAD did not change the magnitude and direction of the reported differences in event rates (Supplementary material online, Table S3). Cardiac rehospitalization within 1 year after admission occurred in 18.8% of non-MI, 19.3% of T2MI, and 33.8% of T1MI patients (significantly higher for T1MI vs. T2MI in the unadjusted model with P = 0.025, but not significant after adjustment for age, sex and CAD).
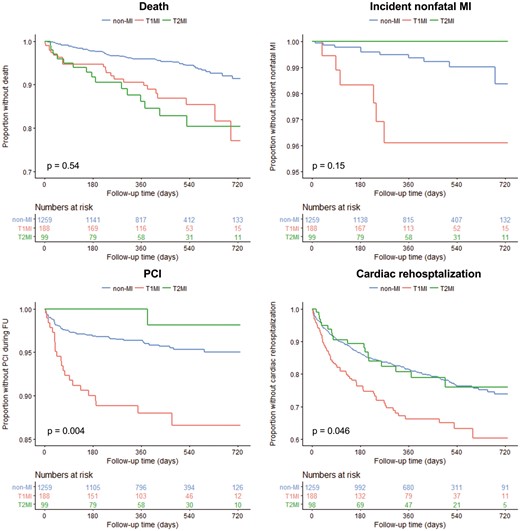
Outcome of non-MI, T1MI, and T2MI patients. Kaplan–Meier curves for the end points death, incident non-fatal MI, PCI, and cardiac rehospitalization are displayed for a follow-up period of 2 years. Below the Kaplan–Meier curve, the number of individuals at risk is provided. The P-value compares T1M1 and T1M2. T1M1, type 1 myocardial infarction; T1M2, type 2 myocardial infarction.
The exact cause of death, the duration until death, and the initial maximum cardiac biomarkers of T2MI patients are displayed in Supplementary material online, Table S4. Importantly, there were only two cases of a cardiac origin of death (both heart failure), while most other cases were caused by cancer and respiratory failure.
Score development
In order to distinguish T2MI from T1MI patients, a logistic regression model was developed. The optimal hs-TnI cut-off concentration, derived from an receiver operating characteristic (ROC) curve, was ≤ 40.8 ng/L for the 0-h sample, ≤ 68 ng/L for 1 h and ≤ 330.9 ng/l for 3 h (Supplementary material online, Figure S2). In the univariable logistic regression model, female sex (AUC 0.60 [CI 0.54–0.66]), hyperlipoproteinaemia (AUC 0.59 [CI 0.53–0.65]), history of MI (AUC 0.58 [CI 0.53–0.62]), atrial fibrillation (AUC 0.62 [CI 0.57–0.67]), not having typical radiating chest pain (AUC 0.63 [CI 0.58–0.68]), not having a history of CAD (AUC 0.61 [CI 0.55–0.67]), and hs-TnI concentrations at baseline, after 1 or 3 h were the strongest predictors for T2MI (Figure 2). In the multivariable logistic regression model, female sex (Beta 1.27 [CI 0.67–1.90], not having typical radiating chest pain (Beta 1.62 [CI 0.96–2.34]) and a baseline hs-TnI concentration ≤ 40.8 ng/L (Beta 1.30 [CI 0.74–1.89]) were selected as predictors for T2MI (Table 2). This model resulted in an AUC of 0.71, which was superior to each single variable alone (Figure 3, Supplementary material online, Table S5). The calibration of this model is displayed in Supplementary material online, Figure S3. These three variables (sex, angina, and troponin) of the multivariable model were transferred to a binary score with one point per variable (Figure 4). Patients with the highest possible score of 3 had a 72% probability of T2MI, while patients with a score of 0 had a 5% probability of T2MI. The diagnostic performance and the ROC curve of the binary score are displayed in Supplementary material online, Figure S4 and Supplementary material online, Table S6.
Multivariable logistic regression for the differentiation of T1MI vs. T2MI
| Beta (95% CI) | OR (95% CI) | P-value | |
|---|---|---|---|
| Female sex | 1.27 (0.67, 1.90) | 3.57 (1.96, 6.67) | <0.001 |
| No radiating chest pain | 1.62 (0.96, 2.34) | 5.08 (2.62, 10.43) | <0.001 |
| Baseline hs-TnI ≤ 40.8 ng/L | 1.30 (0.74, 1.89) | 3.68 (2.10, 6.61) | <0.001 |
| Beta (95% CI) | OR (95% CI) | P-value | |
|---|---|---|---|
| Female sex | 1.27 (0.67, 1.90) | 3.57 (1.96, 6.67) | <0.001 |
| No radiating chest pain | 1.62 (0.96, 2.34) | 5.08 (2.62, 10.43) | <0.001 |
| Baseline hs-TnI ≤ 40.8 ng/L | 1.30 (0.74, 1.89) | 3.68 (2.10, 6.61) | <0.001 |
Provided is the logistic regression for T2MI as the dependent variable. The predictors were chosen via backward step-down selection (using total residual AIC as the stopping rule).
MI, myocardial infarction; T1MI, type 1 myocardial infarction; T2MI, type 2 myocardial infarction; OR, odds ratio; CI, confidence interval.

AUC of the logistic regression for differentiation of T1MI vs. T2MI. Presented is the unadjusted AUC for selected variables in order to differentiate T1MI from T2MI patients. MI, myocardial infarction; T1MI, type 1 myocardial infarction; T2MI, type 2 myocardial infarction; OR, odds ratio; CI, confidence interval; SD, standard deviation; CAD, coronary artery disease; eGFR, estimated glomerular filtration rate; ECG, electrocardiogram.
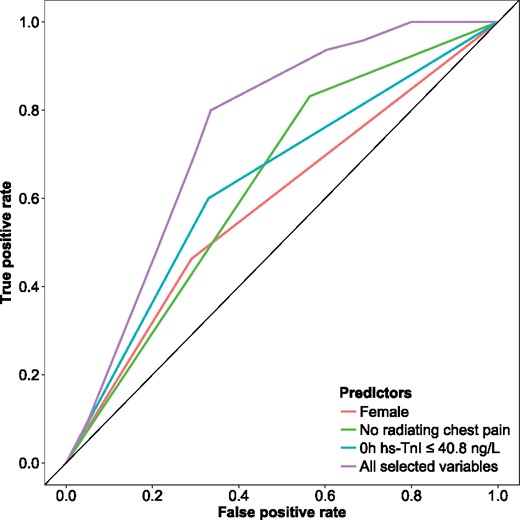
Receiver operating characteristic curve for the multivariable logistic regression model. The receiver operating characteristic curve to predict type 2 myocardial infarction is displayed for each of the most important predictors and the entire multivariable logistic model. These results are based on the fitted multivariable regression model.
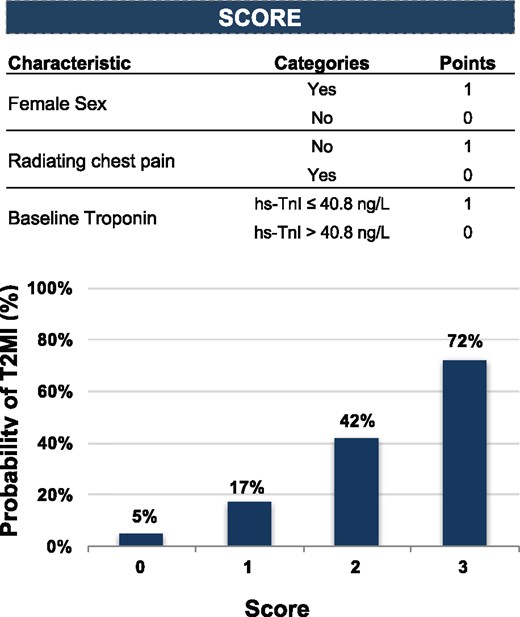
Performance and characteristics of the diagnostic model to predict the probability of T2MI. Score based on the most important predictors from the multivariable model and the related probability of T2MI. T2MI, type 2 myocardial infarction.
Discussion
In a large prospective study, we demonstrate that patients with type 2 myocardial infarction represent a heterogeneous population with high-cardiovascular risk. Furthermore, we were able to identify the most important predictors, which might help physicians to differentiate patients presenting with T2MI or T1MI (Figure 5).
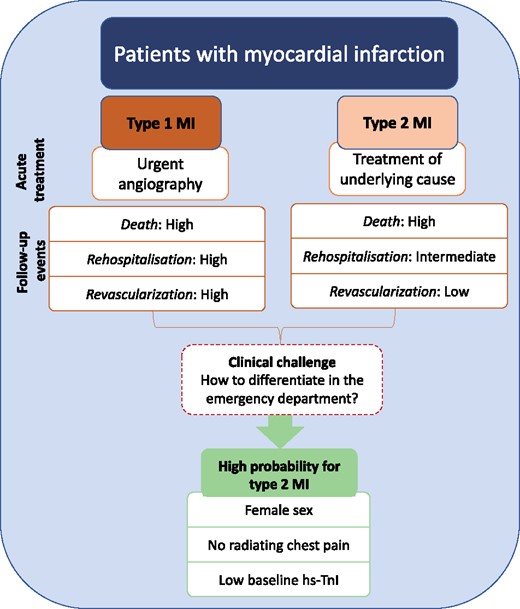
Central illustration of T1MI and T2MI patients. T1M1, type 1 myocardial infarction; T1M2, type 2 myocardial infarction.
Type 1 and type 2 myocardial infarction
Patients with suspected MI frequently present to the ED and require an early decision-making to either rule-out, rule-in, or observe.2 While the rule-out of MI based on high-sensitivity troponin provides a high level of confidence, there is less certainty regarding the rule-in of patients. Patients with symptoms suggestive of MI and dynamic changes of troponin would usually be grouped to rule-in and diagnosed with MI. The physician now should decide if an angiography needs to be performed, either urgently or electively. While this is recommended by current guidelines in most T1MI patients, urgent angiography might not be beneficial for T2MI patients. T2MI patients have heterogeneous causes of symptoms, which included arrhythmias, heart failure and severe hypertension in our study. Therefore, treatment of the underlying pathology is the primary goal of treatment in T2MI. As all patients present with symptoms of MI and have elevated troponin per definition of MI, the clinical differentiation is challenging. Earlier studies utilizing medium-sensitivity troponin were not able to differentiate between T1MI and T2MI based on this biomarker.6 Using high-sensitivity troponin assays, even lowest concentrations can be measured accurately.19 By utilizing a high-sensitivity troponin I assay, we could document distinct changes of troponin at admission, after 1 and 3 h for T1MI and T2MI patients. As expected, T2MI patients had lower hs-TnI concentrations. Nevertheless, a single cut-off resulted in an AUC of only 0.63. This shows that a single troponin cut-off is not able to differentiate between both entities. Therefore, we aimed to include additional clinical relevant parameters to identify T2MI patients. After multivariable selection, we identified female sex, typical radiating chest pain and a baseline hs-TnI ≤ 40.8 ng/L as the most important predictors. These parameters are easily accessible in the ED and can be obtained rapidly after admission. The combination of these parameters to a binary score improved the discrimination to an AUC of 0.71. These findings highlight that the distinction of T1MI and T2MI remains challenging even after this careful selection of diagnostic parameters. However, these identified predictors might help physicians to differentiate T1MI and T2MI patients.
What could be the clinical benefit of this differentiation? Patients with T2MI often have coexisting obstructive CAD10 and invasive angiography might be reasonable at some point in time. However, in our study only 38% of all T2MI patients underwent angiography and none received revascularization at the index admission or in the follow-up period. Therefore, T2MI patients should not undergo invasive strategies within the ED, but as discussed above require treatment of the underlying cause. In summary, we would emphasize the careful clinical evaluation of T2MI patients, which might (but not unalterable) include invasive angiography at some point in time. For T1MI patients, an urgent invasive strategy is clearly recommended. A high score could differentiate these different populations and identify T2MI patients.
Comparison to previous studies
Compared with previous studies, our study design differs significantly: prior studies with focus on T2MI were mostly performed in registers or cohorts with unselected determination of troponin.10,20 In the BACC study, we prospectively included only patients with suspected MI. These patients would be addressed in the ED setting in order to decide whether a patient should undergo early invasive diagnostics. This setting is important with regards to the causes of T2MI. Earlier studies included patients with severe infection or anaemia who had dynamic troponin changes. These populations are barely represented in the BACC study, where most causes for T2MI were cardiac related including heart failure, hypertension, and arrhythmias. Earlier studies reported very high-mortality rates for T2MI patients of up to 50% after 4 years. In our present study, we could not validate these high-mortality rates. Again, this might be explained by the preselection of patients with suspected MI. Nevertheless, T2MI patients had a mortality rate that was comparable to T1MI patients. Interestingly, most T2MI patients in our study died from cancer or respiratory failure and barely from cardiac reasons. These findings are in line with prior publications with focus on T2MI.21 Furthermore, in patients with suspected MI we could recently show, that hs-TnI concentrations between 6 and 27 ng/L were associated with a higher mortality rate, while cardiac causes of death were rare.22 Taken together, these findings highlight the predictive value of elevated troponin concentrations for future events. Elevated troponin concentrations without dynamic changes can be caused by various conditions including chronic heart failure, chronic kidney disease or stabile CAD.23 This is labelled as myocardial injury and also associated with poor outcome.9 The differentiation of T2MI and myocardial injury is challenging and there is substantial overlap for several conditions (e.g. acute and chronic heart failure or stable CAD with borderline stenosis and new onset atrial fibrillation). Therefore, this topic remains a matter of debate24–26 and needs to be addressed in future studies and guidelines.
Strengths and limitations
One strength of our study is that we prospectively included patients with suspected MI, who represent a clinically important population. The adjudication of the final diagnosis has been performed carefully and blinded by two physicians, which is another strength. Nevertheless, the exact definition of T2MI is crucial and challenging even after blinded adjudication. Therefore, some cases could have been misclassified. However, during the follow-up period no MI and only one PCI were observed for T2MI patients. This could indicate that no T1MI was falsely classified to be T2MI. Nevertheless, in future studies more detailed imaging results should be investigated for T2MI patients. A second limitation is that our results are specific for high-sensitivity troponin I and therefore limited to this assay. Finally, external validation of the developed point score is required in order to show the robustness of the model.
Conclusion
Patients with type 2 myocardial infarction are a heterogeneous population with high cardiovascular risk. The clinical differentiation of type 1 and type 2 myocardial infarction is challenging, but might be improved using a binary score. The additional use of this score in clinical routine needs to be investigated prospectively.
Supplementary material
Supplementary material is available at European Heart Journal online.
Acknowledgements
The BACC study was supported by German Center of Cardiovascular Research (DZHK) and the German Heart Foundation/German Foundation of Heart Research.
Funding
This work was supported by an unrestricted grant by Abbott Diagnostics (no influence on the study). Furthermore, Abbott Diagnostics provided test reagents for high-sensitivity troponin I measurements.
Conflict of interest: S.B. has received honoraria from Abbott Diagnostics, Siemens, Thermo Fisher, and Roche Diagnostics and is a consultant for Thermo Fisher. The other authors have nothing to declare.
References
Author notes
See page 3521 for the editorial comment on this article (doi: )

