


Abstract
Domestication is a well-known example of the relaxation of environmentally based cognitive selection that leads to reductions in brain size. However, little is known about how brain size evolves after domestication and whether subsequent directional/artificial selection can compensate for domestication effects. The first animal to be domesticated was the dog, and recent directional breeding generated the extensive phenotypic variation among breeds we observe today. Here we use a novel endocranial dataset based on high-resolution CT scans to estimate brain size in 159 dog breeds and analyze how relative brain size varies across breeds in relation to functional selection, longevity, and litter size. In our analyses, we controlled for potential confounding factors such as common descent, gene flow, body size, and skull shape. We found that dogs have consistently smaller relative brain size than wolves supporting the domestication effect, but breeds that are more distantly related to wolves have relatively larger brains than breeds that are more closely related to wolves. Neither functional category, skull shape, longevity, nor litter size was associated with relative brain size, which implies that selection for performing specific tasks, morphology, and life history does not necessarily influence brain size evolution in domesticated species.
Introduction
Dogs were domesticated from a now-extinct line of the grey wolf at least 15,000 years ago (Frantz et al., 2016) and were used for various purposes (e.g., to provide meat or fur, to protect people, and to guard herds). Over 400 dog breeds have been described since domestication, and contemporary dog breeds are highly variable in size, shape, and behavior. This variation has been created through a variety of mechanisms including crosses among breeds, migration, geographic separation, and artificial selection (Mehrkam & Wynne, 2014; Parker et al., 2017). Primary breed types for some main purposes were developed during the early evolutionary history without formal breed recognition (Brassard et al., 2022; Horard-Herbin et al., 2014). However, contemporary breeds are the result of very recent selection (Thalmann et al., 2013), and the phenotypic divergence we observe today was caused by intensified breeding programs along strict breed standards in the last 160 years (Bergström et al., 2022). Recently, the relatedness due to common descent and admixture has been established among dog breeds based on genome sequence analyses, and we also have a relatively robust understanding of the phylogenetic age of different breeds (Parker et al., 2017). Accordingly, the large among-breed phenotypic variance with the reconstructed relatedness structure in dogs provides a unique opportunity for investigating the signatures of evolutionary processes occurring over a relatively short time period within a species.
Brain size evolution is expected to be a balance between positive selection from increased cognitive ability and energetic costs associated with “expensive tissues” (Aiello & Wheeler, 1995), which is supported by several phylogenetic comparative analyses across species (e.g., Garamszegi & Eens, 2004; Isler & van Schaik, 2009; Reader & Laland, 2002; Sayol et al., 2016; Sol et al., 2005). Domestication likely has consequences for brain evolution, as there is often a sharp decline in brain size in domesticated strains compared to their wild conspecifics (Kruska, 1988). This is the case across several different taxa, including fish (Marchetti & Nevitt, 2003), pigs (Kruska, 1970), cattle (Balcarcel et al., 2021), minks (Kruska, 1996), rodents (Kruska, 1975), and cats (Röhrs & Ebinger, 1978). Moreover, the effects are often quite dramatic, as in some cases, the difference between domesticated and wild populations is over 20% (Balcarcel et al., 2021). The reasons for the decline in brain size in domesticated animals are not yet entirely clear. But, candidate factors commonly mentioned in the literature include the release of selection pressure from predation, foraging, and mate choice, in combination with the great energetic costs associated with neural tissue (Aiello & Wheeler, 1995; Kruska, 1988), the lack of complexity in the captive environment (Näslund et al., 2012), and selection for docility (Wilkins et al., 2014).
However, not all domesticated animals are released from the selection on cognitive abilities. In these cases, the brain may show rapid evolutionary changes after domestication. Studies where the environment of captive-kept animals has been enriched, either with added physical or social complexity, have shown rapid positive plastic effects on cognitive abilities and brain morphology (Gonda et al., 2009; Nottebohm, 1981; Rosenzweig & Bennett, 1996). Moreover, in some species, certain breeds are under strong directional selection for behavioral characteristics. For example, there is strong directional selection for aggression in fighting breeds of cattle, chickens, and dogs (Kruska, 1988; Reid et al., 2022; Webster et al., 2014), homing abilities in pigeons (Mehlhorn & Rehkämper, 2009), and hunting and cooperation abilities in dogs (Morrill et al., 2022; Udell, 2022). These behavioral traits are sometimes associated with variations in absolute brain size (Horschler et al., 2019). Hence, it would be straightforward to perform analyses on relative brain size in domesticated species with substantial variation both in breed age (reflecting the genetic distance to the common ancestor) and in breed function. Such an approach would allow us to simultaneously investigate how brain size evolution varies temporally from early domestication to the present day and how breed-specific selection on function may influence brain size evolution. This was recently done in cattle, where Balcarcel and colleagues (2021) found support for certain breed functions being associated with larger brains. In particular, selection for more aggressive behavior was associated with larger brains relative to body size, while selection for more docile behavior was associated with smaller brains (Balcarcel et al., 2021). It is important to extend these analyses to other taxa, especially those with a larger number and broader diversity of breeds, to provide a general understanding of brain size evolution. While species like cattle are mainly used for consumption, dog breeds serve various functions that are associated with particular morphology (www.akc.com) and behavior (Kolm et al., 2020). Moreover, dogs are the most diverse domesticated species in terms of the number of different breeds, morphology, and behavior. Hence, a suitable next step in this research area is to investigate how different behavioral functions are linked to relative brain size in this group.
Another important suite of traits to consider in this context are life history traits. For example, litter size and longevity might be affected during selection in domesticated species (Hoffman & Valencak, 2020; Setchell, 1992), and these traits are highly relevant for brain size evolution. The high energy demands of evolving larger brains are associated with reproductive costs both at the inter- and intraspecific levels. For instance, larger brains are associated with reduced litter sizes in altricial mammals (Isler & van Schaik, 2009) and bird species (Jiménez-Ortega et al., 2020), and larger brains are associated with reduced fecundity in guppy (Poecilia reticulata) brain size selection lines (Kotrschal et al., 2013). While the negative association between brain size and litter size is relatively well-established, the link between brain size and longevity is more complex, and it is important to consider both intrinsic and extrinsic mortality when investigating this link (e.g., Jiménez-Ortega et al., 2020). At higher taxonomic scales, larger brains are generally associated with increased longevity (Allman et al., 1993; González-Lagos et al., 2010; Hofman, 1993; Minias & Podlaszczuk, 2017). Several explanations have been provided for this pattern, including factors like greater survival under predation threat (Sol et al., 2016), decreased pace-of-life (Barrickman et al., 2008), and more refined homeostatic control (Jiménez-Ortega et al., 2020). While similar studies at the intraspecific level are rare, a recent study on brain size selected guppies demonstrated an intrinsic cost of increased brain size on longevity. In this study, the predation threat was removed in a laboratory setting and individuals with larger brains had substantially shorter life spans (Kotrschal et al., 2019). This situation is the reality for most dog breeds, where predation pressure has been completely removed as individual dogs remain in the care of their owners. Life history is known to drastically differ among breeds (Careau et al., 2010), which allows hypotheses about associations between variation in longevity and fecundity and variation in relative brain size to be tested.
Here we investigate brain size evolution across a large dataset of over 150 contemporary dog breeds while controlling for body size, skull shape, and genetic relatedness. Our analyses are based on a new dataset constructed with CT-scan analysis of skulls to estimate brain cavity volume (Figure 1). We start by investigating brain size evolution and brain-body allometry among dog breeds in relation to the wolf while considering the genetic distance and haplotype sharing among breeds to control for non-independence due to artificial selection and breed crossing (Garamszegi et al., 2020). We predict a strong reduction in brain size in dogs compared to the wolf and that this reduction will be most evident in breeds closer to the root of the dog phylogenetic reconstruction. Next, we investigate if there is any link between functional breed category and brain size while controlling for body size and skull shape. We predict that brain size will be larger in functional breed categories such as Herding, Sporting, and Working breeds. We also predict that the increased costs associated with larger brains will yield a negative association with life history traits, litter size, and life span.
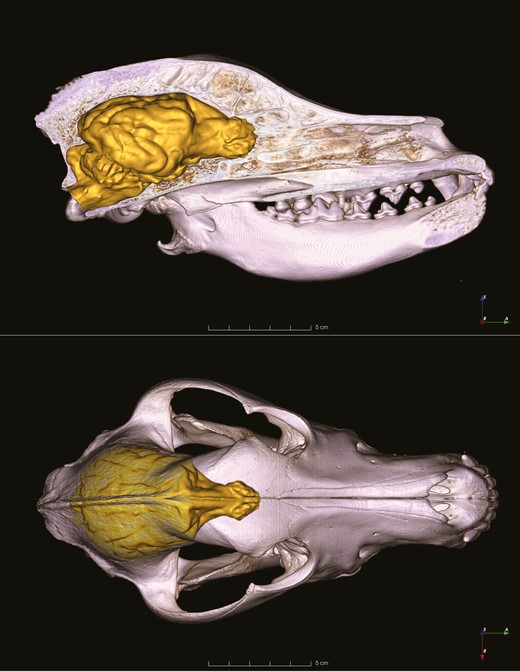
Volume-rendered skull model with the endocast representing the reconstructed brain as it is positioned in the skull of the Hungarian vizsla. Upper panel shows the midsagittal section from the right lateral view, lower panel shows the dorsal view of the skull, which was made transparent.
Methods
Brain volume data
We processed the collection of dog skulls that is maintained at the Department of Anatomy, Cell and Developmental Biology, Eötvös Loránd University (Budapest, Hungary). This private collection (owned by TC) is composed of specimens that have been obtained mostly in the last 10 years by the appropriate preparation of the heads of deceased dogs (which were donated post-mortem), from which the soft materials have been removed a priori. TC systematically collected the prepared skulls with the aim of having both male and female samples from as many breeds as possible. Breed identity was usually verified upon the collection of cadavers/skulls, given that these materials originate from known dog breeders. Alternatively, we checked the appropriate breed certificates/chips for pedigree. Currently, the collection consists of 383 individual skulls (including males, females, and unknown sexes) from 146 breeds. We selected 172 skulls (38 females, 83 males, and 50 unknown sexes) across all breeds represented in the collection for subsequent CT scan analysis (see Supplementary Table S1). Skulls were selected from adult individuals, which we verified using morphological characteristics (i.e., the presence of permanent teeth, as dogs should replace all baby teeth before 6–7 months of age). Although some skulls (and data from the literature) were available for mixed breeds, these were not considered in this study.
The selected skulls were transferred to the Institute of Diagnostic Imaging and Oncoradiology, Health Center of the University of Kaposvár (Medicopus Nonprofit Ltd., Hungary) for CT scanning. We used a Siemens Somatom Definition AS+ CT machine (Siemens, Erlangen, Germany) to digitalize the skulls with high resolution (170 mAs, 140 kV, pixel size 0.323 × 0.322 mm, slice thickness 0.6 mm, with a v80u bone kernel). The resulting DICOM image series were imported into the 3D Slicer software (freeware, www.slicer.org), and using its segmentation and modeling tools, the endocranial volumes (=endocast) were reconstructed (see details in Czeibert et al., 2020). These endocasts reflect the surface morphology of the brain in such detail that external blood vessels and differences in gyrification can be observed (Figure 1). In parallel, we calculated the volume of the endocasts for further analysis (Czeibert et al., 2020) in this study.
We assessed the reliability of these brain volume estimates by comparing them to breed-specific assessments from the literature that are based on different approaches (Bronson, 1979; Comfort, 1960; Crile & Quiring, 1940; Davies & Morris, 1993; Elia, 1992; Hecht et al., 2019; Herre & Stephan, 1955; Jimenez, 2016; Latimer, 1942; Rzechorzek et al., 2019; Stone et al., 2016). The within-breed repeatability of brain volume when combining data from various sources was high (R = 0.767, CIlower/upper = [0.706, 0.813]). We also detected a strong correlation between brain volume and brain mass (r = 0.843, p < .001) indicating that brain size is a breed-specific attribute that can be reliably estimated from brain volume. The high repeatability suggests that any differences in relative brain size between sexes (or due to any within-breed variation) are negligible for the among-breed focus of the current study. Therefore, to maximize the sample size for our comparative analyses, we combined our endocast estimates with data from the literature and calculated breed-specific mean volumes. In this effort, we transformed brain mass data into brain volume data using the equation of the regression line fitted to the observed data for breeds: (log10(brain volume) = 0.201 + 0.892 * log10(brain mass)). Using this method, we could also include data from the “Canine Brain and Tissue Bank” (Sándor et al., 2021), in which wet brain weights (in grams) were available for 111 individuals belonging to 45 breeds. Altogether, we obtained brain volume estimates for 159 breeds based on 865 individual measurements (see breed-specific sample sizes in the Supplementary Table S2).
Information on body size was not available for most individuals in the skull collection. Therefore, we used breed-specific body mass data from the Fédération Cynologique Internationale (FCI, www.fci.be) and the American Kennel Club (AKC, www.akc.org) in our analyses. Note that breed-specific measures of body mass are highly consistent across different sources (the repeatability of log10-transformed body mass across different sources is R = 0.982 [95% CIlower/upper = 0.977/0.987]).
For some analyses, we included brain size data for the wolf (only adults were considered). These data were derived from our endocast analyses (skulls were available for N = 7 individuals) as well as from the literature (N = 48, Bauchot, 1985; Crile & Quiring, 1940; Damasceno et al., 2013; Gittleman, 1986; Grewal et al., 2020; Michaud et al., 2022; Röhrs & Ebinger, 1978; Smith et al., 2017; Spocter et al., 2018; Swanson et al., 2012). Given that many of the literature sources were vague about the origin of specimens (i.e., subspecies, captive vs wild, age, and sex), it was necessary to accept some undesirable within-species variation in both brain size and body size to obtain a reasonable sample size. However, we expect that this variation will only raise noise levels and not cause any biases in our study, and thus should not affect our main conclusions regarding the comparison of species-specific mean parameter estimates.
Functional category, longevity, litter size, and head shape
We investigated how relative brain size in dogs has evolved in relation to selection for different functions using the AKC breed group categorizations that reflect major functional differences. These seven groups are: the Herding Group (breeds used for their ability to control the movement of other animals), the Hound Group (breeds used mainly for hunting in conspecific groups), the Toy Group (breeds with small size used for companionship), the Non-Sporting Group (breeds used as watchdogs and house dogs with substantial variation in behavior and morphological features), the Sporting Group (breeds used during hunting to locate or retrieve quarry), the Terrier Group (breeds used for hunting, vermin control, and guarding), and the Working Group (often large breeds used for working duties such as guarding and pulling sleds). See the Supplementary Material in Kolm et al. (2020) for further description.
We characterized life history in different dog breeds based on two variables for which comparative data were available for a large number of breeds: longevity and litter size. Longevity was estimated as the median age at death in years, while litter size was calculated as the mean number of pups per litter. Data for these variables were obtained from the literature (see Supplementary Table S2 provides the breed-specific data that are used in the study).
Selection regimes affecting brain size might be differently constrained by head shape, and head shape is known to be associated with behavior that may have consequences for brain size evolution (Bognár et al., 2021; McGreevy et al., 2013; Selba et al., 2021). Therefore, head shape is an important confound that we accounted for in our analyses. We assigned dog breeds into three shape categories based on skull indices (skull width/skull length * 100) calculated from morphometric measurements of digital representations of the skulls (Figure 2): dolichocephalic (skull index < 51), mesocephalic (51 ≤ skull index < 59), and brachycephalic (59 ≤ skull index) types (see Czeibert et al., 2020 for more details about the determination of boundaries for skull index). For breeds with brain size data derived from the literature, we also added information on head shape from the literature.
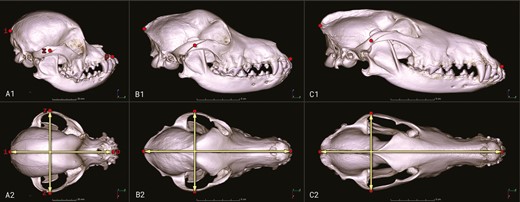
Skull models (volume-rendered CT images) for breeds with different head shapes. (A) Cavalier King Charles Spaniel (brachycephalic), (B) Australian Shepherd (mesocephalic), (C) Collie (dolichocephalic); upper row (A1–C1) shows the right lateral view, lower row (A2–C2) provides the dorsal view of the skulls. Points (i: inion, p: prosthion, and z: zygomatic arch (lateral-most point)) are the anatomical reference points used to calculate skull width and skull length needed for the estimation of skull index.
The breed-specific data that were used in the analyses below are given in the Supplementary Table S2.
Genetic distance and haplotype sharing
For our statistical analyses (see below), we aimed to simultaneously control for the effect of common ancestry and gene flow by using genetic data that reflect the overall genetic distance and haplotype sharing, respectively, between pairs of breeds, as in Parker et al. (2017). The two matrices used for modeling the relatedness between dogs were standardized by bringing genetic distances and haplotype sharing estimates into expected correlation values that varied along the same range between 0 and 1 (with 0 indicating no correlation between phenotypes, and 1 indicating the maximum correlation between phenotypes—for example, what can be observed within the same breed). For further details on the construction of these matrices, see Garamszegi et al. (2020).
Note that the ancestrality of dog breeds is purely derived from genetic data of contemporary breeds, thus there is a major disconnect between truly ancient (i.e., the earliest) dogs and the breeds used in this study. Similarly, there is a disconnect between the modern wolves used in the study and the wolves that were the true ancestors of the dogs. However, we show below that the genetic distance of contemporary dogs from the contemporary wolf predicts the known age of the breeds, thus with our data, we should be able to make interpretations about evolution over time.
Statistical analyses
Dog breeds cannot be regarded as statistically independent units given that they have varying levels of relatedness due to artificial selection and crosses between them. Therefore, to test our predictions about relationships between traits, we followed a framework that allows us to partition among-breed variation into a component for common descent and a component for gene flow (Stone et al., 2011). The former component reflects the effect of similarity due to artificial selection, while the latter reflects similarity due to shared crosses among breeds. To account for these potential sources of non-independence in dogs, we fitted phylogenetic mixed models that included the genetic similarity matrix (describing the expected covariance structure due to common descent) and haplotype sharing matrix (describing the expected covariance structure due to gene flow) as random effects (Garamszegi et al., 2020; Kolm et al., 2020).
Accordingly, the general structure of our model is described by the following equation:
where Y is the 1 by Nbreed (number of breeds) vector of breed-specific estimates of brain volume (log10-transformed), X is the p by Nbreed matrix of fixed effect predictor variables considered in this study (e.g., log10-transformed body mass, functional category, longevity, litter size, head shape as well as their interactions, see below), is a 1 by p vector of the fixed effect regression coefficients, a and b are random effects for the effects of common ancestry and gene flow, respectively, while e is the residual. These terms can be described as follows:
where a is a 1 by Nbreed vector of breed-specific values, ai, which is normally distributed around 0, is the among-breed variance due to common ancestry, b is a 1 by Nbreed vector of bi, which is also normally distributed around 0, is the variance that is added by gene flow, e is a 1 by Nbreed vector of ei which is normally distributed around 0, is the residual variance (e.g., due to true measurement errors or within-breed variance), and I is the identity matrix (Nbreed × Nbreed matrix with ones on the main diagonal and zeros elsewhere). Z and W correspond to the matrices square root of A (Nbreed by Nbreed correlation matrix as defined by the genetic similarity matrix) and B (Nbreed by Nbreed correlation matrix as defined by the matrix of haplotype sharing), respectively, which are computed from their singular value decomposition. This step was needed because the purpose of the within-species comparative method is to specify the design matrices of random effects corresponding to two different evolutionary mechanisms, and matrix algebra can be used to construct transformations of the data such that the transformed data are disentangled and the variables are uncorrelated (Stone et al., 2011). Formally, the singular value decomposition of the matrix is:
where U and V are orthogonal; the columns of U are the left singular vectors; S is a diagonal matrix with the singular values of A; and VT has rows that are the right singular vectors (given that A is a Nbreed by Nbreed matrix, U, S, V matrices have the same dimension). Therefore,
The same transformation can be applied to matrix B that results in W in eq (1). The phylogenetic mixed model described above relies on the unknown parameters , , and , which were estimated when fitting the model to the data. The regression slopes in are also estimated and stand in the focus of this study.
For each prediction, we created a phylogenetic mixed model with different sets of potential explanatory variables. First, we compared the allometric slopes (regression of log10-transformed brain volume on log10-transformed body mass) between dogs and wolves. To do so, we used the breed-specific estimates of brain volume and body size for dogs and individual-specific (or study-specific if individual data were not presented in the source publication) of these traits for the wolf. We aimed to capture within-species variation to describe the allometric regression in both species with this approach (note that we were unable to use individual-specific estimates in dogs because skull specimen information was rarely matched with corresponding body size data). To check if the intercept and/or the slope of the allometric relationship is different in the two species, we constructed a phylogenetic mixed model (including the genetic similarity matrix and the haplotype sharing matrix as random effects) with log10-transformed brain volume as the response that included log10-transformed body mass, species (dog or wolf), and their interaction as fixed predictors. A significant effect for species would yield a difference in the intercept of the allometric regression (i.e., the difference in mean brain volume when controlling for body size), while a significant effect for the interaction would suggest that species differ with regard to the slope of the allometric regression (i.e., wolves had a steeper/shallower slope than dogs).
As the data for dogs and wolves cover remarkably different size ranges, we also repeated the above analyses considering only dog breeds that fall within the size range of the wolf. Furthermore, we performed a pairwise comparison, in which for each individual wolf, we selected the dog breed with the closest body size and checked which of the two species has the larger/smaller brain volume. In this pairwise comparison, we used each breed only once by randomly selecting a wolf individual to match with the dog breed with the closest body size, and then removing these pairs from the subsequent steps of comparisons. Once each wolf individual was assigned to a different dog breed, we fitted a phylogenetic mixed model that considered the paired design by incorporating the appropriate random effect structure. Accordingly, log10-transformed brain volume was the response variable and species (dog or wolf) was the only fixed predictor (note that body size was already held constant, given that each wolf/dog pair was considered to have the same size—with some noise in both directions). The random effect structure included genetic distance and haplotype sharing matrices to control for common descent and gene flow, respectively, as well as the ID for the comparison group (reflecting the pairs of a wolf individual and a dog breed being compared in a pairwise fashion). Given that multiple combinations of the wolf and dog data are possible, we repeated the pairwise modeling process 100 times to check for consistency of the results.
We investigated whether a systematic change in relative brain size has occurred in dogs due to selection since domestication. For this purpose, we examined whether genetic distance from the wolf lineage is positively or negatively associated with relative brain size. Genetic distance from wolves was taken from Parker et al. (2017) with the assumption that breeds that are more closely related to wolves are also those that separated from the first domesticated ancestor fewer generations ago. This assumption is verified by the significant and negative correlation between the genetic distance from wolves and the estimated age of the breed (number of years based on Larson et al. (2012), Parker et al. (2017), and FCI, AKC, official breed club breed descriptions), where younger breeds are more distantly related to wolves (r = − 0.582, N = 119, p < .001). We avoided using the binary categorization of ancient/more recent breeds, as for some breeds this is ambiguous (i.e., varies among different sources and definitions) and using a continuous estimate captures more biological information. Accordingly, we built a model with log10-transformed brain volume as the response variable and log10-transformed body size and genetic distance from wolves as fixed predictors. The model did not include random effects as information about genetic distance was already included in the fixed part of the model and would have been redundant.
Finally, we investigated whether selection for breed function and life history traits has consequences for the evolution of relative brain size in dogs. Originally, we aimed to test these scenarios in a single model, in which body size, AKC categories, longevity, litter size, and head shape were simultaneously included as predictors. However, a model that included all possible predictor variables, their interactions, and the confounding factors needed to be based on a remarkably reduced sample size (from 152 to 82 breeds) because information on the genetic relatedness of breeds (that were used to specify the random part of the model) was limiting. Therefore, we report the effects of function and life history predictors from separate models with larger sample sizes in the main text, but we provide the output from the multi-predictor model in the Supplementary Table S3 (note the conclusions from the multi-predictor model for the estimates of particular effects might be confounded by multicollinearity). To control for selective constraints arising from different head shapes, we also added the corresponding three-state categorical variable and its interaction with the focal predictors (AKC category and life history variables) as predictors in our models. Furthermore, to assess if selection for function or life history affects the allometric regression of brain size, we added interactions between body size and AKC function or between body size and life history traits to the corresponding model. The random effects of these models included genetic distance and haplotype-sharing matrices to control for common descent and gene flow, respectively.
The phylogenetic mixed models were fitted in the R environment (Hadfield, 2010) using the MCMCglmm package, which is based on the Markov chain Monte Carlo algorithm and requires priors to be defined. For this, we relied on a general, inverse-Wishart distribution for the variance structure based on parameter settings for univariate priors (expected variance, V = 1; degree of belief, nu = 0.002, which is equivalent to an inverse-gamma prior on the variances with shape and scale set at 0.002). We ran models for 130,000 iterations with a thinning interval of 100, and we discarded the first 30,000 burn-in samples. The trace and distribution of all parameters were checked visually, along with the autocorrelations between iterations. To check the consistency of the results, each model was executed at least four times (of which we present the last outcome), and we verified whether longer runs or different prior settings provided qualitatively similar model outputs. We also performed model diagnostics to investigate mixing and convergence by Gelman–Rubin statistics (Gelman & Rubin, 1992). To judge the significance of fixed covariates, we relied on the pMCMC values that were associated with the posterior distribution of the estimated parameters. Furthermore, we determined whether models with or without terms of interest produced a better fit to the data based on the deviance information criterion (with smaller values indicating a better fit). Along with the mean of the posterior distribution, we provide the 95% credible intervals (95% CrI) of the estimated parameters. We present the R codes for the phylogenetic mixed models in the Supplementary Material.
Results
Allometric slopes in dogs and wolves
Based on the individual-level data for wolves, the allometric slope of the within-species regression between body size and log brain volume is 0.148 (std. error: 0.043). Wolves have a 131.049 cm3 brain volume at an average mass of 30.994 kg. Across different dog breeds, the allometric slope is 0.2681 (std. error: 0.010), and dogs have an 89.367 cm3 mean brain volume at a 26.112 kg mean body mass. When considering only dog breeds that fall within the size range covered by the wolf data (22–47 kg), the allometric slope is 0.2677 (std. error: 0.074) and the average brain volume is 99.674 cm3 (Figure 3A). Therefore, we find that the allometric slope is steeper for dogs than wolves and that the domesticated species tends to have smaller brains at a given body size when compared to its wild ancestor.
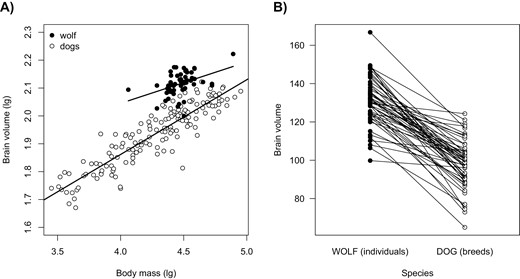
(A) The within-species allometric regression of brain volume (in cm3) in dogs and wolves. White dots reflect different dog breeds and denote breed-specific estimates of brain size and body size. Black dots represent individual wolves. Lines are species-specific allometric regression lines. All data with information on the two traits are shown (N = 159 dog breeds + 55 wolf individuals). (B) The pair-wise comparisons of absolute brain size of the two species, where each wolf individual was paired with the dog breed with the most similar body size.
When considering the non-independence of data in the appropriate phylogenetic mixed model by controlling for effects due to common descent and gene flow, we arrived at the same conclusion (Table 1). The significance of the species term and the species × body size interaction statistically confirmed that there are between-species differences in both the intercept and slope of the allometric regression, respectively.
Random and fixed effects of a phylogenetic mixed model partitioning the components of within-species variance of brain volumes and evaluating the importance of body mass and species as fixed predictors in dogs and wolves together. The analysis relies on breed-specific mean estimates of brain volumes for dogs, while individual-specific data were used for wolves. In the statistical model, only those data with information on genetic relatedness were used (N = 109 dog breeds + 55 wolf individuals).
| Response: Brain volume (log10) DIC: −519.126 | ||
|---|---|---|
| Random effects | σ2 (95% CrI) | |
| Genetic distance (common ancestry, ) | 0.044 (0.027–0.063) | |
| Haplotype sharing (gene flow, ) | 0.015 (0.011–0.019) | |
| Residual () | 0.001 (<0.001–0.002) | |
| Fixed effects | β (95% CrI) | pMCMC |
| Intercept | 0.747 (0.229–1.292) | 0.006 |
| Body mass (log10) | 0.268 (0.188–0.355) | <0.001 |
| Species [wolf] A | 0.647 (0.105–1.188) | 0.018 |
| Body mass (log10) species [wolf] AB | −0.120 (−0.242 to −0.006) | 0.050 |
A: DIC (deviance information criterion) of the model from which the terms were excluded: −500.281.
B: DIC of the model from which the term was excluded: −516.524.
We also compared the absolute brain size of the two species in a pairwise fashion by matching each wolf individual with a dog breed of the same size. This comparison revealed that wolf individuals have consistently larger brain volumes than dog breeds with the same body mass (Figure 3B). This result was statistically supported by the corresponding phylogenetic mixed model (Table 2). The difference between the species indicates that the absolute brain size of the wolf is 24.32% higher than that of the dog.
A phylogenetic mixed model testing for the difference between wolves and dogs in relative brain size when data were structured in a pair-wise fashion (i.e., each wolf individual was grouped—under a specific comparison ID—with the dog breed with the most similar body size) and when controlling for effects due to common descent and gene flow (N = 55 dog breeds + 55 wolf individuals).
| Response: Brain volume (log10) DIC: −242.903 | ||
|---|---|---|
| Random effects | σ2 (95% CrI) | |
| Comparison ID (wolf/dog group) | 0.060 (0.030–0.097) | |
| Genetic distance (common ancestry, ) | 0.171 (0.053–0.322) | |
| Haplotype sharing (gene flow, ) | 0.062 (0.030–0.099) | |
| Residual () | 0.002 (0.001–0.003) | |
| Fixed effects | β (95% CrI) | pMCMC |
| Intercept | 0.565 (−3.124–4.121) | 0.757 |
| Body mass (log10) AB | 0.316 (−0.475–1.105) | 0.432 |
| Species [wolf] AC | 0.139 (0.119–0.158) | <0.001 |
A: DIC (deviance information criterion) of the model from which the terms were excluded: −98.267.
B: DIC of the model from which the term was excluded: −242.657.
C: DIC of the model from which the term was excluded: −97.726.
A systematic change in relative brain size in dogs after domestication
The phylogenetic mixed model for the allometric regression indicated that common descent has a considerable role in mediating the among-breed variation in relative brain size (Table 1; the proportion of variance that is explained by the genetic distance matrix is 73.33%). To visualize this effect, we estimated the relative brain size for dog breeds by taking residuals from the corresponding allometric regression (i.e., dotted line from Figure 3A) and superimposed these onto the dog phylogeny (as taken from Parker et al., 2017), which reflects the relatedness among breeds due to common descent (Figure 4A). This figure suggested that the among-breed variation is shaped by a general increase in relative brain size in breeds that cluster more distantly from the root compared to basal breeds. We, therefore, examined whether artificial selection after domestication has affected brain size evolution in a linear fashion resulting in systematic differences in relative brain volume between breeds of different ages. After controlling for body size, we found that there was a positive relationship between genetic distance from wolves and brain size (Figure 4B, β = 0.745, 95% CrI = 0.154–1.375, pMCMC = 0.014).
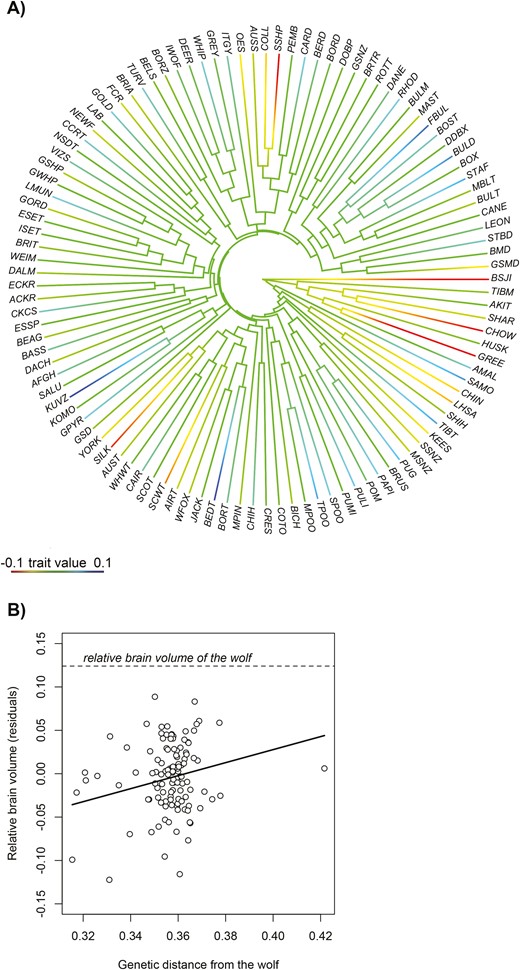
(A) Relative brain size of different dog breeds as overlaid on their phylogenetic tree (the latter was extracted from Parker et al. (2017)). (B) The relationship between relative brain volumes and the genetic distance from wolves across dog breeds. We investigated the effect of potentially influential data points by the DFBeta diagnostics protocol, but this indicated no obvious cases (Quinn & Keough, 2002). The outlier on the right that is most distantly related to wolves represents the boxer; the exclusion of this datapoint does not qualitatively change the output of the linear regression (β = 0.935, 95% CrI = 0.237–1.614, pMCMC = 0.008). For breed abbreviations, see Supplementary Material (Table S2).
Selection for function, life history, and relative brain size in dogs
We predicted that breeding regimes favoring complex phenotypes to fulfill particular functions or to have particular life history characteristics may have consequences for brain size evolution in dogs. To test our prediction regarding function, we used a phylogenetic mixed model to determine whether breeds listed in different AKC groups have different mean relative brain sizes or different allometric relationships. However, we were unable to derive statistical support for any of these effects, even when we accounted for differences in head shape (Table 3, Figure 5). To test our predictions about life history traits, we checked whether longevity and/or litter size is associated with brain size in a model that controlled for body size, head shape, common ancestry, and gene flow. Again, these models did not support the correlated evolution of these traits (Table 4, Figure 6).
A phylogenetic mixed model testing for the effect of selection for function on brain size evolution in dogs when AKC categorization was used to reflect the major functional difference among breeds and when controlling for effects due to common descent and gene flow (toy dogs, N = 14; non-sporting dogs, N = 13; working dogs, N = 24; hounds, N = 12; terriers, N = 13; herding dogs, N = 14; and sporting dogs, N = 16).
| Response: Brain volume (log10) DIC: −391.003 | ||
|---|---|---|
| Random effects | σ2 (95% CrI) | |
| Genetic distance (common ancestry, ) | 0.171 (0.053–0.322) | |
| Haplotype sharing (gene flow, ) | 0.062 (0.030–0.099) | |
| Residual () | 0.002 (0.001–0.003) | |
| Fixed effects | β (95% CrI) | pMCMC |
| Intercept | 0.689 (−0.068–1.465) | 0.086 |
| Body mass (log10) | 0.285 (0.134–0.437) | <0.001 |
| AKC [hounds] | 0.003 (−0.132–0.135) | 0.998 |
| AKC [non-sporting dogs] | −0.004 (−0.140–0.117) | 0.952 |
| AKC [sporting dogs] | 0.003 (−0.128–0.126) | 0.974 |
| AKC [terriers] | 0.005 (−0.129–0.142) | 0.962 |
| AKC [toy dogs] | 0.025 (−0.136–0.169) | 0.734 |
| AKC [working dogs] | 0.001 (−0.126–0.119) | 0.996 |
| Head shape [dolichocephalic] | −0.002 (−0.092–0.079) | 0.916 |
| Head shape [mesocephalic] | −0.006 (−0.086–0.080) | 0.876 |
DIC (deviance information criterion) of the model that includes body mass (log10) only: −400.239.
DIC of the model that includes body mass (log10) and AKC without interaction: −396.414.
DIC of the model that includes body mass (log10) and AKC with interaction: −387.236.
DIC of the model that includes body mass (log10) and head shape without interaction: −398.049.
DIC of the model that includes body mass (log10), head shape, and AKC with interaction between the latest two: −380.204.
A phylogenetic mixed model testing for the effect of life history traits (longevity and litter size) on brain size evolution in dogs when controlling for effects due to head shape, common descent, and gene flow.
| Response: Brain volume (log10) DIC: −392.333 | ||
|---|---|---|
| Random effects | σ2 (95% CrI) | |
| Genetic distance (common ancestry, ) | 0.045 (0.027–0.065) | |
| Haplotype sharing (gene flow, ) | 0.016 (0.011–0.021) | |
| Residual () | 0.001 (0.000–0.002) | |
| Fixed effects | β (95% CrI) | pMCMC |
| Intercept | 0.654 (−0.054–1.458) | 0.096 |
| Body mass (log10) | 0.282 (0.165–0.406) | <0.001 |
| Longevity (age at death) | 0.005 (−0.018–0.026) | 0.652 |
| Head shape [dolichocephalic] | −0.005 (−0.081–0.070) | 0.882 |
| Head shape [mesocephalic] | −0.015 (−0.093–0.064) | 0.704 |
DIC (deviance information criterion) of the model that includes body mass (log10) only: −395.246.
DIC of the model that includes body mass (log10) and longevity: −391.798.
DIC of the model that includes body mass (log10), head shape, and longevity with interaction between them: −390.348.
| Response: Brain volume (log10) DIC: −299.192 | ||
|---|---|---|
| Random effects | σ2 (95% CrI) | |
| Genetic distance (common ancestry, ) | 0.056 (0.031–0.085) | |
| Haplotype sharing (gene flow, ) | 0.019 (0.013–0.026) | |
| Residual () | 0.001 (0.000–0.002) | |
| Fixed effects | β (95% CrI) | pMCMC |
| Intercept | 0.842 (−0.023–1.624) | 0.048 |
| Body mass (log10) | 0.245 (0.026–0.443) | 0.026 |
| Litter size (number of pups) | 0.002 (−0.049–0.047) | 0.948 |
| Head shape [dolichocephalic] | 0.001 (−0.086–0.098) | 0.994 |
| Head shape [mesocephalic] | −0.011 (−0.105–0.080) | 0.794 |
DIC (deviance information criterion) of the model that includes body mass (log10) only: −302.477.
DIC of the model that includes body mass (log10) and longevity: −301.930.
DIC of the model that includes body mass (log10), head shape, and litter size with interaction between them: −382.008.
| Response: Brain volume (log10) DIC: −299.192 | ||
|---|---|---|
| Random effects | σ2 (95% CrI) | |
| Genetic distance (common ancestry, ) | 0.056 (0.031–0.085) | |
| Haplotype sharing (gene flow, ) | 0.019 (0.013–0.026) | |
| Residual () | 0.001 (0.000–0.002) | |
| Fixed effects | β (95% CrI) | pMCMC |
| Intercept | 0.842 (−0.023–1.624) | 0.048 |
| Body mass (log10) | 0.245 (0.026–0.443) | 0.026 |
| Litter size (number of pups) | 0.002 (−0.049–0.047) | 0.948 |
| Head shape [dolichocephalic] | 0.001 (−0.086–0.098) | 0.994 |
| Head shape [mesocephalic] | −0.011 (−0.105–0.080) | 0.794 |
DIC (deviance information criterion) of the model that includes body mass (log10) only: −302.477.
DIC of the model that includes body mass (log10) and longevity: −301.930.
DIC of the model that includes body mass (log10), head shape, and litter size with interaction between them: −382.008.
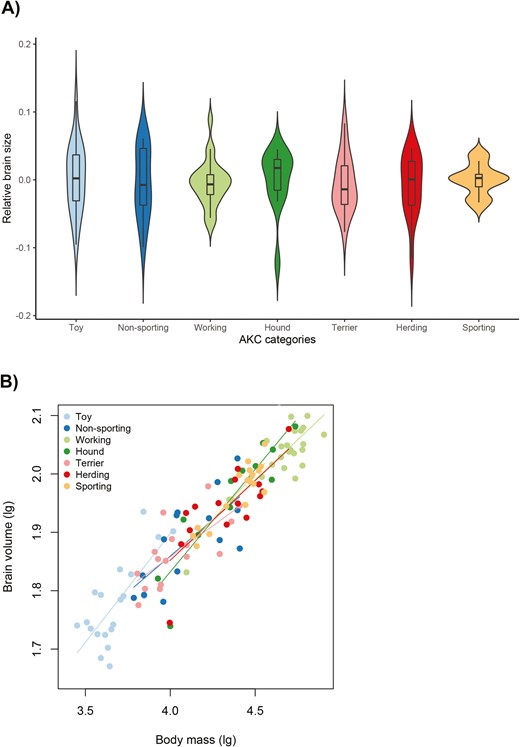
(A) The distribution of breed-specific relative brain size (residuals of the regression of log10-transformed brain volume on log10-transformed body mass) within different AKC groups. (B) The allometric regression of brain size in different AKC groups. All data with information on the two traits are shown (toy dogs, N = 20; non-sporting dogs, N = 14; working dogs, N = 25; hounds, N = 12; terriers, N = 16; herding dogs, N = 15; and sporting dogs, N = 17).
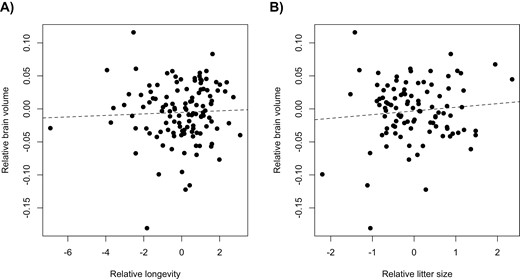
(A) The among-breed relationship of relative brain size and relative longevity (residuals of the regression of medium age at death on of log10-transformed body mass). (B) The among-breed relationship of relative brain size and relative litter size (residuals of the regression of the mean number of puppies on of log10-transformed body mass).
Discussion
Based on the quantification of endocranial volume, we detected relatively smaller brain size in dog breeds that are more closely related to wolves than in breeds that cluster more distantly from the root of the reconstructed phylogenetic tree. Given that genetic distance from wolves reflects the estimated age of the breeds, this finding suggests that even well after domestication, relative brain size can respond to directional selection within a few hundred years. However, in contrast to our predictions, we do not find associations between brain size and functional breed categories, our two life history traits (litter size and longevity), or any of the potential confounding factors. Therefore, we were unable to identify the selection pressures that explain within-species variation in relative brain size in contemporary breeds.
As predicted and in support of previous findings (e.g., Röhrs & Ebinger, 1978), domestication of the dog initially brought on a substantial reduction in brain size (the absolute brain size of wolves is more than 24% higher than that of dogs with the same body size in our dataset). This effect is similar to that found in other mammalian species, both in species bred for consumption and for companionship (Ebinger, 1974; Kruska, 1970; Röhrs & Ebinger, 1978). Interestingly, we identify a pattern of an increase in relative brain size with greater genetic distance from wolves (Figure 4B). This suggests that, after the initial decrease in brain size upon domestication, subsequent intentional selection of specific traits through selective breeding favored brain size increases. Therefore, some selection for increased brain size has been continuously occurring in dogs. We are not aware of other studies that have demonstrated this pattern in any other domesticated species. We can only speculate about the underlying factors that may have generated this pattern. One potential factor is selection arising from the social environment of most modern dog breeds, the human family. The social brain hypothesis, the idea that a more complex social environment yields positive selection on social cognitive abilities via increased brain size, is an important hypothesis in the field of brain evolution (Dunbar, 1998). While controversial due to variable empirical support (DeCasien et al., 2017; Dunbar & Shultz, 2007a, 2007b; Shultz & Dunbar, 2010; van der Bijl & Kolm, 2016) especially within Carnivora (Finarelli & Flynn, 2009), the social brain hypothesis is intuitively attractive, and the social environment is still considered a potentially important selection pressure on cognitive ability and brain size. The social interactions between dogs and humans (e.g., Worsley & O’Hara, 2018) could have contributed to the increase in brain size observed in dog breeds that are distantly related to the wolf. In support of this idea, some breeds that are more closely related to wolves show weaker visual and acoustic interspecific communication skills than most modern breeds. For example, they follow human pointing gestures less successfully (Gácsi et al., 2009; Junttila et al., 2022), they are more independent (Morrill et al., 2022), and they also bark less (Lehoczki et al., 2023). It would be very interesting to run similar analyses in other species that have relatively complex social interactions with their owners and where some proxy of age since domestication is known among breeds/varieties.
In contrast to our prediction, we do not find any difference in relative brain size among the different American Kennel Club breed categories. This is unexpected because there are substantial differences in the behavioral repertoire and body morphology among the different breed categories (see, for instance, Kolm et al., 2020), and other studies report relative brain size differences between breeds with different behaviors. For instance, in cattle, relative brain size co-varies with certain breed functions. Fighting breeds that are selected for intraspecific aggression have substantially larger brains than dairy breeds that are selected for docility (Balcarcel et al., 2021). At the same time, our results match those of a recent study in dogs that did not find any association between relative brain size and an important aspect of animal cognitive ability, executive function (Horschler et al., 2019). There are several potential explanations for the lack of variation in relative brain size among functional breed categories in our study. First, the behavioral differences among dog breeds may not be large enough to produce differences in relative brain size. For example, attachment to the owner, a fundamental characteristic of pet dogs, does not differ between breed types (Lenkei et al., 2021). While behavioral differences may appear to be substantial between functional breed categories such as toy dogs and sporting dogs (but see Morrill et al., 2022), these differences are apparently not large enough to affect relative brain size. It may be that these selection pressures have limited effects in comparison to the putatively most important selection pressures on cognitive ability, i.e., predation, foraging, and mate choice (Chen et al., 2021; Garamszegi & Eens, 2004; Garamszegi et al., 2002; Hutcheon et al., 2002; Kotrschal et al., 2017), that are all highly relaxed or absent in a domesticated species such as the dog. It is also worth pointing out that the AKC functional breed categories contain substantial variation and several breeds are no longer used for their original functions (e.g., several are now essentially family dogs; Kubinyi et al., 2009; Serpell & Hsu, 2005). This also highlights the importance of social interaction with human owners. Second, because our analysis does not include data on the size of separate brain regions, variation may be present that is not identified by our analysis on relative total brain size. Substantial variation in the size of brain regions was recently demonstrated across different breed functions based on MRI scanning in 33 breeds (Hecht et al., 2019). Furthermore, it has been demonstrated in the silver fox (Vulpes vulpes) that, after 100 generations, the “domesticated” foxes had several areas of the brain (e.g., prefrontal cortex, hippocampus, and amygdala) with a larger volume (Hecht et al., 2021). It may be that region size variation is linked with breed function, but that this variation is small, or highly variable across different regions, or that these effects compensate between regions, such that no effects are detectable. It is worth noting that only four generations of selection on a single brain region, relative telencephalon size, was enough to change relative brain size in the guppy (Fong et al., 2021). But those results were from an artificial selection design that effectively targeted only a single specific region. Less specific selection on behavioral aspects that may be linked to the size of multiple regions, some of which may have tradeoffs with others, may limit the chance of detecting effects on relative brain size in dogs. Third, it is also important to consider that most of the contemporary breeds are particularly young, as they were developed in the last decades or in the last two centuries. Therefore, the short time frame that we cover with most of our data may be insufficient to identify evolutionary relationships with appropriate statistical power. Using a more balanced set of breeds with a higher representation of older breeds may improve this issue. Fourth, like any comparative study, our study is based on correlational analyses. This means that the confounding effects of potential unknown variables can never be completely ruled out.
We do not find any support for the predictions concerning associations between relative brain size and litter size or longevity, two life history traits commonly reported to have important implications for brain size evolution (e.g., Kotrschal et al., 2013, 2019). Decreased litter size in animals with larger brains has been reported previously at the inter- (e.g., Isler & van Schaik, 2009) and intraspecific levels (Kotrschal et al., 2013). A possible explanation for the lack of association between brain size and litter size in our study is that well-fed dogs kept in family homes are in high enough condition to compensate for neural costs. It is common for body condition indices in dogs to be higher than normal (Chiang et al., 2022), and this could hide potential negative associations between brain size and litter size that would be visible under less favorable environmental conditions. Because extrinsic mortality is absent in most family dogs, we predicted that breeds with larger relative brain size would have a shorter lifespan. We do not detect such a pattern and propose that intrinsic costs associated with increased relative brain size have no influence on longevity in dogs. It is also important to consider the strong negative association between body size and lifespan in dogs (Yordy et al., 2020). It might be that this link explains most of the variation in our sample of dog breeds, leaving little variation to be explained by relative brain size. While we can only speculate about the reasons for the lack of links between relative brain size and the life history traits studied here, our results suggest that these traits have limited influence on the evolution of relative brain size in dogs.
By controlling for body size, we adhere to the dominate view in the field that brain tissue beyond what is explained by body size is the most interesting aspect of brain size in relation to variation in cognitive abilities. This also allowed us to remove the confounding effects of body size on behavioral aspects among functional breed categories. We also controlled for skull shape in our analyses. Skull shape can be associated with brain size (e.g., Bastir et al., 2010; Richtsmeier et al., 2006; Ross & Henneberg, 1995; Tsuboi et al., 2014; Wroe & Milne, 2007), and this has been found previously in dogs (Hecht et al., 2019; Pilegaard et al., 2017). Moreover, skull shape can respond to various selection forces during domestication (e.g., Schoenebeck & Ostrander, 2013; Trut, 1999; Zeder, 2012). By controlling for body size and skull shape, we could therefore remove considerable effects that otherwise may have affected the results. This may, of course, also be a reason why we do not detect any effect of functional breed category on relative brain size. We infer that the second, third, and fourth explanations we proposed for the lack of relationship between function and brain size are also applicable to the lack of associations with life history.
To summarize, based on the largest dataset to date, we have investigated relative brain size evolution in dogs long after domestication while controlling for body size and skull shape as potential confounding factors. We find a modest increase in relative brain size since domestication, potentially caused by the social environment common to most dogs, but no association between functional categorization of breeds and relative brain size. We propose that the selection on behavioral features during breeding for functions such as hunting or herding has not been strong enough to change overall brain size in dogs in the absence of selection from predation, foraging, and mate choice. We also find it plausible that some brain regions respond to selection but effects in different areas compensate for each other. We suggest that future studies in the field of brain evolution in dogs should focus on changes acting on particular brain regions to uncover the potential links between brain morphology and other traits. We also suggest that the strongest selection pressures on cognitive abilities in wild populations (predation, foraging, mate choice, and within- and between-species social interactions) are necessary to yield large enough changes in brain morphology for changes in relative brain size to be detected. Future analyses across multiple taxa and with data on multiple potential selection pressures could test the generality of this suggestion.
Author contributions
L.Z.G. and N.K. designed the study, T.C. collected data, E.K., K.C., and G.N. performed measurements, L.Z.G. designed and ran the statistical analyses, L.Z.G. and N.K. wrote the first draft of the manuscript, and all authors commented on the revised versions of the manuscript.
Data availability
The data underlying this article are available in the Dryad Digital Repository, at https://dx.doi.org/10.5061/dryad.nzs7h44wn, and as the article’s online supplementary material.
Funding
The study was partly supported by the Hungarian Academy of Sciences via a grant to the Hungarian Academy of Sciences (grant no. PH1404/21) and National Brain Programme 3.0 (NAP2022-I-3/2022), and by the National Research, Development and Innovation Office (grant no. 2019-2.1.11-TÉT-2020-00109) and Swedish Research Council (grant no. 2021-04476).
Conflict of interest:
The authors declare no conflict of interest.
Acknowledgments
The authors are grateful to the associate editor, Julien Clavel, two anonymous referees and János Podani for their constructive comments during the revisions. Katherine Ostevik kindly provided a linguistic revision. We are deeply indebted to Örs Petneházy, Tamás Donkó, Ádám Csóka for their assistance during the CT scans and endocast analyses.
