


Abstract
To undertake a cross-sectional survey of the extent and nature of food and beverage advertising to children on Maltese national television stations. Seven national free-to-air channels were recorded for seven consecutive days in March 2014 between 07:00 and 22:00 h. Advertisements were coded according to predefined categories, with a focus on advertisements aired during ‘peak’ children's viewing times, defined as periods during which more than 25% of children were likely to be watching television on any channel. Food and beverage advertisements were classified as core (healthy), non-core (unhealthy) or miscellaneous foods. Malta. Whole population, with a focus on children. Food and drinks were the most heavily advertised product category (26.9% of all advertisements) across all channels. The proportion of non-core food/drink advertisements was significantly greater during peak compared with non-peak children's viewing times (52 vs 44.6%; p ≤ 0.001). A majority of advertisements aimed at children are for non-core foods, and are typically shown during family-oriented programmes in the late evening rather than being restricted to children's programmes. ‘Taste’, ‘enjoyment’ and ‘peer status’ were the primary persuasive appeals used in adolescent and child-focused advertisements. This first content analysis of television advertising in Malta suggests that there is scope for the implementation of statutory regulation regarding advertising of foods high in fat, sugar and salt (HFSS) during times when children are likely to watch television, rather than during children's programmes only. Ongoing, systematic monitoring is essential for evaluation of the effectiveness of regulations designed to reduce children's exposure to HFSS food advertising on television.
INTRODUCTION
Excess weight in children is of significant public health concern globally and in Malta, a small Mediterranean island republic (Lobstein et al., 2004; Grech et al., 2006; Farrugia Sant-Angelo and Grech, 2011). Overweight and obese children are known to have a high risk of suffering from a range of adverse non-communicable diseases (Lobstein et al., 2004). There is a well-established association between time spent watching television and body weight (Lobstein and Dibb, 2005; Cairns et al., 2013). Television watching is a sedentary behaviour, and there might be a concomitant tendency to consume energy-dense snack foods during viewing (Hastings et al., 2003). Marketing of unhealthy foods and beverages to children may adversely affect children's dietary choices and energy intake by influencing their food preferences, knowledge, attitudes, purchasing behaviour and purchasing requests to parents (Hastings et al., 2003; Cairns et al., 2013; O'Dougherty et al., 2014).
Reducing children's exposure to the promotion of unhealthy foods and beverages high in saturated fats, trans-fat, free sugars or salt (HFSS) has been recognized as a key target for childhood obesity prevention policy (United Nations, 2011). In many countries, HFSS foods such as sugar-sweetened breakfast cereals, soft drinks, confectionery and high-fat snacks are frequently advertised to children on television (Cairns et al., 2009). Children under 8 years of age are particularly vulnerable to such promotion, as they have limited cognitive ability to discriminate entertainment content from commercial content (Carter et al., 2011). Older children also tend to accept commercial claims uncritically (American Psychological Association, 2004; Kunkel and Castonguay, 2012). In 2010 the World Health Organization (WHO) released a set of recommendations to guide Member States' efforts in development of policies on food marketing communications in order to reduce the impact of HFSS foods and beverage promotion to children, including a recommendation for the establishment of monitoring and evaluation systems to ensure that policy objectives are reached (World Health Organization, 2010). Regulatory changes have been implemented in a number of countries as regulation of food marketing is increasingly recognized as a promising avenue for intervention (Hawkes and Lobstein, 2011).
Contextual factors and the policy environment
To date, there has been limited discourse on regulation of HFSS food and beverage advertising in Malta. A recently updated Food and Nutrition Policy and Action Plan (Health Promotion and Disease Prevention Directorate, 2015) recommends that media service providers develop codes of conduct regarding inappropriate promotion of HFSS foods to children, in line with Article 9(2) of the Audiovisual Media Services Directive (AVMSD) of the European Union (Council of the European Union and European Parliament, 2010). The Broadcasting Act encompasses a Legal Notice that makes reference to misleading and deceptive advertising to minors, including HFSS food promotion (Government of Malta, 2010). Television is still regarded as the media platform preferred by food marketers, although its dominance is gradually decreasing (Cairns et al., 2013). In 2010 in Malta, around 60% of Maltese children aged 11–15 years reported watching television for more than 2 h daily on weekdays (Health Promotion and Disease Prevention Directorate, 2010). A Broadcasting Authority (BA) of Malta audience assessment survey suggests that around 62% of the Maltese population regularly followed a television station in 2014; this was true across gender and age groups. Almost three-fourths of respondents listed one of the seven free-to-air national television channels as their preferred station, suggesting that a substantial proportion of the Maltese population still watch local television regularly (Axiak, 2014).
The aim of this study was to conduct a cross-sectional survey to assess the extent of exposure and nature of food and beverage advertising across national free-to-air television stations in Malta, in order to establish whether the problem of unhealthy food promotion within television exists. To our knowledge, this is the first such study conducted in Malta. The overall proportion of food advertisements and the balance of ‘healthy’ versus ‘unhealthy’ foods, as well as variations in advertising patterns by station; viewing times and day of the week were analysed. The use of persuasive techniques in food and beverage advertisements was explored.
MATERIAL AND METHODS
Recording
Television transmission was recorded from 07:00 to 22:00 h daily for all seven national free-to-air television stations broadcasting during the week between 10th and 16th March, 2014, in accordance with the guidelines outlined by the International Network for Food and Obesity/non-communicable diseases, Research, Monitoring and Action Support (INFORMAS) group (Kelly et al., 2013). These were TVM and TVM 2 (Public Service channels); ONE TV and NET TV (political-commercial channels) and fLiving, SMASH TV and XEJK TV (commercial channels). The second week of March was selected as being a period representative of usual advertising patterns that did not contain any special events or holiday periods.
Coding
Television station broadcasts were recorded and scanned by the BA, and all advertising content was subsequently forwarded to the authors. Thirty hours of content selected at random were coded independently by two of the authors, D.C. and S.R., according to predefined criteria (Gantz et al., 2007; Kelly et al., 2008, 2010). Inter-rater reliability for classification of advertisements as either ‘food’ or ‘non-food’ was very high (100% agreement), whereas 92% agreement for classification of food advertisement category and target audience was achieved. Inter-rater reliability for coding of primary persuasive technique was 81%. Disagreements were resolved by discussion. Subsequently, coding of remaining hours was carried out by D.C. and S.R. according to standard procedure in order to achieve consistency. Where more than one food product was shown, the most dominant product was coded, whereas the first product shown was coded when multiple products were given equal importance. Other coding categories included channel, programme category (e.g. drama, news, discussion/current affairs, based on an in-house classification issued by the BA) around which the advertisement was shown; the type of product advertised (e.g. food/drink, fashion, furniture); time of day and whether the advert was aired during children's peak or non-peak viewing times.
Food and beverage advertisements
Advertisements showing food and beverages were categorized into 29 sub-categories (Table 1). In general, nutrient-dense items low in excess energy that are required daily to meet nutritional requirements (such as bread, fruit and vegetables) were considered to be ‘core’ foods, whereas energy-dense, nutrient-poor HFSS foods such as fast food, high-sugar/low-fibre breakfast cereal and sweets were classified as ‘non-core’ foods. All other items such as tea, coffee and generic supermarket advertisements for multiple items were classified as ‘miscellaneous’ (Kelly et al., 2007, 2010; Boyland et al., 2011). Food advertisements were further screened for three persuasive marketing techniques: premium offers (such as competitions, vouchers, price reductions); celebrity endorsement and use of cartoon/branded characters. Additionally, each food advert was coded for the primary/most dominant persuasive appeal used (such as fun, taste, price) and the primary target of each advert based on the general direction and content of the advert (e.g. dialogue, complexity, used of child actors or cartoons) (Boyland et al., 2012).
Contribution of food categories to overall food advertisements
| Classification of food and beverages | Peak | Non-peak | Overall | χ2 test (p value) |
|---|---|---|---|---|
| frequency (%) | frequency (%) | frequency (%) | ||
| Core foods | 85 (14.00) | 219 (19.48) | 304 (17.56) | <0.001 |
| Baby foods (excl. milk formulas) | 1 (0.18) | 2 (0.17) | 3 (0.17) | 0.564 |
| Bottled water | 1 (0.17) | 18 (1.60) | 19 (1.10) | <0.001 |
| Breads, low-fat crackers, rice, pasta and noodles | 33 (5.45) | 79 (7.03) | 112 (6.47) | <0.001 |
| Fruit and fruit products without added sugar | 0 (0.00) | 5 (0.44) | 5 (0.29) | / |
| Low-fat/reduced-fat dairy products | 4 (0.66) | 26 (2.31) | 30 (1.73) | <0.001 |
| Low-sugar and high-fibre breakfast cereals | 3 (0.50) | 3 (0.27) | 6 (0.35) | 1 |
| Meat and alternatives (not crumbed/battered; incl. fish, legumes, eggs, nut products, peanut butter) | 25 (4.13) | 42 (3.74) | 67 (3.87) | 0.038 |
| Soups (excl. dehydrated), salads and sandwiches, frozen meals and low-fat savoury sauces | 6 (0.99) | 5 (0.44) | 11 (0.64) | 0.763 |
| Vegetables and vegetable products without added sugar | 12 (1.98) | 34 (3.02) | 46 (2.66) | 0.01 |
| Non-core foods | 316 (52.06) | 501 (44.57) | 817 (47.20) | <0.001 |
| Alcohol | 1 (0.17) | 24 (2.14) | 25 (1.45) | <0.001 |
| Cakes, muffins, cookies, pies and pastries | 19 (3.14) | 42 (3.74) | 61 (3.53) | 0.003 |
| Chocolate and confectionery (incl. chewing gum) | 32 (5.28) | 23 (2.05) | 55 (3.18) | 0.225 |
| Crumbed/battered meats and high-fat frozen meals | 20 (3.30) | 16 (1.42) | 36 (2.08) | 0.505 |
| HFSS fast food or meals | 153 (25.25) | 258 (22.95) | 411 (23.76) | <0.001 |
| Frozen/fried potato products (excl. crisps) | 9 (1.49) | 8 (0.71) | 17 (0.98) | 0.808 |
| Fruit juice and fruit drinks | 1 (0.17) | 14 (1.25) | 15 (0.87) | 0.001 |
| Full-fat dairy products | 26 (4.29) | 44 (3.91) | 70 (4.05) | 0.031 |
| HFSS spreads (excl. peanut butter), oils, high-fat savoury sauces, canned and dehydrated soups | 40 (6.60) | 48 (4.27) | 88 (5.09) | 0.394 |
| High-sugar or low-fibre breakfast cereals | 7 (1.16) | 8 (0.71) | 15 (0.87) | 0.796 |
| Ice cream and iced confections | 0 | 5 (0.44) | 5 (0.29) | / |
| Snack foods (incl. crisps, extruded snacks, popcorn, granola bars, sugar-sweetened fruit and vegetable products, sugared/salted nuts) | 6 (0.99) | 2 (0.18) | 8 (0.46) | 0.157 |
| Sugar-sweetened drinks, incl. regular/diet soft drinks, cordials, sports drinks | 2 (0.33) | 14 (1.25) | 16 (0.92) | 0.003 |
| Miscellaneous foods | 206 (33.94) | 404 (35.94) | 610 (35.24) | <0.001 |
| Baby and toddler milk formulas | 4 (0.66) | 3 (0.27) | 7 (0.40) | 0.705 |
| Non-fast food restaurant/catering establishment | 88 (14.52) | 220 (19.57) | 308 (17.80) | <0.001 |
| Supermarkets advertising mostly core foods | 5 (0.83) | 30 (2.67) | 35 (2.02) | <0.001 |
| Supermarkets advertising mostly non-core foods | 51 (8.42) | 76 (6.76) | 127 (7.34) | 0.027 |
| Supermarkets with non-specified foods (generic ads; not clearly for either core or non-core foods) | 41 (6.77) | 55 (4.89) | 96 (5.55) | 0.187 |
| Tea and coffee | 16 (2.64) | 20 (1.78) | 36 (2.08) | 0.505 |
| Vitamin and mineral supplements | 0 (0.00) | 5 (0.44) | 5 (0.29) | / |
Bold values indicate statistical significance at 0.05 significance level.
Definition of children and children's viewing hours
Country definitions of children in broadcasting regulatory frameworks vary considerably (Hawkes, 2004). Currently, the Broadcasting Act defines a minor as an individual less than 18 years of age. Clearly, age is a primary determinant of exposure to particular television programmes and advertisements. This has been recognized by the BA as a contentious issue influencing debate around vulnerability of older minors to the persuasive effects of advertising, and a consultation process to lower this threshold to 16 years is underway (Cassar, 2014). Definitions of children's viewing hours also vary (Cairns et al., 2009; United Nations, 2011), although audience viewing data suggests that children's television viewing is often not confined to designated children's programmes (Kelly et al., 2010). We adopted a previously-used definition of peak children's viewing times as being those periods during which more than 25% of children were likely to be watching television on any channel (Kelly et al., 2008, 2010). These were between 07:00–08:00 and 16:00–21:00 on weekdays, and 19:00–21:00 on weekends, based on average audience viewing patterns over the previous year and the existing 21:00 watershed enforced by the BA (Government of Malta, 2007). Other time periods were considered to be ‘non-peak’.
Definition of fast food restaurant
Restaurant advertisements comprised a significant proportion of overall advertising, and were categorized as either ‘fast food’ or ‘non fast food’ based on a classification system developed by Lake and colleagues (Lake et al., 2010) and adapted by Burgoine et al. (Burgoine et al., 2014). We felt the need to create an additional category for non-fast food (sit-down) restaurants/meal advertisements beyond the 28 categories outlined by Kelly et al. (Kelly et al., 2007, 2010) in order to accommodate advertisements for establishments where the broad emphasis was on the wide choice of food offered, rather than HFSS food specifically. In view of concerns that adopting a restrictive definition of fast food outlets (e.g. limiting outlets to multinational franchises only) might underestimate true exposure to fast food (Fraser et al., 2010; Sharkey et al., 2011), we considered a fast food restaurant to be an outlet where pre-prepared or processed HFSS food is predominantly ordered and paid for at the counter and lacking a waiter service. Establishments advertising wedding catering services (predominantly consisting of HFSS finger food) and traditional sit-down restaurants that heavily emphasized takeaway/delivery options in their advertisements (e.g. quick-service pizzerias), were thus classified in the fast food category.
Ethical approval
Ethical approval was not required as no human participants were involved in this study.
Analysis
Data were analysed using IBM SPSS version 18 for Windows. Non-parametric analyses were performed as the data were not normally distributed. Pearson χ2 tests were applied to determine significant differences in the proportion of food advertising. p-values of <0.05 were considered statistically significant (with Bonferroni adjustments for multiple comparisons). All data were analysed together as initial assessment showed that food advertising prevalence did not vary significantly by day of recording.
RESULTS
A total of 735 television hours were recorded, within which 6431 advertisements were shown at an average rate of 1.25 advertisements per channel per hour (ch−1 hr−1).
Product types advertised
Across all channels, food was the most frequently advertised product category (n = 1730; 26.9%), broadcast at an average of 0.34 food-related advertisements per channel per hour. There was a significant difference in the proportion of the various product categories advertised (χ2(17) = 8248.6, p ≤ 0.001), with furniture (13.3%) and services (10%) being the next most frequently advertised categories. There was also significant variation in food advertising frequency between channels (χ2(6) = 1102.92, p ≤ 0.001).
Food types advertised
There was a significant difference in the proportion of food product categories advertised (χ2(27) = 3687.05, p ≤ 0.001). The three most frequently advertised categories were for fast food restaurants or meals (including ‘healthy’ alternatives); non-fast food restaurants and supermarket advertisements showing mostly non-core foods respectively (Table 1). The proportion of advertisements for non-fast food restaurants was significantly different from that of fast food restaurants (χ2(1) = 14.8, p ≤ 0.001) or HFSS spreads (χ2(1) = 122.2, p ≤ 0.001). Vegetable and vegetable products without added sugar ranked 11th from the 29 food categories, while fruit and fruit products ranked 26th. Breads and non-battered/crumbed meats were the 4th and 8th ranked food categories respectively.
Core, non-core and miscellaneous food advertisements by children's viewing times
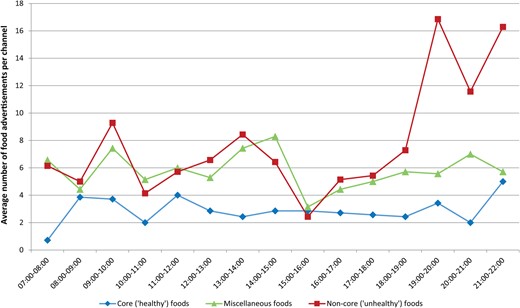
Within our sample, non-core food advertisements were shown at a mean rate of 0.16 ch−1 h−1; core food advertisements were shown at a mean rate of 0.06 ch−1 h−1, and miscellaneous food advertisements at 0.12 ch−1 h−1. There was no significant difference between the rates at which food advertisements were broadcast during peak hours and non-peak hours (p = 0.171). However, the proportion of core, non-core and miscellaneous advertisements within the food advertisement category differed significantly across peak and non-peak viewing times (χ2(2) = 11.87, p = 0.003). Table 1 suggests that a greater proportion of non-core food advertisements were broadcast during peak hours (52% or 0.19 ch−1 h−1) than during non-peak hours (44.6% or 0.14 ch−1 h−1); χ2(2) = 41.9, p ≤ 0.001), while the opposite was true for core and miscellaneous food advertisements (p = < 0.001). While their respective proportions during peak and non-peak viewing hours on weekend days were not significantly different (p = 0.234), Figure 1 indicates that non-core food advertisements were broadcast at a higher frequency during peak hours on weekdays, while core food advertisements were broadcast at higher frequencies during non-peak weekday hours (χ2(2) = 10.2, p = 0.006). There was also a significant difference in the proportion of food advertisements for core, non-core and miscellaneous food items (χ2(2) = 230.9, p ≤ 0.001) across all channels.
Volume of food advertisements per channel per hour.
Food advertisements broadcast around different programme types during peak viewing hours
There was a significant difference in the proportion of core/non-core food advertisements aired across the different programme types (χ2(20) = 99.45; p ≤ 0.001). During peak viewing hours, Entertainment/Gameshow programmes contained the highest proportion of food advertisements (43.2% of all advertisements in this category), followed by Magazine (variety) programmes (27%), Drama (26.7%) and Discussion/Current Affairs (25.4%). Within these four categories, only Drama and Discussion/Current Affairs had a significantly higher proportion of non-core compared with core food advertisements (p ≤ 0.001). Children's programmes had among the least food advertisements overall, comprising 18.8% of all advertisements shown during such programmes. However the majority (71.4%) of these food advertisements were for non-core foods (p ≤ 0.001).
Food advertisements aimed at children
Overall, 125 (7.2%) of all food advertisements were considered to be aimed primarily at minors (children or adolescents). 95% of these child-focused advertisements were for non-core foods (n = 119; χ2(2) = 215.3; p ≤ 0.001). Chocolate and confectionery advertisements ranked first (40% of child-focused food advertisements), followed by full-fat dairy products (21%) and cakes, muffins and pastries (18%). There was a significant difference with regards to the programme category within which these were aired (χ2(8) = 179.5; p ≤ 0.001). Only one child-focused advertisement (belonging to a large multinational fast food company) was broadcast during a children's programme. Instead, 38% of advertisements aimed at children were aired during Discussion/Current Affairs and 31% during Entertainment/Gameshow programmes. Child-focused advertisements were approximately equally distributed across days (p = 0.37); between peak and non-peak viewing hours (p = 0.93) and with regards to use of a persuasive technique (p = 0.42). Political-commercial channels aired more child-focused advertisements than Public Service channels (76 vs 49; χ2(1) = 5.83; p = 0.016), whereas commercial channels did not broadcast any child-focused advertisements at all. Furthermore, a significant difference in the time at which child-focused advertisements were aired was identified (χ2(14) = 205.4; p ≤ 0.001), wherein 68% of all child-focused food advertisements were broadcast between 19:00 and 22:00.
Persuasive techniques used
Overall, 815 food advertisements incorporating a persuasive promotional technique were broadcast at an average rate of 0.16 ch−1 h−1. There was a significant difference between the use of persuasive techniques to promote core, non-core and miscellaneous foods (χ2(2) = 207.3; p ≤ 0.001), with core foods unlikely to be linked to a persuasive technique. Few advertisements featured cartoon characters (n = 38), however most of these (94.7%) were for non-core chocolate and confectionery or full-fat dairy products. None were for core foods. Although no promotional toys were linked to specific adverts, 63 of these advertisements were regarded as being directly targeted at minors. Across all channels, a promotional character or celebrity endorsement featured on 47.3% of food advertisements. On the other hand, there was a significant difference between food category advertisements endorsed by local celebrities (χ2(2) = 41.03; p ≤ 0.001) with 47% showcasing miscellaneous foods and 34.6% showcasing core foods, while non-core foods were the category least frequently endorsed. 55% of adverts featuring a persuasive technique contained premium offers; of these, few were for core foods (7.1%), and there was no significant difference between the proportions of premium offer advertisements showcasing miscellaneous or non-core foods. Premium offers and celebrity endorsement techniques were primarily aimed at adults.
Persuasive appeals used
The proportions of all primary persuasive appeals used to advertise to adults except for ‘weight loss’ were significantly different from those used in advertisements aimed at minors (all p < 0.001; Table 2). Overall, there was a significant difference between the proportions of different persuasive appeals used in child-focused advertisements (χ2(5) = 87.3; p ≤ 0.001). ‘Taste’ was the most popular appeal to children, followed by ‘fun’ and ‘peer status’ (i.e. promoting consumption of a specific food as a means of social acceptance). ‘Value for money’ and ‘General superiority’ featured significantly more frequently in advertisements aimed at adults when compared with child-focused advertisements.
Mean proportion of primary persuasive appeals used
| Primary persuasive appeal used | Primary target of advert (%) | |
|---|---|---|
| Adults | Minors | |
| Value for money | 24.5 | 0 |
| General superiority | 22.9 | 5.6 |
| Convenience | 14.1 | 3.2 |
| Health/nutrition | 8.8 | 0 |
| Taste | 8.6 | 42.4 |
| Premium/contest | 7.6 | 0 |
| Unique | 6.5 | 0 |
| Enjoyment/Satisfaction | 5 | 21.6 |
| Weight loss | 1.7 | 0 |
| Peer status | 0.2 | 22.4 |
| Energy | 0.1 | 4.8 |
DISCUSSION
Malta is a signatory to the Vienna Declaration and the European Charter on Counteracting Obesity, which recommend considering child marketing restrictions as policy options for governments’ obesity strategies (World Health Organization, 2006; WHO Ministerial Conference, 2013). However, although a number of national policy documents explicitly recommend reductions in promotion of unhealthy food to minors (Ministry for Health the Elderly and Community Care, 2010; Superintendence of Public Health and Ministry for Health the Elderly and Community Care, 2012; Health Promotion and Disease Prevention Directorate, 2015), this study suggests that more can be done to protect Maltese children against exposure to HFSS food and drink on national television.
In some respects, television food advertising in Malta follows a pattern similar to that of other countries. Food was the most heavily advertised product category (26.9% of total advertisements), comparable to the high prevalence seen in Greece and Italy (Kelly et al., 2010) and double that in the UK (12.8%) (Boyland et al., 2011). Most food advertisements on Maltese television channels are for energy-dense, HFSS food and beverages or restaurant advertisements, with less than a fifth of these representing ‘core’, nutrient-dense items. Non-core foods seem to be preferentially advertised during peak viewing hours at the expense of core food advertisements. From the core food types, unsweetened vegetable and fruit products accounted for less than 3% of all food advertisements. This strongly contrasts with dietary guidelines (Health Promotion and Disease Prevention Directorate, 2015) and supports evidence from multiple international studies indicating that advertising for healthier foods such as fruits and vegetables is infrequent or absent (Cairns et al., 2009).
Our results also highlight potential context-specific differences in comparison to findings from other countries that may be relevant to other small states, and which may reflect advertiser's familiarity with local television viewing habits. For example, reviews have indicated that children's advertising is typically dominated by pre-sugared breakfast cereals, soft drinks, confectionery, savoury snacks and fast foods (Cairns et al., 2009, 2013). In contrast, fast food restaurant and confectionery advertising were common in Malta [in line with findings from the island state of Singapore (Huang et al., 2012)], whereas breakfast cereals, soft drinks and savoury snacks advertisements were infrequent. In our sample, food advertisements were not frequently aired during children's programmes, unlike the trend in other countries (Cairns et al., 2009, 2013; Kelly et al., 2010). Additionally, although the provision of free toys/gifts with purchase of items is a common marketing technique to promote food to children in many countries (Huang et al., 2012; Jenkin et al., 2014), this does not seem to be the case in Malta. The most common creative strategy employed to target children was the use of cartoon characters, and such advertisements were not typically aired during children's programmes. Instead, two-thirds of all child-focused advertisements—of which the majority were for non-core foods—were broadcast during a 3-h period that extends beyond the evening watershed. This corresponds to the ‘prime time’ hours when evening Entertainment/Gameshow programmes typically tail off in the early evening, followed by Drama and Discussion/Current Affairs programmes that start just before the 21:00 watershed. There is evidence to suggest that drama and entertainment programmes are very popular amongst Maltese children. In 2014 54.8% of 12–14 year old children named a drama production as their preferred programme, while 16.8% preferred to watch ‘Entertainment’ programmes (Axiak, 2014). Public Service broadcasters are the preferred channels of one-third of 12–14 year old Maltese children, while 43.9% prefer to watch a cable TV channel aired internationally (typically the Disney Channel). This is understandable in light of the paucity of children's programmes on local television. Only eight instances of programmes aimed specifically at children were aired during the week of recording, constituting less than 2% of all programmes.
Core food advertisements were broadcast at higher frequencies during non-peak weekday hours, possibly targeting home makers who would typically be responsible for purchasing groceries for the family. On the other hand, non-core foods in general were more heavily advertised during peak viewing hours on weekdays, at times when children are likely to be watching television (Axiak, 2014). This difference was not seen on weekends, and merits further research. Our results suggest that most television advertising in Malta is targeted towards parents, not children. However, strategic broadcasting of adult-focused, non-core food advertisements during prime time might compensate for such advertisement's relative inability to directly engage the attention of children.
Persuasive techniques employed in advertisements varied depending on the target audience. Unsurprisingly, advertisements in our study which featured promotional characters were often aimed at children and linked to non-core foods, echoing findings elsewhere (Jenkin et al., 2014). Advertisements featuring premium offers and celebrity endorsement techniques were primarily aimed at adults, possibly indicating that advertisers on Maltese television do not perceive local celebrities as being effective in promoting their food products to children. On the other hand, one-third of these advertisements featured core foods, possibly suggesting that adult purchasing of core foods is more likely to be influenced by celebrity endorsement. Associating a product with premium offers was also a common strategy and seemingly linked to non-core food promotion to children; cakes, muffins, fruit juices and full-fat dairy products such as sugar-sweetened yogurt were typically advertised in this manner. Similar to findings in other countries (Cairns et al., 2009; Jenkin et al., 2014), appeals to taste and fun were recurrent themes in our sample, highlighting the need for monitoring both content and timing of unhealthy food advertising to children.
There were some limitations to this research. Its cross-sectional, descriptive nature means that a link between advertising and potential behavioural outcomes in children cannot be explicitly made. Differences in categorization of health and unhealthy foods across countries may limit the comparability of results. For example, full-fat dairy products and fruit juices are classified as non-core foods in our study, however these were considered to be healthy foods elsewhere (Huang et al., 2012). Our adaptation of the definition of ‘fast food’ to include wedding catering and HFSS food advertisements offered by non-multinational ‘quick service’ restaurants may limit comparability of this category to existing research and policy applications. Methodological restrictions of TV audience reporting in Malta mean that data on children younger than 12 years of age is not routinely collected, hence conclusions on food promotion exposure in this age group should be interpreted with caution. Only national television stations were included in our survey as only these channels can be subject to statutory regulation by the BA. However, extrapolation of the viewing habits of 12–14 year olds (Axiak, 2014) suggests that only one-third of Maltese children aged 12–14 years watch local television stations, perhaps due to the increasing popularity of pay-TV subscriptions offering a variety of satellite channels: by the end of 2014 there were 147 880 pay-TV subscriptions in Malta, compared with the 152 980 private households assessed during the 2011 census (Malta Communications Authority, 2015). This raises concern about inappropriate advertising to children on television channels (and other media platforms such as the internet) originating from outside the country's borders: such cross-border advertising is currently permissible, and requires concerted action at an international level for successful regulation (Hawkes, 2004).
Recommendations
Collection of seasonal TV advertising data would enable yearly advertising trends to be identified. Modification of the current broad age categories used in BA Malta's television audience reach surveys—and inclusion of children younger than 12 years—would contribute to a clearer understanding of the situation. The possibility of assessing promotions on popular foreign TV stations should also be considered as these are increasing in popularity, particularly among younger children. Additionally, the optimal INFORMAS approach to food promotion monitoring recommends collecting data from a number of media platforms (Kelly et al., 2013). Indeed, marketing food to children via electronic media is widespread even as the regulatory environment is weaker than that of other major platforms (Hawkes, 2006). The Internet is known to be a popular platform amongst children aged 15 and older in Malta (National Statistics Office, 2012), and this may also apply to children younger than 12 years.
The BA has made proposals aimed at amending existing legislation on ‘Protection of Minors’; these outline how promotion of HFSS food to children might be limited and recognizes ‘… minors’ immaturity or natural credulity …’. This would be a welcome first step towards the development of a code of conduct for media service providers to follow (Cassar, 2014), in line with national calls for development of a potentially legally binding code of practice in food advertising (Health Promotion and Disease Prevention Directorate, 2015). Such initiatives require careful phrasing in order to take into account children's frequent exposure to advertisements that are not specifically aimed at them. There has been a consensus amongst local broadcasters that the late-night watershed for HFSS food advertising should be set at 21:00. In reality, children's peak viewing hours overlap with adult's viewing hours, and most television stations tend to start broadcasting programmes which may include adult-oriented material any time after 8.30pm (Government of Malta, 2007). In order to effectively reduce children's exposure to HFSS food advertising and shift the balance towards healthier exposure for children, particular care should be taken so that regulation of HFSS food advertisements encompasses all programmes (not just those aimed at children) aired during peak viewing hours, including family-oriented programmes that straddle the watershed. A shift in programme sponsorship trends could be encouraged, emulating ‘child-friendly’ policies such as those championed by the Disney Channel, which does not broadcast traditional food advertising, relying instead on television programme sponsorship (Boyland et al., 2012). However, we recognize that this might be a challenging option for small countries where local televised productions may be dependent on the food industry for a significant portion of their revenue.
The World Health Organization framework for implementing food marketing recommendations propose reducing children's exposure to marketing (World Health Organization, 2012). While recognizing the limitations of the current evidence base, restricting TV food advertising to children has been proposed as a cost-effective population-level intervention to reduce childhood obesity (Magnus et al., 2009). Currently, there is no statutory regulation of promotional techniques used in child-focused food advertising in Malta, and formal industry self-regulation in Malta has not taken place. In spite of broader initiatives such as the EU Pledge (‘EU Pledge’, 2015), findings indicate that industry self-regulation has not resulted in meaningful improvements in TV food advertising to youth (Harris et al., 2010; Hebden et al., 2011; Dembek et al., 2014) suggesting that voluntary industry-led action might not be the optimal way forward. Furthermore, any regulation—whether imposed or voluntary—would only apply to television broadcasts originating from Malta. In spite of these limitations, statutory regulation of television advertising on national stations during peak hours might shift the balance of advertising in favour of healthier food choices (Dixon et al., 2007).
Conclusion
Malta's nascent legal-regulatory discourse around television advertising requires evidence to support and evaluate any policy measures introduced in the future. This cross-sectional study provides a useful starting point, addressing a gap in the knowledge base around children's exposure to unhealthy food and beverage promotion on television in Malta, and may help contribute to the international landscape of television food advertising. Improved data collection methods and sustained monitoring of television and other audiovisual media platforms including online media will be necessary to guide development of meaningful policy interventions, and provide evidence to support advocacy activity aiming to reduce children's exposure to unhealthy food promotions (Kelly et al., 2013). Further research exploring the link between advertising and outcomes such as consumption behaviour is warranted.
AUTHORS’ CONTRIBUTIONS
D.C. contributed to formulating the research question, designing the study, conducting the literature search, data coding and analysis and writing the article. S.R. contributed to data coding and analysis and to writing the article. C.K., C.G. and J.S. contributed to reviewing the article.
FUNDING
This work was supported by the Malta Government Scholarship Scheme (MGSS), grant MEDE 96/2012/4. The Malta Government Scholarship Scheme had no role in the design, analysis or writing of this article.
ACKNOWLEDGEMENT
The authors would like to acknowledge the assistance of the recording team at the Malta Broadcasting Authority during the data collection stage.