


1-20 of 60601

Journal Article
A novel framework for functional annotation of variants of uncertain significance in ID/ASD risk gene CC2D1A Get access
Human Molecular Genetics, ddae070, https://doi.org/10.1093/hmg/ddae070
Published: 23 April 2024
Image
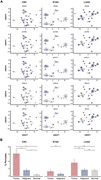
Pericytes are distributed differently in different cancers. (A) Representat... Get access
in
Human Molecular Genetics
>
Predicting prognosis and immunotherapy response in colorectal cancer by pericytes insights from single-cell RNA sequencing
Published: 23 April 2024
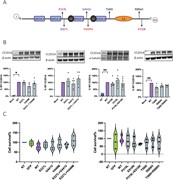
Figure 2
Pericytes are distributed differently in different cancers. (A) Representative marker gene expression in pericyte and myofibroblasts shown by UMAP plot. (B) Composition of the alterations of pericyte in primary tumor, adjacent and normal sample, ns: P > 0.05, “ * ”: P < = 0.05, “ * * ”:
Image
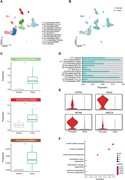
Pericytes are enriched in colorectal cancer tumor tissues. (A) Uniform mani... Get access
in
Human Molecular Genetics
>
Predicting prognosis and immunotherapy response in colorectal cancer by pericytes insights from single-cell RNA sequencing
Published: 23 April 2024
Figure 4
Pericytes are enriched in colorectal cancer tumor tissues. (A) Uniform manifold approximation and projection (UMAP) plots of 16 049 stromal cells color-coded by cell types. (B) Alteration composition in three stromal cell subsets between normal tissue and colorectal cancer tissue. (C) Compare the di
Image
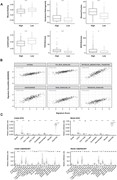
Pericytes promote tumor development and create an immunosuppressive microen... Get access
in
Human Molecular Genetics
>
Predicting prognosis and immunotherapy response in colorectal cancer by pericytes insights from single-cell RNA sequencing
Published: 23 April 2024
Figure 6
Pericytes promote tumor development and create an immunosuppressive microenvironment. (A) Comparing the intrinsic and extrinsic characteristics of tumor tissue between patients with high pericyte levels and those with low pericyte levels. The horizontal line drawn from the first quartile to the thir
Image
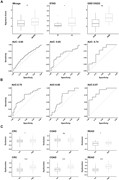
Pericytes level can predictor whether patients will respond to immunotherap... Get access
in
Human Molecular Genetics
>
Predicting prognosis and immunotherapy response in colorectal cancer by pericytes insights from single-cell RNA sequencing
Published: 23 April 2024
Figure 8
Pericytes level can predictor whether patients will respond to immunotherapy. (A) Upper: Pericytes signature expression in different treatment response patients of immunotherapy cohort. The horizontal line drawn from the first quartile to the third quartile on the boxplot represents the median, whic
Image
CC2D1A missense variants do not affect protein stability and cell death. (A... Get access
in
Human Molecular Genetics
>
A novel framework for functional annotation of variants of uncertain significance in ID/ASD risk gene CC2D1A
Published: 23 April 2024
Figure 1
CC2D1A missense variants do not affect protein stability and cell death. (A) Schematic of human CC2D1A protein depicting the four DM14, two coiled coil (CC) and one C2 domains as well as the clinical variants listed in this study. (B) Overexpression of these variants do not affect CC2D1A protein sta
Journal Article
Predicting prognosis and immunotherapy response in colorectal cancer by pericytes insights from single-cell RNA sequencing Get access
Human Molecular Genetics, ddae064, https://doi.org/10.1093/hmg/ddae064
Published: 23 April 2024
Image
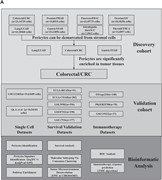
Flowchart of this study. Flowchart of this study. Get access
in
Human Molecular Genetics
>
Predicting prognosis and immunotherapy response in colorectal cancer by pericytes insights from single-cell RNA sequencing
Published: 23 April 2024
Figure 1
Flowchart of this study. Flowchart of this study.
Image
Single cell atlas reveals differences between non-tumour tissue and colorec... Get access
in
Human Molecular Genetics
>
Predicting prognosis and immunotherapy response in colorectal cancer by pericytes insights from single-cell RNA sequencing
Published: 23 April 2024
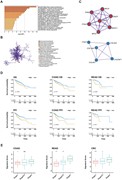
Figure 3
Single cell atlas reveals differences between non-tumour tissue and colorectal cancer tissue. (A) Uniform manifold approximation and projection (UMAP) plots of 117 792 cells color-coded by cell types. (B) Uniform manifold approximation and projection (UMAP) plots of 117 792 cells color-coded by samp
Image
Pericytes linked to poor prognosis in colorectal cancer patients. (A) Perfo... Get access
in
Human Molecular Genetics
>
Predicting prognosis and immunotherapy response in colorectal cancer by pericytes insights from single-cell RNA sequencing
Published: 23 April 2024
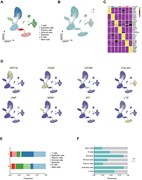
Figure 5
Pericytes linked to poor prognosis in colorectal cancer patients. (A) Performing pathway enrichment analysis on the pericytes-specific expressed genes in colorectal cancer. (B) Performing cluster analysis of pathway on the pericytes-specific expressed genes in colorectal cancer. (C) Performing prote
Image
CC2D1A missense variants do not impair PDE4D5 binding. (A) Myc-tagged PDE4D... Get access
in
Human Molecular Genetics
>
A novel framework for functional annotation of variants of uncertain significance in ID/ASD risk gene CC2D1A
Published: 23 April 2024
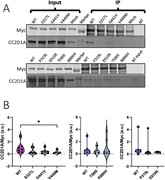
Figure 2
CC2D1A missense variants do not impair PDE4D5 binding. (A) Myc-tagged PDE4D5 protein was immunoprecipitated (IP) from HEK293 cells co-transfected with PDE4D5-Myc and either WT or mutant CC2D1A. (B) Densitometric estimates of the amount of CC2D1A that comes down in each IP (normalized to Myc to accou
Image
Clustering colorectal cancer samples based on pericytes gene expression. (A... Get access
in
Human Molecular Genetics
>
Predicting prognosis and immunotherapy response in colorectal cancer by pericytes insights from single-cell RNA sequencing
Published: 23 April 2024
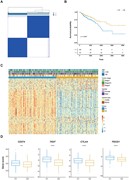
Figure 7
Clustering colorectal cancer samples based on pericytes gene expression. (A) Grouping 373 colorectal cancer patients into two clusters based on the consensus clustering matrix. (B) Kaplan–Meier survival analysis of colorectal cancer patients stratified by two clusters above. P-values were calculated
Image
P319L, T580I and R886H reduce cAMP levels. Compared to WT CC2D1A, the varia... Get access
in
Human Molecular Genetics
>
A novel framework for functional annotation of variants of uncertain significance in ID/ASD risk gene CC2D1A
Published: 23 April 2024
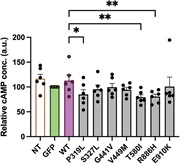
Figure 3
P319L, T580I and R886H reduce cAMP levels. Compared to WT CC2D1A, the variants P319L, T580I and R886H lead to significant reduction in cAMP levels after 6 h of treatment with 50 μM forskolin (Friedman’s test ( P = 0.0013) with Dunn’s multiple comparisons test against WT). Each data point denotes cA
Image
G441V, V449M, P319L, T580I and R886H reduce CREB activation. Compared to WT... Get access
in
Human Molecular Genetics
>
A novel framework for functional annotation of variants of uncertain significance in ID/ASD risk gene CC2D1A
Published: 23 April 2024
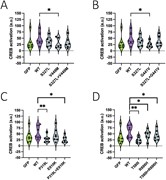
Figure 4
G441V, V449M, P319L, T580I and R886H reduce CREB activation. Compared to WT CC2D1A, the DM14 variants A. V449M, B. G441V, C. P319L and D. T580I exhibit reduced CREB response. CREB activation refers to the ratio of luciferase reading obtained from FSK treated and vehicle (DMSO) treated cells transfec
Journal Article
Correction to: The genetic admixture and assimilation of Ahom: a historic migrant from Thailand to India
Human Molecular Genetics, ddae074, https://doi.org/10.1093/hmg/ddae074
Published: 22 April 2024
Journal Article
Impact of the inaccessible genome on genotype imputation and genome-wide association studies
Human Molecular Genetics, ddae062, https://doi.org/10.1093/hmg/ddae062
Published: 20 April 2024
Image
Number and proportion of genes and exons that are inaccessible. (a) Number ...
in
Human Molecular Genetics
>
Impact of the inaccessible genome on genotype imputation and genome-wide association studies
Published: 20 April 2024
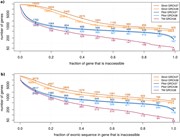
Figure 2
Number and proportion of genes and exons that are inaccessible. (a) Number of genes that are inaccessible by at least a certain proportion of the gene. (b) Number of genes by the proportion of exonic sequence within this gene that is inaccessible. TM = TOPMed. Panel a shows a line graph of the nu
Image
Characteristics of accessible and inaccessible regions. Proportion of varia...
in
Human Molecular Genetics
>
Impact of the inaccessible genome on genotype imputation and genome-wide association studies
Published: 20 April 2024
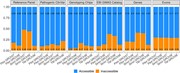
Figure 1
Characteristics of accessible and inaccessible regions. Proportion of variants (for panels “reference panel”, “pathogenic ClinVar”, “genotyping chips”, “EBI GWAS Catalog”) or proportion of base pairs (for panels “genes”, “exons”) that fall into accessible and inaccessible regions as defined by the f
Image
Regional association plots (LocusZoom) of the aspartate aminotransferase ge...
in
Human Molecular Genetics
>
Impact of the inaccessible genome on genotype imputation and genome-wide association studies
Published: 20 April 2024
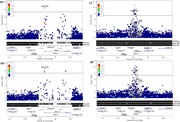
Figure 3
Regional association plots (LocusZoom) of the aspartate aminotransferase genome-wide association results 500 kb around reference SNP rs2477642. The linkage disequilibrium between rs2477462 and all other variants is displayed as r 2 values calculated from the 1000 genome Europeans. Genotyped variant
Image
Functional analysis reveals late onset muscle weakness in double dnajb6...
in
Human Molecular Genetics
>
Mitochondrial abnormalities contribute to muscle weakness in a Dnajb6 deficient zebrafish model
Published: 15 April 2024
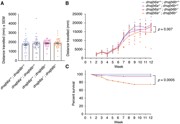
Figure 3
Functional analysis reveals late onset muscle weakness in double dnajb6 mutants. (A) The distance travelled was not significantly different between genotypes at 6 dpf. The swimming of dnajb6 fish was recorded for a period of 10 min and each dot represents an individual fish. Analysis was complet
