


Abstract
Do children conceived after ICSI have similar school performance as children born after IVF?
Children born after ICSI have similar school performance compared to children born after IVF.
Studies concerning the cognitive skills of children born after ICSI have shown diverging results.
This nationwide, register-based cohort study included all singleton children born after ICSI (n = 6953), IVF (n = 11 713) or spontaneous conception (SC) (n = 2 022 995), in Sweden between 1985 and 2006.
Singleton children born after ICSI were identified in national IVF registers, cross-linked with the Medical Birth Register (MBR), the National Patient Register (NPR) and the Swedish Cause of Death Register (CDR) for characteristics and medical outcomes. Data on school performance, parental education and other parental characteristics were obtained through cross-linking to the National School Registry and to Statistics Sweden. The main control group, which consisted of children born after IVF, was identified in the national IVF registries while the second control group, consisting of children born after SC, was identified from the MBR. Simple and multivariable linear regression was used for analysis of continuous variables, and logistic regression was used for the analysis of binary outcomes. Adjustments were made for sex, year of birth, maternal smoking during pregnancy, parental age, parity, parental region of birth, parental level of education and frozen embryo transfer.
In the adjusted analyses, there was no significant difference between ICSI and IVF children for total score (adjusted odds ratios (AORs) 1.03; 95% CI −0.22 to 2.28; P = 0.11), specific subjects, qualifying for secondary school (AOR 1.02; 95% CI 0.82–1.26; P = 0.87) or poor school performance (AOR 0.92; 95% CI 0.75−1.14; P = 0.47). In the third grade, children born after ICSI had a significantly lower chance of passing all of the subtests in Mathematics (AOR 0.89; 0.83–0.96; P = 0.002) and Swedish (AOR 0.92; 0.85–0.99; P = 0.02) compared to children born after SC. When cross-linking children with missing data on school performances (2.1% for ICSI, 2.0% for IVF and 2.3% for SC) with the Cerebral Palsy Follow-up Register (CPUP) for cerebral palsy, 2.7% of ICSI children, 5.7% of IVF children and 1.7% of SC children without registered education were found. When cross-linking children with missing data on school performances with the NPR for mental retardation, 29.9% of ICSI children, 32.6% of IVF children and 35.0% of SC children with missing data were registered under such a diagnosis.
The main limitation was that test scores were missing in a small percentage in both ICSI and IVF children. Although we were able to cross-link this subpopulation with the CPUP and the NPR, these diagnoses only partly explained the missing scores. Other limitations were unmeasured and unknown possible confounders, such as information about infertility diagnoses and indication for ICSI, were not available.
These findings are important to most countries where IVF and ICSI are used since there may be differences in choice of procedure. In recent years, there has been an increasing trend towards using ICSI not only for treatment of male infertility but also when the sperm quality is normal. Our results indicate that the school performance of children born after ICSI is reassuring.
Financial support was received through Sahlgrenska University Hospital (ALFGBG – 70 940), Hjalmar Svensson Research Foundation and Nordforsk, project number 71 450. None of the authors declare any conflict of interest.
N/A
Introduction
The use of ART has increased significantly during the past decades with more than 390 000 children born worldwide annually (Adamson et al., 2018) and the total number of ART children now exceeding 7 million (Adamson et al., 2018). It is well known that ART is associated with an increased risk of perinatal complications, including preterm birth (PTB), low birthweight (LBW) and small for gestational age (SGA) (Helmerhorst et al., 2004; Jackson et al., 2004; McDonald et al., 2009; Pandey et al., 2012; Pinborg et al., 2013). In spontaneously conceived children, studies have shown that PTB and LBW may affect cognitive function negatively (Bhutta et al., 2002; Shenkin et al., 2004).
In 1992, ICSI was introduced (Palermo et al., 1992). ICSI allows treatment for male-factor infertility and can be separated into ICSI with ejaculated sperm or ICSI with non-ejaculated sperm (surgically extracted sperms). ICSI bypasses the natural selection of sperm, can potentially damage the oocyte and may contaminate the cytoplasm of the oocyte with culture media when the sperm is inserted, and these mechanisms have led to a concern about the health and cognitive development of ICSI children (Practice Committee of the American Society for Reproductive Medicine, 2004).
Studies investigating the cognitive function of ICSI children have shown diverging results (Leslie et al., 2003; Place and Englert, 2003; Bonduelle et al., 2005; Ponjaert-Kristoffersen et al., 2005; Knoester et al., 2008; Goldbeck et al., 2009; Mains et al., 2010; Sandin et al., 2013; Kissin et al., 2015; Punamaki et al., 2015; Rumbold et al., 2017; Spangmose et al., 2017). Additionally, many of the studies have suffered from methodological problems, as summarized in a systematic review (Rumbold et al., 2017). This systematic review identified three studies of high quality, reporting comparison between IVF and ICSI. One study reported a small increase in the risk of mental retardation among ICSI children in a subanalysis (Sandin et al., 2013). Two other studies found no significant difference in intelligence quotient (IQ) between ICSI and IVF children (Knoester et al., 2008; Leslie et al., 2003). In addition, no differences in school performance between children born after ICSI compared to children born after IVF were found in a Danish national registry-based cohort study (Spangmose et al. 2017). In this study, we used school performance as an outcome measure of cognitive development since earlier studies have shown a strong correlation between IQ and school performance (Naglieri and Bornstein, 2003).
We established a uniquely large cohort of ICSI children by combining high-quality Swedish registers. The cohort made it possible to explore the school performance in children conceived after ICSI compared to those conceived after standard IVF, which was the primary aim of the study. A secondary aim was to compare the school performance in ICSI children with children born after spontaneous conception (SC). Further, a comparison was made between children born after ICSI with non-ejaculated sperm and children born after ICSI with ejaculated sperm.
Materials and Methods
Data sources
This was a population-based retrospective study including all singletons born after ART and all singletons born after SC, between 1985 and 2006 in Sweden. All children in the study were identified by their personal identification number (PIN), a unique number allocated to each person in Sweden at birth or immigration. Using this number, we were able to cross-link and retrieve information from the following six registers: The Medical Birth Register IVF (MBR/IVF), The Swedish National Quality Register of Assisted Reproduction (Q-IVF), the Swedish Medical Birth Register (MBR), the Swedish National Patient Register (NPR), the Swedish Cause of Death Register (CDR) and the National School Register. Information on type of pregnancy (ART versus SC) and ART technique was obtained from the two IVF registers. Maternal age, parity, birth characteristics and stillbirth/live birth information was obtained from the MBR. Information about mental retardation was obtained from the NPR. Information about deaths was obtained from the CDR. Outcome data (school performance) were obtained from the National School Register. In addition to these registers, the Longitudinal Integration Database for Health Insurance and Labour Market Studies (LISA) and Multi-Generation Register at Statistics Sweden provided information on emigration and parental sociodemographic background factors. Finally, the Cerebral Palsy Follow-up Register (CPUP) provided information about cerebral palsy. After cross-linking, unique serial numbers separate from the national PIN-codes were given to all participants, providing full anonymity.
Linkage errors occurred in 2–3% between the IVF registries and MBR. Reasons for these errors were wrong PIN, change of PIN, Swedish women moving abroad and not delivering in Sweden, etc. (Ludvigsson et al., 2009).
MBR/IVF and Q-IVF
Since the birth of the first IVF child in Sweden in 1982, and until 2006, data on all assisted reproductive treatments were reported to the Swedish National Board of Health and Welfare. Between 1982 and 2006, only clustered data were reported for IVF cycles. In addition, at three times during this period, in collaboration with The Swedish National Board of Health and Welfare, data concerning deliveries after IVF with full identification were collected for research reasons. For the purpose of this study and since this file is stored at MBR, it was decided to name this file MBR/IVF. Thus, full identifiable data concerning all deliveries were available for the whole study period. In 2007, the National Quality Register for Assisted Reproduction (Q-IVF) was established and funded by the Swedish Association of Local Authorities and Regions (SKL). This register includes results of all IVF cycles that started in Sweden and has full patient identification, i.e. PIN codes. All IVF clinics, public as well as private, report treatment characteristics and results to Q-IVF, and the results are public and posted on the Q-IVF website (www.qivf.se). All patients are informed about the Q-IVF and may choose not to have their data included, although this is very rare.
MBR
The MBR was established in 1973 and covers nearly all births (99%) in Sweden with very few exceptions (Cnattingius et al., 1990). It contains data on pregnancy, delivery and the neonatal period. Standardized medical records are kept at all antenatal clinics, delivery wards and paediatric examinations of the newborns. The quality of MBR has been evaluated three times, in 1976, in 1988 (Cnattingius et al., 1990) and in 2001 (www.socialstryrelsen.se/publikationer2002/2002-112-4). The register is considered to have a high degree of validity.
NPR
The NPR is nationwide and includes diagnoses on all patients admitted to in-hospital care in Sweden since 1987. From 2001, the NPR has also covered diagnoses on patients at outpatient visits treated by both private and public caregivers. Primary care is not yet covered in the NPR (Ludvigsson et al., 2011). In the present study, we used the International Classification of Diseases (ICD) 9 codes during the period 1987–1996 and ICD 10 codes from 1997 for mental disability (ICD 9 codes 317, 318 and 319; ICD 10 codes F 71, 72, 73, 78 and 79).
CDR
The CDR includes all Swedish citizens who have died since 1952, either in the country or abroad, and who were registered in Sweden at the time of death (www.socialstyrelsen.se/register/dodsorsaksregistret).
National School Register
The National School Register is administered jointly by the Swedish School Authority (Skolverket) and Statistics Sweden. The database encompasses information on individual educational achievements (grades by subject as well as summary scores) for all students graduating from ninth grade in public schools since 1988. Non-public schools, which comprise fewer than 5% of all Swedish schools, have been included since 1993. The database also contains information about national tests. In third grade, the tests started in 2010. The quality of the data in the National School Register is high and summary statistics are published regularly (http://www.skolverket.se).
Statistics Sweden
Statistics Sweden is the central authority for recording statistics on all Swedish citizens. The LISA contains information such as highest educational level, socioeconomic class, disposable income, immigration and emigration. The Swedish Multi-Generation Register includes all individuals born in Sweden since 1932, registered as living in Sweden at some point since 1960, and their parents (http://www.scb.se).
CPUP
The CPUP has been a national quality register in Sweden since 2005. Since 2011, the register includes not only information about children 0–18 years, but also adults with cerebral palsy (www.socialstyrelsen.se). The CPUP contains information about diagnoses, drugs, in-hospital care and specialized outpatient care. According to a report from the National Board of Health and Welfare in 2015, the register covered 90% of children with cerebral palsy, born between 2002 and 2009 (www.socialstyrelsen.se).
Study population
During the time period 1 January 1985 and 31 December 2015, 3 228 529 children (stillbirths excluded) were born in Sweden. The reason for not including children born 1982–1984 was that very few ART children were born during these years (only seven) and the Swedish National Board of Health and Welfare had some hesitation to provide us with the total birth cohorts during the whole period. We therefore decided to exclude these 3 years.
We excluded 87 838 multiples, 10 585 infant deaths, 4244 deaths during adolescence, 92 241 emigrated children, 941 067 who were too young (born after 2006) and 45 951 children who had no registration at the Swedish School Authority. Furthermore, 4942 children had a registered education, but information about total mean score in ninth and third grades was missing. Therefore, they were also excluded. In total, 1 186 868 children were therefore excluded.
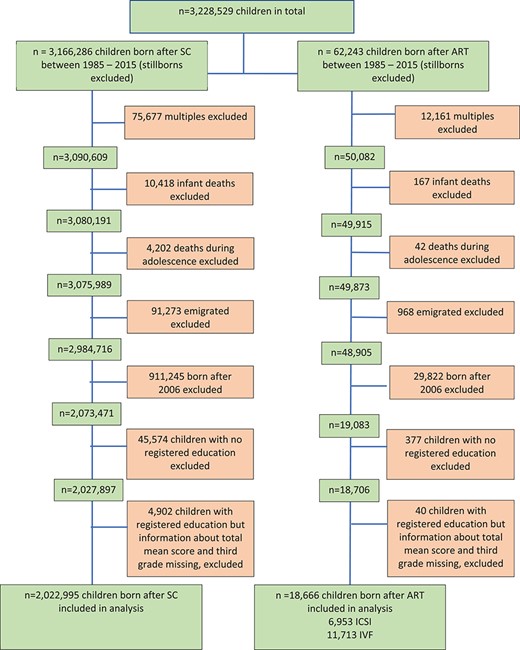
Consequently, 2 041 661 children were included in the study (Fig. 1). They represent two separate cohorts: all singletons registered with the Swedish School Authority in the ninth grade and for children too young to have completed 9 years in school, all singletons registered with the Swedish School Authority in the third grade.
Flow-chart of children included in the study.
Exposure
We classified mode of conception as ART or SC. ART was further classified into IVF or ICSI. Additionally, ICSI was classified according to the source of sperm, ejaculated or non-ejaculated sperm.
Outcomes
The primary outcome was school performance after the completion of 9 years in regular Swedish school, based on a mean total score of 16 subjects (0–320), and percentiles were used for confirmation. Secondary outcomes were the mean school grade (0–20) of specific subjects (Mathematics, Swedish, English and Physical Education), ‘qualified to enter secondary school’ (approved in Mathematics, Swedish and English) and ‘poor school performance’ (total score < 160). Lastly, for the children too young to have completed 9 years in school, we obtained results of national tests from the third grade.
In Sweden, children start school in the fall of the year of their seventh birthday. The education of children up to adolescence is compulsory, and primary school is 9 years in total. In the third, sixth and ninth grade, all students do national tests. The national tests in the third grade started in 2010.
In the ninth grade, during the study period, each student receives a total school score based on 16 subjects. The scores are set relative to the performance for each year, which makes the relative performance comparable over time. Each subject has a score between 0 and 20; thus, the total score could range from 0 to 320. For Mathematics, Swedish, English and Physical Education the score is between 0 and 20. Mean school scores per study group were calculated. Since the distribution of school grades was skewed towards higher scores, school scores were categorized in percentiles, i.e. all subjects were ranked according to school grades from 1 to 100. This allowed comparison between birth cohorts without interference from changes in grading system (Lambe et al., 2006; Svensson et al., 2011; Ahlsson et al., 2015; Shen et al., 2016). Between 1997 and 2012, the grade system consisted of four different grades (fail = 0 points, pass = 10 points, pass with distinction = 15 points and pass with special distinction = 20 points). From 2013, the grade system consisted of six different grades (F = 0 points, E = 10 points, D = 12.5 points, C = 15 points, B = 17.5 points and A = 20 points). F meant fail; E to A were all passes. In total, 1 196 025 (SC 1 192 111 and ART 3914) out of 1 509 046 (SC 1 500 709 and ART 8337) children in this study used the first system described. It was not possible to separate between ‘fail’ or ‘not participated’ as both groups of students received a total score of 0 points. To qualify for secondary school, a passing grade in the core subjects of Mathematics, Swedish and English is required. We therefore also assessed the percent of students who passed in these three subjects. Furthermore, we assessed ‘poor school performance’ that we defined as a total score below 160, i.e. the mean grade of the individual was below ‘pass’ (Lambe et al., 2006).
Sociodemographic and perinatal characteristics of children (with registered education) in ninth grade and their parents.
| Singletons n = 1 509 046 | |||||
|---|---|---|---|---|---|
| Characteristics | All ICSI | Ejaculated ICSI | Non-ejaculated ICSI | IVF | SC |
| N = 2571 | N = 2440 | N = 131 | N = 5766 | N = 1 500 709 | |
| Child | |||||
| Calendar year at birth*, n (%) | |||||
| 1985–1990 | 1 (0.0) | 1 (0.0) | 0 (0.0) | 425 (7.4) | 594 983 (39.7) |
| 1991–1996 | 513 (20.0) | 500 (20.5) | 13 (9.9) | 2976 (51.6) | 598 519 (39.9) |
| 1997–2001 | 2057 (80.0) | 1939 (79.5) | 118 (90.1) | 2365 (41.0) | 307 204 (20.5) |
| 2002–2006 | 0 (0.0) | 0 (0.0) | 0 (0.0) | 0 (0.0) | 3 (0.0) |
| Birthweight, n (%) | |||||
| Low birth weight < 2500 g | 158 (6.2) | 154 (6.4) | 4 (3.1) | 419 (7.3) | 45 428 (3.0) |
| Very low birth weight <1500 g | 34 (1.3) | 33 (1.4) | 1 (0.8) | 89 (1.6) | 6005 (0.4) |
| Missing | 13 (0.5) | 13 (0.5) | 0 (0.0) | 22 (0.4) | 2989 (0.2) |
| Gestational age, n (%) | |||||
| Post term, ≥42 wk. | 213 (8.3) | 203 (8.3) | 10 (7.6) | 379 (6.6) | 107 017 (7.1) |
| Term, 37 + 0–41 + 6 wk. | 2133 (83.0) | 2027 (83.1) | 106 (80.9) | 4826 (83.8) | 1 319 721 (88.1) |
| Preterm birth, <37 wk | 223 (8.7) | 208 (8.5) | 15 (11.4) | 552 (9.6) | 71 777 (4.8) |
| Very preterm birth, < 32 wk. | 35 (1.4) | 33 (1.36) | 2 (1.5) | 92 (1.6) | 7512 (0.5) |
| Extremely preterm birth, < 28 wk. | 9 (0.4) | 8 (0.3) | 1 (0.8) | 21 (0.4) | 1511 (0.1) |
| Missing | 2 (0.1) | 2 (0.1) | 0 (0.0) | 9 (0.2) | 2194 (0.1) |
| Birth defects, n (%) | 107 (4.2) | 103 (4.2) | 4 (3.1) | 239 (4.1) | 51 413 (3.4) |
| Apgar score at 5 min | |||||
| 0–3 | 4 (0.2) | 4 (0.2) | 0 (0.0) | 18 (0.3) | 3023 (0.2) |
| 4–6 | 36 (1.4) | 33 (1.4) | 3 (2.3) | 49 (0.9) | 9463 (0.6) |
| Missing | 16 (0.6) | 15 (0.6) | 1 (0.8) | 48 (0.8) | 20 919 (1.4) |
| Maternal | |||||
| Age at birth, years mean (SD) | 33.2 (4.1) | 33.3 (4.1) | 32.6 (4.0) | 34.3 (3.7) | 28.9(5.1) |
| Parity* | |||||
| 1 | 2015 (78.4) | 1924 (78.9) | 91 (69.5) | 4339 (75.3) | 617 410 (41.1) |
| 2 | 477 (18.6) | 442 (18.1) | 35 (26.7) | 1191 (20.7) | 541 608 (36.1) |
| 3 | 55 (2.1) | 51 (2.1) | 4 (3.1) | 180 (3.1) | 238 464 (15.9) |
| 4 | 21 (0.8) | 20 (0.8) | 1 (0.8) | 37 (0.6) | 71 532 (4.8) |
| ≥5 | 3 (0.1) | 3 (0.1) | 0 (0.0) | 19 (0.3) | 31 695 (2.1) |
| Smoking during pregnancy (yes), n (%) | 175 (7.4) | 170 (7.6) | 5 (4.1) | 721 (13.4) | 302 626 (21.5) |
| Missing | 206 (8.0) | 196 (8.0) | 10 (7.6) | 374 (6.5) | 93 048 (6.2) |
| Region of birth, n (%) | |||||
| Sweden | 2265 (88.1) | 2153 (88.2) | 112 (85.5) | 5138 (89.1) | 1 305 189 (87.0) |
| Nordic outside Sweden | 64 (2.5) | 64 (2.6) | 0 (0.0) | 187 (3.2) | 49 285 (3.3) |
| European outside Nordic Region | 127 (4.9) | 118 (4.8) | 9 (6.9) | 246 (4.3) | 61 298 (4.1) |
| African origin | 13 (0.5) | 11 (0.5) | 2 (1.5) | 26 (0.5) | 15 195 (1.0) |
| Asian origin | 88 (3.4) | 81 (3.3) | 7 (5.3) | 118 (2.1) | 53 698 (3.6) |
| Other | 14 (0.5) | 13 (0.5) | 1 (0.8) | 50 (0.9) | 15 955 (1.1) |
| Missing | 0 (0.0) | 0 (0.0) | 0 (0.0) | 1 (0.0) | 89 (0.0) |
| Educational level, n (%) | |||||
| ≤9 y | 118 (4.6) | 107 (4.4) | 11 (8.4) | 363 (6.3) | 147 519 (9.8) |
| 10–12 y | 1144 (44.5) | 1079 (44.5) | 65 (49.6) | 2586 (44.9) | 752 643 (50.2) |
| Higher education <3 y | 529 (20.6) | 506 (20.8) | 23 (17.6) | 1140 (19.8) | 239 376 (16.0) |
| Higher education ≥3 y | 778 (30.3) | 746 (30.6) | 32 (24.4) | 1672 (29.0) | 359 372 (24.0) |
| Missing | 2 (0.0) | 2 (0.0) | 0 (0.0) | 5 (0.1) | 1799 (0.1) |
| Highest socioeconomic level during school period of child | |||||
| Low class | 949 (40.3) | 889 (39.8) | 60 (48.8) | 2083 (41.2) | 653 608 (50.3) |
| Middle class | 402 (17.1) | 383 (17.1) | 19 (15.5) | 824 (16.3) | 180 529 (13.9) |
| High class | 1007 (42.7) | 963 (43.1) | 44 (35.8) | 2150 (42.5) | 464 355 (35.8) |
| Missing | 213 (8.2) | 205 (8.4) | 8 (6.1) | 709 (12.3) | 202 217 (13.5) |
| Paternal | |||||
| Age at birth, years, mean (SD) | 36.4 (5.7) | 36.4 (5.7) | 37.2 (6.3) | 36.4 (5.2) | 31.8 (6.0) |
| Region of birth, n (%) | |||||
| Sweden | 2234 (86.9) | 2130 (87.3) | 104 (79.4) | 5185 (90.0) | 1 288 277 (86.2) |
| Nordic outside Sweden | 76 (3.0) | 76 (3.1) | 0 (0.0) | 153 (2.7) | 43 781 (2.9) |
| European outside Nordic Region | 148 (5.8) | 132 (5.4) | 16 (12.2) | 231 (4.0) | 70 314 (4.7) |
| African origin | 10 (0.4) | 9 (0.4) | 1 (0.8) | 36 (0.6) | 20 319 (1.4) |
| Asian origin | 89 (3.5) | 80 (3.3) | 9 (6.9) | 113 (2.0) | 54 019 (3.6) |
| Other | 13 (0.5) | 12 (0.5) | 1 (0.8) | 45 (0.8) | 18 056 (1.2) |
| Missing | 0 (0.0) | 1 (0.0) | 0 (0.0) | 3 (0.1) | 5943 (0.4) |
| Highest educational level, n (%) | |||||
| ≤9 y | 297 (11.6) | 277 (11.4) | 20 (15.3) | 775 (13.5) | 250 007 (16.8) |
| 10–12 y | 1233 (48.1) | 1167 (50.0) | 66 (50.4) | 2677 (46.5) | 785 479 (52.7) |
| Higher education <3 y | 421 (16.4) | 401 (16.5) | 20 (15.3) | 983 (17.1) | 211 237 (14.2) |
| Higher education ≥3 y | 614 (23.9) | 589 (24.2) | 25 (19.1) | 1318 (22.9) | 242,22 (16.3) |
| Missing | 0 (0.0) | 6 (0.2) | 0 (0.0) | 13 (0.2) | 11 264 (0.8) |
| Parents together | |||||
| Parental disposable income, mean (SD) during school period of child | 597 950 (431231) | 597 700 (432662) | 602 607 (405200) | 548 815 (446288) | 456 169 (1274040) |
ICSI, intracytoplasmic sperm injection; IVF, in-vitro fertilization; SC, spontaneous conception; SD, standard deviation; wk, week; n, number
*No missing data for calendar year at birth and parity
| Singletons n = 1 509 046 | |||||
|---|---|---|---|---|---|
| Characteristics | All ICSI | Ejaculated ICSI | Non-ejaculated ICSI | IVF | SC |
| N = 2571 | N = 2440 | N = 131 | N = 5766 | N = 1 500 709 | |
| Child | |||||
| Calendar year at birth*, n (%) | |||||
| 1985–1990 | 1 (0.0) | 1 (0.0) | 0 (0.0) | 425 (7.4) | 594 983 (39.7) |
| 1991–1996 | 513 (20.0) | 500 (20.5) | 13 (9.9) | 2976 (51.6) | 598 519 (39.9) |
| 1997–2001 | 2057 (80.0) | 1939 (79.5) | 118 (90.1) | 2365 (41.0) | 307 204 (20.5) |
| 2002–2006 | 0 (0.0) | 0 (0.0) | 0 (0.0) | 0 (0.0) | 3 (0.0) |
| Birthweight, n (%) | |||||
| Low birth weight < 2500 g | 158 (6.2) | 154 (6.4) | 4 (3.1) | 419 (7.3) | 45 428 (3.0) |
| Very low birth weight <1500 g | 34 (1.3) | 33 (1.4) | 1 (0.8) | 89 (1.6) | 6005 (0.4) |
| Missing | 13 (0.5) | 13 (0.5) | 0 (0.0) | 22 (0.4) | 2989 (0.2) |
| Gestational age, n (%) | |||||
| Post term, ≥42 wk. | 213 (8.3) | 203 (8.3) | 10 (7.6) | 379 (6.6) | 107 017 (7.1) |
| Term, 37 + 0–41 + 6 wk. | 2133 (83.0) | 2027 (83.1) | 106 (80.9) | 4826 (83.8) | 1 319 721 (88.1) |
| Preterm birth, <37 wk | 223 (8.7) | 208 (8.5) | 15 (11.4) | 552 (9.6) | 71 777 (4.8) |
| Very preterm birth, < 32 wk. | 35 (1.4) | 33 (1.36) | 2 (1.5) | 92 (1.6) | 7512 (0.5) |
| Extremely preterm birth, < 28 wk. | 9 (0.4) | 8 (0.3) | 1 (0.8) | 21 (0.4) | 1511 (0.1) |
| Missing | 2 (0.1) | 2 (0.1) | 0 (0.0) | 9 (0.2) | 2194 (0.1) |
| Birth defects, n (%) | 107 (4.2) | 103 (4.2) | 4 (3.1) | 239 (4.1) | 51 413 (3.4) |
| Apgar score at 5 min | |||||
| 0–3 | 4 (0.2) | 4 (0.2) | 0 (0.0) | 18 (0.3) | 3023 (0.2) |
| 4–6 | 36 (1.4) | 33 (1.4) | 3 (2.3) | 49 (0.9) | 9463 (0.6) |
| Missing | 16 (0.6) | 15 (0.6) | 1 (0.8) | 48 (0.8) | 20 919 (1.4) |
| Maternal | |||||
| Age at birth, years mean (SD) | 33.2 (4.1) | 33.3 (4.1) | 32.6 (4.0) | 34.3 (3.7) | 28.9(5.1) |
| Parity* | |||||
| 1 | 2015 (78.4) | 1924 (78.9) | 91 (69.5) | 4339 (75.3) | 617 410 (41.1) |
| 2 | 477 (18.6) | 442 (18.1) | 35 (26.7) | 1191 (20.7) | 541 608 (36.1) |
| 3 | 55 (2.1) | 51 (2.1) | 4 (3.1) | 180 (3.1) | 238 464 (15.9) |
| 4 | 21 (0.8) | 20 (0.8) | 1 (0.8) | 37 (0.6) | 71 532 (4.8) |
| ≥5 | 3 (0.1) | 3 (0.1) | 0 (0.0) | 19 (0.3) | 31 695 (2.1) |
| Smoking during pregnancy (yes), n (%) | 175 (7.4) | 170 (7.6) | 5 (4.1) | 721 (13.4) | 302 626 (21.5) |
| Missing | 206 (8.0) | 196 (8.0) | 10 (7.6) | 374 (6.5) | 93 048 (6.2) |
| Region of birth, n (%) | |||||
| Sweden | 2265 (88.1) | 2153 (88.2) | 112 (85.5) | 5138 (89.1) | 1 305 189 (87.0) |
| Nordic outside Sweden | 64 (2.5) | 64 (2.6) | 0 (0.0) | 187 (3.2) | 49 285 (3.3) |
| European outside Nordic Region | 127 (4.9) | 118 (4.8) | 9 (6.9) | 246 (4.3) | 61 298 (4.1) |
| African origin | 13 (0.5) | 11 (0.5) | 2 (1.5) | 26 (0.5) | 15 195 (1.0) |
| Asian origin | 88 (3.4) | 81 (3.3) | 7 (5.3) | 118 (2.1) | 53 698 (3.6) |
| Other | 14 (0.5) | 13 (0.5) | 1 (0.8) | 50 (0.9) | 15 955 (1.1) |
| Missing | 0 (0.0) | 0 (0.0) | 0 (0.0) | 1 (0.0) | 89 (0.0) |
| Educational level, n (%) | |||||
| ≤9 y | 118 (4.6) | 107 (4.4) | 11 (8.4) | 363 (6.3) | 147 519 (9.8) |
| 10–12 y | 1144 (44.5) | 1079 (44.5) | 65 (49.6) | 2586 (44.9) | 752 643 (50.2) |
| Higher education <3 y | 529 (20.6) | 506 (20.8) | 23 (17.6) | 1140 (19.8) | 239 376 (16.0) |
| Higher education ≥3 y | 778 (30.3) | 746 (30.6) | 32 (24.4) | 1672 (29.0) | 359 372 (24.0) |
| Missing | 2 (0.0) | 2 (0.0) | 0 (0.0) | 5 (0.1) | 1799 (0.1) |
| Highest socioeconomic level during school period of child | |||||
| Low class | 949 (40.3) | 889 (39.8) | 60 (48.8) | 2083 (41.2) | 653 608 (50.3) |
| Middle class | 402 (17.1) | 383 (17.1) | 19 (15.5) | 824 (16.3) | 180 529 (13.9) |
| High class | 1007 (42.7) | 963 (43.1) | 44 (35.8) | 2150 (42.5) | 464 355 (35.8) |
| Missing | 213 (8.2) | 205 (8.4) | 8 (6.1) | 709 (12.3) | 202 217 (13.5) |
| Paternal | |||||
| Age at birth, years, mean (SD) | 36.4 (5.7) | 36.4 (5.7) | 37.2 (6.3) | 36.4 (5.2) | 31.8 (6.0) |
| Region of birth, n (%) | |||||
| Sweden | 2234 (86.9) | 2130 (87.3) | 104 (79.4) | 5185 (90.0) | 1 288 277 (86.2) |
| Nordic outside Sweden | 76 (3.0) | 76 (3.1) | 0 (0.0) | 153 (2.7) | 43 781 (2.9) |
| European outside Nordic Region | 148 (5.8) | 132 (5.4) | 16 (12.2) | 231 (4.0) | 70 314 (4.7) |
| African origin | 10 (0.4) | 9 (0.4) | 1 (0.8) | 36 (0.6) | 20 319 (1.4) |
| Asian origin | 89 (3.5) | 80 (3.3) | 9 (6.9) | 113 (2.0) | 54 019 (3.6) |
| Other | 13 (0.5) | 12 (0.5) | 1 (0.8) | 45 (0.8) | 18 056 (1.2) |
| Missing | 0 (0.0) | 1 (0.0) | 0 (0.0) | 3 (0.1) | 5943 (0.4) |
| Highest educational level, n (%) | |||||
| ≤9 y | 297 (11.6) | 277 (11.4) | 20 (15.3) | 775 (13.5) | 250 007 (16.8) |
| 10–12 y | 1233 (48.1) | 1167 (50.0) | 66 (50.4) | 2677 (46.5) | 785 479 (52.7) |
| Higher education <3 y | 421 (16.4) | 401 (16.5) | 20 (15.3) | 983 (17.1) | 211 237 (14.2) |
| Higher education ≥3 y | 614 (23.9) | 589 (24.2) | 25 (19.1) | 1318 (22.9) | 242,22 (16.3) |
| Missing | 0 (0.0) | 6 (0.2) | 0 (0.0) | 13 (0.2) | 11 264 (0.8) |
| Parents together | |||||
| Parental disposable income, mean (SD) during school period of child | 597 950 (431231) | 597 700 (432662) | 602 607 (405200) | 548 815 (446288) | 456 169 (1274040) |
ICSI, intracytoplasmic sperm injection; IVF, in-vitro fertilization; SC, spontaneous conception; SD, standard deviation; wk, week; n, number
*No missing data for calendar year at birth and parity
Finally, we obtained results from national tests in third grade. These tests contain seven or eight subtests in Mathematics and Swedish. To pass the national tests, passing all the subtests are required; thus, we assessed the number of children who passed all subtests in Mathematics and Swedish.
Covariates
Covariates of interest, identified in the literature and associated with school performance, (Ahlsson et al., 2015; Svensson et al., 2011) were collected from the registers and used in all regression analyses. Child characteristics were sex and year of birth (continuous variable). Pregnancy characteristics included maternal age (≤24, 25–34, 35–44, ≥45 years), parity (1, 2, 3, 4, ≥5), paternal age (≤24, 25–34, 35–44, ≥45 years) at the birth of the child and maternal smoking during pregnancy (yes or no). Family characteristics were region of birth of the parents (Sweden, Nordic outside Sweden, European outside Nordic Region, African origin, Asian origin, other origin) and parental education (≤9, 10–12, higher education <3, higher education >3 years). We also adjusted for frozen embryo transfer in the comparisons between the ART groups to account for the increasing use of cryopreservation in ART. In an additional analysis, we adjusted for vanishing twin to account for the increasing use of single embryo transfer. We did not control for Apgar score, birth defects, birth weight, gestational age, induced births or complicated births as these are potential causal pathway characteristics.
Ethical approval
Permission was given from the Regional Ethical Committee at the University of Gothenburg (Dnr 214-12, T422-12, T516-15, T233-16, T300-17, T1144-17, T121-18).
Statistical analysis
Descriptive statistics were given by mean and SD for continuous variables, measured in scores and percentiles, and by number (n) and percent for categorical variables. Simple and multivariable linear regression was used for the analysis of percentiles, and logistic regression was used for the analysis of binary outcomes. A fixed set of covariates was selected based on medical knowledge. Crude and adjusted mean differences and 95% CI in percentiles of school grades and odds ratio (OR) and adjusted OR (AOR) with 95% CI for qualified to enter secondary school and poor school performance are presented. No adjustment for the same mother giving birth more than once was performed. This was motivated by small cluster sizes, normally only 1–3 children per mother, and having a very large number of women, which lowers the effect of intra-cluster correlation on the standard errors. Thus, multilevel models were not selected to avoid instabilities in the estimation process. Significance level was set to 5%. Analyses were conducted using STATA Version 15.1.
Results
In total, 2 041 661 children were included in the study (Fig. 1). Of these, 18 666 children were born after ART (including 35 children who were born after oocyte donation) and 2 022 995 children were born after SC. In the main analysis, children born after ICSI (n = 6953) were compared with children born after IVF (11 713). In a secondary analysis, ICSI children (n = 6953) were compared with children born after SC (n = 2 022 995). Finally, children born after non-ejaculated ICSI (n = 462) were compared with children born after ejaculated ICSI (n = 6491).
The ninth grade
Mean maternal age was 33.2 years for ICSI mothers and 34.3 years for IVF mothers. Higher education ≥3 years and high socioeconomic class characterized 30.3% and 42.7% of ICSI mothers and 29.0% and 42.5% of IVF mothers, respectively. Smoking occurred in 7.4% of ICSI mothers whereas the corresponding figure for IVF mothers was 13.4%. Children born after ICSI and IVF had similar risks of PTB, very PTB, LBW and very LBW (Table I).
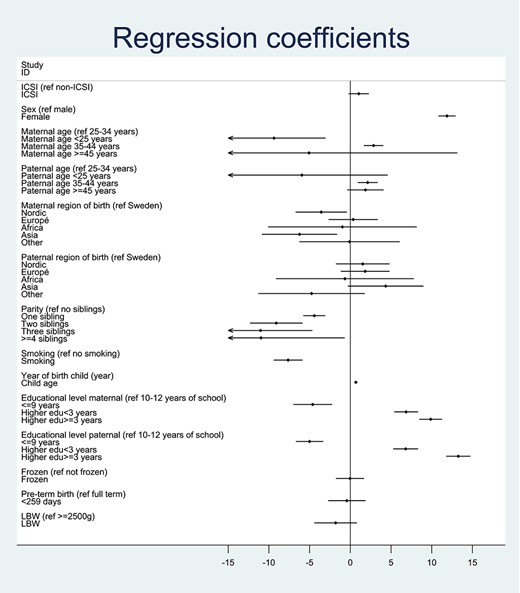
In the crude analyses, children born after ICSI had significantly higher total mean scores and scores in the specific subjects compared to children born after IVF (Table III). ICSI children also had a significantly lower risk of poor performance compared to children born after IVF (Table IV). After adjustment, however, there was no significant difference between ICSI and IVF children neither for total score nor for specific subjects. The adjusted mean difference (percentiles) for total score was 1.03 (95% CI −0.22 to 2.28; P = 0.11) (Table III). Furthermore, there was no difference between the groups regarding qualifying for secondary school (AOR 1.02; 95% CI 0.82–1.26; P = 0.87) or poor school performance (AOR 0.92; 95% CI 0.75–1.14; P = 0.47) (Table IV). Figure 2 illustrates regression coefficients for covariates in the adjusted analyses for total scores (percentiles). Thus, Fig. 2 shows the contribution of each covariate, independent of the other variables.
When comparing ICSI children with SC children, crude mean total score and mean scores for specific subjects in ninth grade were significantly higher (Table III). Furthermore, ICSI children had a significantly higher proportion of children qualifying for secondary school and a significantly lower proportion of children with poor school performance than children born after SC (Table IV). In the adjusted analyses, however, there were no significant differences between the two groups in any of the adjusted analyses (Tables III and IV).
Adjusted mean difference in total scores (percentiles) for regression coefficients included in the model. LBW and PTB were not included as covariates in the models since they were considered to be mediators.
Children born after ICSI with non-ejaculated sperm had significantly lower results in Swedish (adjusted mean difference [percentiles] −5.07; 95% CI −9.41 to −0.74; P = 0.02) and English (adjusted mean difference [percentiles] −5.53; 95% CI −10.10 to −0.96; P = 0.02) (Table III) and a significantly higher risk of poor school performance than children born after ICSI with ejaculated sperm (AOR 1.87; 95% CI 1.01–3.45; P = 0.045) (Table IV). There were no significant differences between the groups regarding mean total score, mean scores in other specific subjects or qualifying for secondary school.
The third grade
Mean maternal age was 33.5 years for ICSI mothers and 34.5 years for IVF mothers. Higher education ≥3 years characterized 37.7% of ICSI mothers and 43.7% of IVF mothers. Smoking occurred in 4.4% of ICSI mothers and 4.2% of IVF mothers. Children born after ICSI and IVF had similar risks of PTB, very PTB, LBW and very LBW (Table II).
There was no significant difference between children born after ICSI and IVF regarding passing all national subtests in mathematics (AOR 0.98; 95% CI 0.89–1.08; P = 0.71) and Swedish (AOR 0.96 1.0; 95% CI 0.87–1.07; P = 0.49) (Table V). Compared with children born after SC, ICSI children in the third grade had a significantly higher chance of passing all the subtests in mathematics and Swedish in the crude analyses (Table V). In the adjusted analyses, however, children born after ICSI had a significantly lower chance of passing all the subtests in Mathematics (AOR 0.89; 0.83–0.96; P = 0.002) and Swedish (AOR 0.92; 0.85–0.99; P = 0.02) compared to children born after SC (Table V).
There was no significant difference between children born after ICSI with non-ejaculated sperm compared with children born after ICSI with ejaculated sperm in the national tests in third grade (Table V).
Since the occurrence of vanishing twin, a phenomenon when two embryos implant but only one child is born, has been found to negatively affect neonatal outcome in the surviving singleton (Pinborg et al., 2005; Sazonova et al., 2011), we adjusted also for this variable. Adding vanishing twin as a possible confounder however changed the AOR and 95% CI only marginally (data not shown).
Analysis of children with no registered education
There were 45 951 children without registered education by the Swedish School Authority (Fig. 1). The sociodemographic and perinatal
Sociodemographic and perinatal characteristics of children (with registered education) in third grade and their parents.
| Singletons n = 532 615 | |||||
|---|---|---|---|---|---|
| Characteristics | All ICSI N = 4382 | Ejaculated ICSI N = 4051 | Non-ejaculated ICSI N = 331 | IVF N = 5947 | Spontaneous conception N = 522 286 |
| Child | |||||
| Calendar year at birth*, n (%) | |||||
| 1997–2001** | 526 (12.0) | 485 (12.0) | 41 (12.4) | 637 (10.7) | 82 158 (15.7) |
| 2002–2006 | 3856 (88.0) | 3566 (88.0) | 290 (87.6) | 5310 (89.3) | 440 128 (84.3) |
| Birth weight, n (%) | |||||
| Low birth weight <2500 g | 207 (4.7) | 197 (4.9) | 10 (3.0) | 326 (5.5) | 15 019 (2.9) |
| Very low birth weight <1500 g | 40 (0.9) | 36 (0.9) | 4 (1.2) | 66 (1.1) | 2340 (0.5) |
| Missing | 11 (0.3) | 9 (0.2) | 2 (0.6) | 21 (0.4) | 1397 (0.3) |
| Gestational age, n (%) | |||||
| Post term, ≥42 wk. | 339 (7.7) | 302 (7.5) | 37 (11.2) | 432 (7.3) | 38 758 (7.4) |
| Term, 37–41 wk. | 3755 (85.7) | 3480 (86.0) | 275 (83.1) | 5052 (85.0) | 458 475 (87.8) |
| Preterm birth, <37 wk. | 286 (6.5) | 267 (6.6) | 19 (5.7) | 461 (7.8) | 24 718 (4.2) |
| Very preterm birth, <32 wk. | 44 (1.0) | 40 (1.0) | 4 (1.2) | 79 (1.3) | 2990 (0.4) |
| Extremely preterm birth <28 wk | 14 (0.3) | 13 (0.3) | 1 (0.3) | 24 (0.4) | 816 (0.2) |
| Missing | 2 (0.0) | 2 (0.0) | 0 (0.0) | 2 (0.0) | 335 (0.1) |
| Birth defects, n (%) | 185 (4.2) | 173 (4.3) | 12 (3.6) | 263 (4.4) | 10 210 (2.0) |
| Apgar score at 5 min | |||||
| 0–3 | 11 (0.3) | 11 (0.3) | 0 (0.0) | 11 (0.2) | 712 (0.1) |
| 4–6 | 50 (1.2) | 47 (1.2) | 3 (0.9) | 63 (1.1) | 4060 (0.8) |
| Missing | 19 (0.4) | 16 (0.4) | 3 (0.9) | 34 (0.6) | 3042 (0.6) |
| Maternal | |||||
| Age at birth, years mean (SD) | 33.5 (4.1) | 33.6 (4.1) | 33.1 (4.2) | 34.5 (4.0) | 30.5 (5.0) |
| Parity* | |||||
| 1 | 3182 (72.6) | 2953 (72.9) | 229 (69.2) | 4475 (75.3) | 230 401 (44.1) |
| 2 | 948 (21.6) | 870 (21.5) | 78 (23.6) | 1191 (20.0) | 190 655 (36.5) |
| 3 | 209 (4.8) | 191 (4.7) | 18 (5.4) | 198 (3.3) | 70 787 (13.6) |
| 4 | 30 (0.7) | 24 (0.6) | 6 (1.8) | 65 (1.1) | 20 050 (3.8) |
| ≥5 | 13 (0.3) | 13 (0.3) | 0 (0.0) | 18 (0.3) | 10 393 (2.0) |
| Smoking during pregnancy (yes), n (%) | 183 (4.4) | 166 (4.4) | 17 (5.5) | 233 (4.2) | 46 661 (9.5) |
| Missing | 258 (5.9) | 239 (5.9) | 19 (6.7) | 441 (7.4) | 29 330 (5.6) |
| Region of birth, n (%) | |||||
| Sweden | 3785 (86.4) | 3503 (86.5) | 282 (85.2) | 5193 (87.3) | 433 765 (83.1) |
| Nordic outside Sweden | 84 (1.9) | 80 (2.0) | 4 (1.2) | 115 (1.9) | 8466 (1.6) |
| European outside Nordic Region | 234 (5.3) | 220 (5.4) | 14 (4.2) | 256 (4.3) | 27 993 (5.4) |
| African origin | 32 (0.7) | 25 (0.6) | 7 (2.1) | 34 (0.6) | 9707 (1.9) |
| Asian origin | 209 (4.8) | 188 (4.6) | 21 (6.3) | 283 (4.8) | 35 036 (6.7) |
| Other | 38 (0.9) | 35 (0.9) | 3 (0.9) | 66 (1.1) | 7212 (1.4) |
| Missing | 0 (0.0) | 0 (0.0) | 0 (0.0) | 0 (0.0) | 107 (0.0) |
| Educational level, n (%) | |||||
| ≤ 9 y | 170 (3.9) | 152 (3.8) | 18 (5.4) | 202 (3.4) | 39 795 (7.6) |
| 10–12 y | 1797 (41.0) | 1652 (40.8) | 145 (43.8) | 2157 (36.3) | 218 217 (41.9) |
| Higher education <3y | 760 (17.4) | 707 (17.5) | 53 (16.0) | 986 (16.6) | 74 292 (14.3) |
| Higher education ≥3 y | 1653 (37.7) | 1538 (38.0) | 115 (34.7) | 2598 (43.7) | 188 894 (36.2) |
| Missing | 2 (0.0) | 2 (0.0) | 0 (0.0) | 4 (0.1) | 1088 (0.2) |
| Highest socioeconomic level during school period of child | |||||
| Low class | 1620 (39.7) | 1482 (39.3) | 138 (45.0) | 1892 (34.2) | 213 559 (45.2) |
| Middle class | 642 (15.7) | 603 (16.0) | 39 (12.7) | 914 (16.5) | 66 655 (14.1) |
| High class | 1819 (44.6) | 1689 (44.8) | 130 (42.4) | 2723 (49.3) | 192 014 (40.7) |
| Missing | 301 (6.9) | 277 (6.8) | 24 (7.3) | 418 (7.0) | 50 058 (9.6) |
| Paternal | |||||
| Age at birth, years, mean (SD) | 36.6 (5.7) | 36.5 (5.6) | 38.8 (7.1) | 36.5 (5.2) | 33.3 (6.0) |
| Region of birth, n (%) | |||||
| Sweden | 3816 (87.2) | 3550 (87.7) | 266 (80.6) | 5267 (88.6) | 429 392 (82.6) |
| Nordic outside Sweden | 92 (2.1) | 83 (2.1) | 9 (2.7) | 95 (1.6) | 8897 (1.7) |
| European outside Nordic Region | 233 (5.3) | 211 (5.2) | 22 (6.7) | 273 (4.6) | 31 074 (6.0) |
| African origin | 35 (0.8) | 26 (0.6) | 9 (2.7) | 38 (0.6) | 11 390 (2.2) |
| Asian origin | 176 (4.0) | 157 (3.9) | 19 (5.8) | 217 (3.7) | 31 037 (6.0) |
| Other | 24 (0.6) | 19 (0.5) | 5 (1.5) | 54 (0.9) | 8284 (1.6) |
| Missing | 6 (0.1) | 5 (0.1) | 1 (0.3) | 3 (0.1) | 2212 (0.4) |
| Highest educational level, n (%) | |||||
| ≤ 9 y | 339 (7.8) | 300 (7.4) | 39 (11.9) | 402 (6.8) | 56 210 (10.8) |
| 10–12 y | 2108 (48.2) | 1923 (47.6) | 185 (56.2) | 2626 (44.2) | 263 535 (50.8) |
| Higher education <3 y | 766 (17.5) | 727 (18.0) | 39 (11.9) | 1141 (19.2) | 78 822 (15.2) |
| Higher education ≥3 y | 1160 (26.5) | 1094 (27.1) | 66 (20.1) | 1770 (29.8) | 120 137 (23.2) |
| Missing | 9 (0.2) | 7 (0.2) | 2 (0.6) | 8 (0.1) | 3582 (0.7) |
| Parents together | |||||
| Parental disposable income, mean (SD) during school period of child | 728364.1 (1901207) | 736389.2 (1972670) | 630148.4 (466, 418) | 744693.4 (994906) | 640706.3 (1187861) |
ICSI, intracytoplasmic sperm injection; IVF, in-vitro fertilization; SC, spontaneous conception; SD, standard deviation; wk, week; n, number
*No missing data for calendar year at birth and parity
**Children, who ought to have a grade in ninth grade but for some reason did not, who were found in third grade, where included in this cohort
| Singletons n = 532 615 | |||||
|---|---|---|---|---|---|
| Characteristics | All ICSI N = 4382 | Ejaculated ICSI N = 4051 | Non-ejaculated ICSI N = 331 | IVF N = 5947 | Spontaneous conception N = 522 286 |
| Child | |||||
| Calendar year at birth*, n (%) | |||||
| 1997–2001** | 526 (12.0) | 485 (12.0) | 41 (12.4) | 637 (10.7) | 82 158 (15.7) |
| 2002–2006 | 3856 (88.0) | 3566 (88.0) | 290 (87.6) | 5310 (89.3) | 440 128 (84.3) |
| Birth weight, n (%) | |||||
| Low birth weight <2500 g | 207 (4.7) | 197 (4.9) | 10 (3.0) | 326 (5.5) | 15 019 (2.9) |
| Very low birth weight <1500 g | 40 (0.9) | 36 (0.9) | 4 (1.2) | 66 (1.1) | 2340 (0.5) |
| Missing | 11 (0.3) | 9 (0.2) | 2 (0.6) | 21 (0.4) | 1397 (0.3) |
| Gestational age, n (%) | |||||
| Post term, ≥42 wk. | 339 (7.7) | 302 (7.5) | 37 (11.2) | 432 (7.3) | 38 758 (7.4) |
| Term, 37–41 wk. | 3755 (85.7) | 3480 (86.0) | 275 (83.1) | 5052 (85.0) | 458 475 (87.8) |
| Preterm birth, <37 wk. | 286 (6.5) | 267 (6.6) | 19 (5.7) | 461 (7.8) | 24 718 (4.2) |
| Very preterm birth, <32 wk. | 44 (1.0) | 40 (1.0) | 4 (1.2) | 79 (1.3) | 2990 (0.4) |
| Extremely preterm birth <28 wk | 14 (0.3) | 13 (0.3) | 1 (0.3) | 24 (0.4) | 816 (0.2) |
| Missing | 2 (0.0) | 2 (0.0) | 0 (0.0) | 2 (0.0) | 335 (0.1) |
| Birth defects, n (%) | 185 (4.2) | 173 (4.3) | 12 (3.6) | 263 (4.4) | 10 210 (2.0) |
| Apgar score at 5 min | |||||
| 0–3 | 11 (0.3) | 11 (0.3) | 0 (0.0) | 11 (0.2) | 712 (0.1) |
| 4–6 | 50 (1.2) | 47 (1.2) | 3 (0.9) | 63 (1.1) | 4060 (0.8) |
| Missing | 19 (0.4) | 16 (0.4) | 3 (0.9) | 34 (0.6) | 3042 (0.6) |
| Maternal | |||||
| Age at birth, years mean (SD) | 33.5 (4.1) | 33.6 (4.1) | 33.1 (4.2) | 34.5 (4.0) | 30.5 (5.0) |
| Parity* | |||||
| 1 | 3182 (72.6) | 2953 (72.9) | 229 (69.2) | 4475 (75.3) | 230 401 (44.1) |
| 2 | 948 (21.6) | 870 (21.5) | 78 (23.6) | 1191 (20.0) | 190 655 (36.5) |
| 3 | 209 (4.8) | 191 (4.7) | 18 (5.4) | 198 (3.3) | 70 787 (13.6) |
| 4 | 30 (0.7) | 24 (0.6) | 6 (1.8) | 65 (1.1) | 20 050 (3.8) |
| ≥5 | 13 (0.3) | 13 (0.3) | 0 (0.0) | 18 (0.3) | 10 393 (2.0) |
| Smoking during pregnancy (yes), n (%) | 183 (4.4) | 166 (4.4) | 17 (5.5) | 233 (4.2) | 46 661 (9.5) |
| Missing | 258 (5.9) | 239 (5.9) | 19 (6.7) | 441 (7.4) | 29 330 (5.6) |
| Region of birth, n (%) | |||||
| Sweden | 3785 (86.4) | 3503 (86.5) | 282 (85.2) | 5193 (87.3) | 433 765 (83.1) |
| Nordic outside Sweden | 84 (1.9) | 80 (2.0) | 4 (1.2) | 115 (1.9) | 8466 (1.6) |
| European outside Nordic Region | 234 (5.3) | 220 (5.4) | 14 (4.2) | 256 (4.3) | 27 993 (5.4) |
| African origin | 32 (0.7) | 25 (0.6) | 7 (2.1) | 34 (0.6) | 9707 (1.9) |
| Asian origin | 209 (4.8) | 188 (4.6) | 21 (6.3) | 283 (4.8) | 35 036 (6.7) |
| Other | 38 (0.9) | 35 (0.9) | 3 (0.9) | 66 (1.1) | 7212 (1.4) |
| Missing | 0 (0.0) | 0 (0.0) | 0 (0.0) | 0 (0.0) | 107 (0.0) |
| Educational level, n (%) | |||||
| ≤ 9 y | 170 (3.9) | 152 (3.8) | 18 (5.4) | 202 (3.4) | 39 795 (7.6) |
| 10–12 y | 1797 (41.0) | 1652 (40.8) | 145 (43.8) | 2157 (36.3) | 218 217 (41.9) |
| Higher education <3y | 760 (17.4) | 707 (17.5) | 53 (16.0) | 986 (16.6) | 74 292 (14.3) |
| Higher education ≥3 y | 1653 (37.7) | 1538 (38.0) | 115 (34.7) | 2598 (43.7) | 188 894 (36.2) |
| Missing | 2 (0.0) | 2 (0.0) | 0 (0.0) | 4 (0.1) | 1088 (0.2) |
| Highest socioeconomic level during school period of child | |||||
| Low class | 1620 (39.7) | 1482 (39.3) | 138 (45.0) | 1892 (34.2) | 213 559 (45.2) |
| Middle class | 642 (15.7) | 603 (16.0) | 39 (12.7) | 914 (16.5) | 66 655 (14.1) |
| High class | 1819 (44.6) | 1689 (44.8) | 130 (42.4) | 2723 (49.3) | 192 014 (40.7) |
| Missing | 301 (6.9) | 277 (6.8) | 24 (7.3) | 418 (7.0) | 50 058 (9.6) |
| Paternal | |||||
| Age at birth, years, mean (SD) | 36.6 (5.7) | 36.5 (5.6) | 38.8 (7.1) | 36.5 (5.2) | 33.3 (6.0) |
| Region of birth, n (%) | |||||
| Sweden | 3816 (87.2) | 3550 (87.7) | 266 (80.6) | 5267 (88.6) | 429 392 (82.6) |
| Nordic outside Sweden | 92 (2.1) | 83 (2.1) | 9 (2.7) | 95 (1.6) | 8897 (1.7) |
| European outside Nordic Region | 233 (5.3) | 211 (5.2) | 22 (6.7) | 273 (4.6) | 31 074 (6.0) |
| African origin | 35 (0.8) | 26 (0.6) | 9 (2.7) | 38 (0.6) | 11 390 (2.2) |
| Asian origin | 176 (4.0) | 157 (3.9) | 19 (5.8) | 217 (3.7) | 31 037 (6.0) |
| Other | 24 (0.6) | 19 (0.5) | 5 (1.5) | 54 (0.9) | 8284 (1.6) |
| Missing | 6 (0.1) | 5 (0.1) | 1 (0.3) | 3 (0.1) | 2212 (0.4) |
| Highest educational level, n (%) | |||||
| ≤ 9 y | 339 (7.8) | 300 (7.4) | 39 (11.9) | 402 (6.8) | 56 210 (10.8) |
| 10–12 y | 2108 (48.2) | 1923 (47.6) | 185 (56.2) | 2626 (44.2) | 263 535 (50.8) |
| Higher education <3 y | 766 (17.5) | 727 (18.0) | 39 (11.9) | 1141 (19.2) | 78 822 (15.2) |
| Higher education ≥3 y | 1160 (26.5) | 1094 (27.1) | 66 (20.1) | 1770 (29.8) | 120 137 (23.2) |
| Missing | 9 (0.2) | 7 (0.2) | 2 (0.6) | 8 (0.1) | 3582 (0.7) |
| Parents together | |||||
| Parental disposable income, mean (SD) during school period of child | 728364.1 (1901207) | 736389.2 (1972670) | 630148.4 (466, 418) | 744693.4 (994906) | 640706.3 (1187861) |
ICSI, intracytoplasmic sperm injection; IVF, in-vitro fertilization; SC, spontaneous conception; SD, standard deviation; wk, week; n, number
*No missing data for calendar year at birth and parity
**Children, who ought to have a grade in ninth grade but for some reason did not, who were found in third grade, where included in this cohort
characteristics of the children without registered education and their parents are shown in Table VI. Of the children born after ICSI, 147 (2.1%) had no registered education. The corresponding figures for children born after IVF and SC were 230 (2.0%) and 45 574 (2.3%), respectively. When crosslinking the children without registered education with the CPUP, 4 (2.7%) of ICSI children, 13 (5.7%) of IVF children and 795 (1.7%) of children born after SC were diagnosed with cerebral palsy. When crosslinking children without registered education with the NPR using ICD 9 and ICD 10 codes for mental disability, 44 (29.9%) of the children born after ICSI, 75 (32.6%) of the children born after IVF and 16 285 (35.0%) of the children born after SC were registered under one of these diagnoses. The PTB and LBW rates were high in the group of children without registered education particularly among the ART children (Table VI).
School performance in ninth grade for singletons born after ICSI, IVF and spontaneous conception (SC), born between 1985 and 2001.Total scores and scores in Mathematics, English, Swedish and Physical Education.
| All ICSI N = 2571 | Ejaculated ICSI N = 2440 | Non-Ejaculated ICSI N = 131 | IVF N = 5766 | SC N = 1 500 709 | Mean difference in percentiles | ||||||
|---|---|---|---|---|---|---|---|---|---|---|---|
| All ICSI vs IVF | All ICSI vs SC | Non-Ejaculated ICSI vs Ejaculated ICSI | |||||||||
| Crude mean difference (95% CI) p-value | Adjustedamean difference (95% CI) p-value | Crude mean difference (95% CI) p-value | Adjustedbmean difference (95% CI) p-value | Crude mean difference (95% CI) p-value | Adjustedamean difference (95% CI) p-value | ||||||
| Total score*, all subjects, all years, 2000–2016 | |||||||||||
| Mean score (SD) | 235.4 (55.1) | 236.0 (54.3) | 224.5 (67.8) | 228.1 (58.1) | 209.7 (63.9) | ||||||
| Mean percentile | 63.1 | 63.3 | 58.6 | 59.0 | 50.2 | 4.03 (2.77 to 5.29) <0.001 | 1.03 (−0.22 to 2.28) 0.11 | 12.84 (11.81 to 13.87) <0.001 | 0.52 (−0.45 to 1.50) 0.29 | −4.68 (−9.90 to 0.53) 0.08 | −3.01 (−7.25 to 1.22) 0.16 |
| Mathematics**, all years, 2000–2016 | |||||||||||
| Mean score (SD) | 13.5 (4.5) | 13.5 (4.5) | 13.3 (4.9) | 13.2 (4.7) | 12.1 (4.8) | ||||||
| Mean percentile | 63.5 | 63.5 | 62.2 | 60.2 | 53.2 | 3.31 (2.02 to 4.61) <0.001 | 0.98 (−0.36 to 2.31) 0.15 | 10.27 (9.21 to 11.34) <0.001 | 0.60 (−0.42 to 1.62) 0.25 | −1.35 (−5.51 to 3.78) 0.60 | 0.96 (−3.58 to 5.51) 0.68 |
| Swedish**, all years, 2000–2016 | |||||||||||
| Mean score (SD) | 14.5 (4.4) | 14.5 (4.4) | 13.0 (5.5) | 14.1 (4.3) | 12.8 (4.9) | ||||||
| Mean percentile | 65.5 | 65.9 | 58.1 | 61.9 | 53.8 | 3.60 (2.30 to 4.90) <0.001 | 0.60 (−0.71 to 1.83) 0.39 | 11.71 (10.63 to 12.78) <0.001 | 0.66 (−0.34 to 1.65) 0.20 | −7.74 (−13.12 to −2.36) 0.005 | −5.07 (−9.41 to −0.74) 0.02 |
| English**, all years, 2000–2016 | |||||||||||
| Mean score (SD) | 15.5 (4.1) | 15.6 (4.1) | 14.4 (4.9) | 15.0 (4.3) | 13.5 (4.8) | ||||||
| Mean percentile | 69.4 | 69.7 | 63.3 | 65.1 | 55.0 | 4.27 (2.97 to 5.57) <0.001 | 0.38 (−0.97 to 1.73) 0.58 | 14.42 (13.35 to 15.49) <0.001 | 0.95 (−0.12 to 2.03) 0.08 | −6.46 (−11.76 to −1.15) 0.02 | −5.53 (−10.10 to −0.96) 0.02 |
| Physical education**, all years, 2000–2016 | |||||||||||
| Mean score (SD) | 14.9 (4.5) | 14.9 (4.4) | 14.5 (5.3) | 14.5 (4.8) | 13.6 (5.3) | ||||||
| Mean percentile | 64.1 | 64.1 | 63.7 | 61.4 | 56.2 | 2.73 (1.39 to 4.08) <0.001 | 0.44 (−1.01 to 1.89) 0.55 | 7.91 (6.81 to 9.01) <0.001 | 0.47 (−0.68 to 1.63) 0.42 | −0.47 (−5.91 to 4.97) 0.86 | 1.26 (−3.63 to 6.15) 0.61 |
ICSI, intracytoplasmic sperm injection; IVF, in-vitro fertilization; SC, spontaneous conception; SD standard deviation
*total score 0–320
**score 0–20 (not pass = 0 p, pass = 10 p, pass with distinction =15 p, pass with special distinction = 20 p)
aAdjusted for sex, year of birth, parental age, parental region of birth, parity, maternal smoking during pregnancy, parental level of education, frozen embryo transfer.
bAdjusted for sex, year of birth, parental age, parental region of birth, parity, maternal smoking during pregnancy, parental level of education.
| All ICSI N = 2571 | Ejaculated ICSI N = 2440 | Non-Ejaculated ICSI N = 131 | IVF N = 5766 | SC N = 1 500 709 | Mean difference in percentiles | ||||||
|---|---|---|---|---|---|---|---|---|---|---|---|
| All ICSI vs IVF | All ICSI vs SC | Non-Ejaculated ICSI vs Ejaculated ICSI | |||||||||
| Crude mean difference (95% CI) p-value | Adjustedamean difference (95% CI) p-value | Crude mean difference (95% CI) p-value | Adjustedbmean difference (95% CI) p-value | Crude mean difference (95% CI) p-value | Adjustedamean difference (95% CI) p-value | ||||||
| Total score*, all subjects, all years, 2000–2016 | |||||||||||
| Mean score (SD) | 235.4 (55.1) | 236.0 (54.3) | 224.5 (67.8) | 228.1 (58.1) | 209.7 (63.9) | ||||||
| Mean percentile | 63.1 | 63.3 | 58.6 | 59.0 | 50.2 | 4.03 (2.77 to 5.29) <0.001 | 1.03 (−0.22 to 2.28) 0.11 | 12.84 (11.81 to 13.87) <0.001 | 0.52 (−0.45 to 1.50) 0.29 | −4.68 (−9.90 to 0.53) 0.08 | −3.01 (−7.25 to 1.22) 0.16 |
| Mathematics**, all years, 2000–2016 | |||||||||||
| Mean score (SD) | 13.5 (4.5) | 13.5 (4.5) | 13.3 (4.9) | 13.2 (4.7) | 12.1 (4.8) | ||||||
| Mean percentile | 63.5 | 63.5 | 62.2 | 60.2 | 53.2 | 3.31 (2.02 to 4.61) <0.001 | 0.98 (−0.36 to 2.31) 0.15 | 10.27 (9.21 to 11.34) <0.001 | 0.60 (−0.42 to 1.62) 0.25 | −1.35 (−5.51 to 3.78) 0.60 | 0.96 (−3.58 to 5.51) 0.68 |
| Swedish**, all years, 2000–2016 | |||||||||||
| Mean score (SD) | 14.5 (4.4) | 14.5 (4.4) | 13.0 (5.5) | 14.1 (4.3) | 12.8 (4.9) | ||||||
| Mean percentile | 65.5 | 65.9 | 58.1 | 61.9 | 53.8 | 3.60 (2.30 to 4.90) <0.001 | 0.60 (−0.71 to 1.83) 0.39 | 11.71 (10.63 to 12.78) <0.001 | 0.66 (−0.34 to 1.65) 0.20 | −7.74 (−13.12 to −2.36) 0.005 | −5.07 (−9.41 to −0.74) 0.02 |
| English**, all years, 2000–2016 | |||||||||||
| Mean score (SD) | 15.5 (4.1) | 15.6 (4.1) | 14.4 (4.9) | 15.0 (4.3) | 13.5 (4.8) | ||||||
| Mean percentile | 69.4 | 69.7 | 63.3 | 65.1 | 55.0 | 4.27 (2.97 to 5.57) <0.001 | 0.38 (−0.97 to 1.73) 0.58 | 14.42 (13.35 to 15.49) <0.001 | 0.95 (−0.12 to 2.03) 0.08 | −6.46 (−11.76 to −1.15) 0.02 | −5.53 (−10.10 to −0.96) 0.02 |
| Physical education**, all years, 2000–2016 | |||||||||||
| Mean score (SD) | 14.9 (4.5) | 14.9 (4.4) | 14.5 (5.3) | 14.5 (4.8) | 13.6 (5.3) | ||||||
| Mean percentile | 64.1 | 64.1 | 63.7 | 61.4 | 56.2 | 2.73 (1.39 to 4.08) <0.001 | 0.44 (−1.01 to 1.89) 0.55 | 7.91 (6.81 to 9.01) <0.001 | 0.47 (−0.68 to 1.63) 0.42 | −0.47 (−5.91 to 4.97) 0.86 | 1.26 (−3.63 to 6.15) 0.61 |
ICSI, intracytoplasmic sperm injection; IVF, in-vitro fertilization; SC, spontaneous conception; SD standard deviation
*total score 0–320
**score 0–20 (not pass = 0 p, pass = 10 p, pass with distinction =15 p, pass with special distinction = 20 p)
aAdjusted for sex, year of birth, parental age, parental region of birth, parity, maternal smoking during pregnancy, parental level of education, frozen embryo transfer.
bAdjusted for sex, year of birth, parental age, parental region of birth, parity, maternal smoking during pregnancy, parental level of education.
Qualifying to secondary school and poor school performance (total score < 160) in ninth grade for singletons born after ICSI, IVF and SC, born between 1985 and 2001.
| OR (95% CI) p-value | Adjusted ORa (95% CI) p-value | OR (95% CI) p-value | Adjusted ORb (95% CI) p-value | OR (95% CI) p-value | Adjusted ORa (95% CI) p-value | ||||||
|---|---|---|---|---|---|---|---|---|---|---|---|
| All ICSI N = 2571 | Ejaculated ICSI N = 2440 | Non-Ejaculated ICSI N = 131 | IVF N = 5766 | SC N = 1 500 709 | All ICSI vs IVF | All ICSI vs IVF | All ICSI vs SC | All ICSI vs SC | Non-Ejaculated ICSI vs Ejaculated ICSI | Non-Ejaculated ICSI vs Ejaculated ICSI | |
| Approved in m = Mathematics, Swedish and English (all scores > 0) and qualified to enter secondary school, N (%) | 2399 (93.3) | 2286 (93.7) | 113 (86.3) | 5393 (93.5) | 1 333 027 (88.8) | 0.96 (0.80 to 1.16) 0.71 | 1.02 (0.82 to 1.26) 0.87 | 1.75 (1.50 to 2.04) < 0.001 | 1.04 (0.88 to 1.22) 0.68 | 0.42 (0.26 to 0.71) 0.001 | 0.65 (0.36 to 1.18) 0.16 |
| Poor school performance (total score < 160), N (%) | 155 (6.0) | 141 (5.8) | 14 (10.7) | 441 (7.7) | 202 845 (13.5) | 0.77 (0.64 to 0.94) 0.01 | 0.92 (0.75 to 1.14) 0.47 | 0.41 (0.35 to 0.48) <0.001 | 0.93 (0.78 to 1.10) 0.37 | 1.95 (1.09 to 3.48) 0.02 | 1.87 (1.01 to 3.45) 0.045 |
ICSI, intracytoplasmic sperm injection; IVF, in-vitro fertilization; SC, spontaneous conception
aAdjusted for sex, year of birth, parental age, parental region of birth, parity, maternal smoking during pregnancy, parental level of education, frozen embryo transfer.
bAdjusted for sex, year of birth, parental age, parental region of birth, parity, maternal smoking during pregnancy, parental level of education.
| OR (95% CI) p-value | Adjusted ORa (95% CI) p-value | OR (95% CI) p-value | Adjusted ORb (95% CI) p-value | OR (95% CI) p-value | Adjusted ORa (95% CI) p-value | ||||||
|---|---|---|---|---|---|---|---|---|---|---|---|
| All ICSI N = 2571 | Ejaculated ICSI N = 2440 | Non-Ejaculated ICSI N = 131 | IVF N = 5766 | SC N = 1 500 709 | All ICSI vs IVF | All ICSI vs IVF | All ICSI vs SC | All ICSI vs SC | Non-Ejaculated ICSI vs Ejaculated ICSI | Non-Ejaculated ICSI vs Ejaculated ICSI | |
| Approved in m = Mathematics, Swedish and English (all scores > 0) and qualified to enter secondary school, N (%) | 2399 (93.3) | 2286 (93.7) | 113 (86.3) | 5393 (93.5) | 1 333 027 (88.8) | 0.96 (0.80 to 1.16) 0.71 | 1.02 (0.82 to 1.26) 0.87 | 1.75 (1.50 to 2.04) < 0.001 | 1.04 (0.88 to 1.22) 0.68 | 0.42 (0.26 to 0.71) 0.001 | 0.65 (0.36 to 1.18) 0.16 |
| Poor school performance (total score < 160), N (%) | 155 (6.0) | 141 (5.8) | 14 (10.7) | 441 (7.7) | 202 845 (13.5) | 0.77 (0.64 to 0.94) 0.01 | 0.92 (0.75 to 1.14) 0.47 | 0.41 (0.35 to 0.48) <0.001 | 0.93 (0.78 to 1.10) 0.37 | 1.95 (1.09 to 3.48) 0.02 | 1.87 (1.01 to 3.45) 0.045 |
ICSI, intracytoplasmic sperm injection; IVF, in-vitro fertilization; SC, spontaneous conception
aAdjusted for sex, year of birth, parental age, parental region of birth, parity, maternal smoking during pregnancy, parental level of education, frozen embryo transfer.
bAdjusted for sex, year of birth, parental age, parental region of birth, parity, maternal smoking during pregnancy, parental level of education.
Results of National tests in third grade for singletons born after ICSI, IVF and SC, born between 2002 and 2006.
| Approved in all subtests, N (%) | OR (95% CI) p-value | Adjusted ORa (95% CI) p-value | OR (95% CI) p-value | Adjusted ORb (95% CI) p-value | OR (95% CI) p-value | Adjusted ORa(95% CI) p-value | |||||
|---|---|---|---|---|---|---|---|---|---|---|---|
| ICSI N = 4382 | Ejaculated ICSI N = 4051 | Non-Ejaculated ICSI N = 331 | IVF N = 5947 | SC N = 522 286 | ICSI vs IVF | ICSI vs IVF | ICSI vs SC | ICSI vs SC | Non-Ejaculated ICSI vs Ejaculated ICSI | Non-Ejaculated ICSI vs Ejaculated ICSI | |
| Mathematics Year of test 2010–2016 | 3406 (77.7) | 3159 (78.0) | 247 (74.6) | 4717 (79.3) | 395 109 (75.7) | 0.91 (0.83 to 1.00) 0.05 | 0.98 (0.89 to 1.08) 0.71 | 1.12 (1.05 to 1.21) 0.001 | 0.89 (0.83 to 0.96) 0.002 | 0.83 (0.64 to 1.08) 0.16 | 0.94 (0.72 to 1.24) 0.68 |
| Swedish Year of test 2010–2016 | 3442 (78.6) | 3189 (78.7) | 253 (76.4) | 4753 (79.9) | 392 559 (75.2) | 0.92 (0.84 to 1.01) 0.09 | 0.96 (0.87 to 1.07) 0.49 | 1.21 (1.13 to 1.30) <0.001 | 0.92 (0.85 to 0.99) 0.02 | 0.88 (0.67 to 1.14) 0.33 | 1.00 (0.75 to 1.33) 1.00 |
ICSI, intracytoplasmic sperm injection; IVF, in-vitro fertilisation; SC, spontaneous conception; OR, odds ratio; n, number
aAdjusted for sex, year of birth, maternal age, paternal age, parental region of birth, parity, maternal smoking during pregnancy, parental level of education, frozen embryo transfer.
bAdjusted for sex, year of birth, maternal age, paternal age, parental region of birth, parity, maternal smoking during pregnancy, parental level of education.
| Approved in all subtests, N (%) | OR (95% CI) p-value | Adjusted ORa (95% CI) p-value | OR (95% CI) p-value | Adjusted ORb (95% CI) p-value | OR (95% CI) p-value | Adjusted ORa(95% CI) p-value | |||||
|---|---|---|---|---|---|---|---|---|---|---|---|
| ICSI N = 4382 | Ejaculated ICSI N = 4051 | Non-Ejaculated ICSI N = 331 | IVF N = 5947 | SC N = 522 286 | ICSI vs IVF | ICSI vs IVF | ICSI vs SC | ICSI vs SC | Non-Ejaculated ICSI vs Ejaculated ICSI | Non-Ejaculated ICSI vs Ejaculated ICSI | |
| Mathematics Year of test 2010–2016 | 3406 (77.7) | 3159 (78.0) | 247 (74.6) | 4717 (79.3) | 395 109 (75.7) | 0.91 (0.83 to 1.00) 0.05 | 0.98 (0.89 to 1.08) 0.71 | 1.12 (1.05 to 1.21) 0.001 | 0.89 (0.83 to 0.96) 0.002 | 0.83 (0.64 to 1.08) 0.16 | 0.94 (0.72 to 1.24) 0.68 |
| Swedish Year of test 2010–2016 | 3442 (78.6) | 3189 (78.7) | 253 (76.4) | 4753 (79.9) | 392 559 (75.2) | 0.92 (0.84 to 1.01) 0.09 | 0.96 (0.87 to 1.07) 0.49 | 1.21 (1.13 to 1.30) <0.001 | 0.92 (0.85 to 0.99) 0.02 | 0.88 (0.67 to 1.14) 0.33 | 1.00 (0.75 to 1.33) 1.00 |
ICSI, intracytoplasmic sperm injection; IVF, in-vitro fertilisation; SC, spontaneous conception; OR, odds ratio; n, number
aAdjusted for sex, year of birth, maternal age, paternal age, parental region of birth, parity, maternal smoking during pregnancy, parental level of education, frozen embryo transfer.
bAdjusted for sex, year of birth, maternal age, paternal age, parental region of birth, parity, maternal smoking during pregnancy, parental level of education.
Discussion
This large population-based cohort study examined 6953 children born after ICSI and 11 713 children born after IVF to explore whether there were any differences in school performance between the two groups. The main finding was that children born after ICSI had similar school performance compared to children born after IVF. Additionally, this study compared school performance of children born after ICSI with children born after SC. After adjustment, there was a small difference in favour of the SC children in the national tests in third grade. This difference may well be the results of unmeasured confounders since there are many differences between ICSI and SC parents that may not be captured in the covariates. In the ninth grade, there was no difference between these groups. Children born after non-ejaculated ICSI achieved significantly lower scores in the specific subjects Swedish and English and had a significantly higher risk of poor performance compared to children born after ejaculated ICSI.
Several studies, both SRs and large observational studies have been published concerning neurodevelopment and cognitive function in ART children. Most of these studies have found reassuring results for ART children, both IVF and ICSI, compared to children conceived spontaneously (Bay et al., 2013a,b; Spangmose et al., 2017; Catford et al., 2018). A few studies have observed some negative results for ICSI children. A systematic review from Australia found reassuring results for IVF children and in most studies, also for ICSI children, although with some divergent results (Rumbold et al., 2017). A large registry study from Sweden (Sandin et al., 2013) found no overall risk of mental retardation or autistic disorders in ART singletons compared to spontaneously conceived singletons in the main analysis, but a small increase in mental retardation in a subanalysis of ICSI singletons, compared to IVF, being borderline significant for fresh ICSI and significant for frozen ICSI. However, the analysis was based on few cases (n = 7). A large population based cohort study from California (Kissin et al., 2015) reported an overall increase in risk of autism when ICSI was used compared to conventional IVF (HR 1.65, 95% CI 1.08–2.52). No comparison with spontaneously conceived children was performed in that study.
Sociodemographic and perinatal characteristics of the 45 951 children in third and ninth grade without registered education and their parents.
| All ICSI N = 147 | Ejaculated ICSI N = 144 | Non-ejaculated ICSI N = 3 | IVF N = 230 | SC N = 45 574 | |
|---|---|---|---|---|---|
| Characteristics | |||||
| Child | |||||
| Calendar year at birth, n (%) | |||||
| 1985–1990 | 1 (0.7) | 1 (0.7) | 0 (0.0) | 8 (3.5) | 13 549 (29.7) |
| 1991–1996 | 7 (4.8) | 7 (4.9) | 0 (0.0) | 63 (27.4) | 14 991 (33.9) |
| 1997–2001 | 41 (27.9) | 40 (27.8) | 1 (33.3) | 42 (18.3) | 7168 (15.7) |
| 2002–2007 | 98 (66.7) | 96 (66.7) | 2 (66.7) | 117 (50.9) | 9866 (21.7) |
| Low birth weight < 2500 g, n (%) | 18 (12.4) | 17 (12.0) | 1 (33.3) | 31 (13.7) | 3617 (8.0) |
| Preterm birth, <37 wk. n (%) | 22 (15.0) | 21 (14.6) | 1 (33.3) | 37 (16.2) | 4303 (9.5) |
| Maternal | |||||
| Age at birth, years mean (SD) | 34.0 (4.5) | 34.0 (4.5) | 32.3 (2.9) | 34.3 (3.9) | 28.9 (5.7) |
| Parity 1 | 107 (72.8) | 105 (72.9) | 2 (66.7) | 170 (73.9) | 17 668 (38.8) |
| Smoking during pregnancy (yes), n (%) | 10 (7.5) | 9 (6.9) | 1 (33.3) | 34 (16.0) | 11 252 (26.6) |
| Country of birth outside Sweden, n (%) | 32 (21.8) | 31 (21.5) | 1 (33.3) | 41 (17.8) | 10 716 (23.5) |
| Educational level > 12 y, n (%) | 71 (48.3) | 69 (47.9) | 2 (66.7) | 107 (46.7) | 12 676 (28.1) |
| Paternal | |||||
| Age at birth, years mean (SD) | 36.8 (6.2) | 36.8 (6.2) | 37.3 (5.1) | 37.0 (5.3) | 32.5 (6.9) |
| Country of birth outside Sweden, n (%) | 26 (17.9) | 25 (17.6) | 1 (33.3) | 41 (17.8) | 11 534 (25.6) |
| Educational level > 12 y, n (%) | 62 (42.8) | 60 (42.3) | 2 (66.7) | 101 (44.1) | 10 665 (23.9) |
ICSI, intracytoplasmic sperm injection; IVF, in vitro fertilization; SC, spontaneous conception; SD, standard deviation; n, number
| All ICSI N = 147 | Ejaculated ICSI N = 144 | Non-ejaculated ICSI N = 3 | IVF N = 230 | SC N = 45 574 | |
|---|---|---|---|---|---|
| Characteristics | |||||
| Child | |||||
| Calendar year at birth, n (%) | |||||
| 1985–1990 | 1 (0.7) | 1 (0.7) | 0 (0.0) | 8 (3.5) | 13 549 (29.7) |
| 1991–1996 | 7 (4.8) | 7 (4.9) | 0 (0.0) | 63 (27.4) | 14 991 (33.9) |
| 1997–2001 | 41 (27.9) | 40 (27.8) | 1 (33.3) | 42 (18.3) | 7168 (15.7) |
| 2002–2007 | 98 (66.7) | 96 (66.7) | 2 (66.7) | 117 (50.9) | 9866 (21.7) |
| Low birth weight < 2500 g, n (%) | 18 (12.4) | 17 (12.0) | 1 (33.3) | 31 (13.7) | 3617 (8.0) |
| Preterm birth, <37 wk. n (%) | 22 (15.0) | 21 (14.6) | 1 (33.3) | 37 (16.2) | 4303 (9.5) |
| Maternal | |||||
| Age at birth, years mean (SD) | 34.0 (4.5) | 34.0 (4.5) | 32.3 (2.9) | 34.3 (3.9) | 28.9 (5.7) |
| Parity 1 | 107 (72.8) | 105 (72.9) | 2 (66.7) | 170 (73.9) | 17 668 (38.8) |
| Smoking during pregnancy (yes), n (%) | 10 (7.5) | 9 (6.9) | 1 (33.3) | 34 (16.0) | 11 252 (26.6) |
| Country of birth outside Sweden, n (%) | 32 (21.8) | 31 (21.5) | 1 (33.3) | 41 (17.8) | 10 716 (23.5) |
| Educational level > 12 y, n (%) | 71 (48.3) | 69 (47.9) | 2 (66.7) | 107 (46.7) | 12 676 (28.1) |
| Paternal | |||||
| Age at birth, years mean (SD) | 36.8 (6.2) | 36.8 (6.2) | 37.3 (5.1) | 37.0 (5.3) | 32.5 (6.9) |
| Country of birth outside Sweden, n (%) | 26 (17.9) | 25 (17.6) | 1 (33.3) | 41 (17.8) | 11 534 (25.6) |
| Educational level > 12 y, n (%) | 62 (42.8) | 60 (42.3) | 2 (66.7) | 101 (44.1) | 10 665 (23.9) |
ICSI, intracytoplasmic sperm injection; IVF, in vitro fertilization; SC, spontaneous conception; SD, standard deviation; n, number
A major strength of this study is the population-based design, making it possible to contain a complete national cohort of children and the large sample. Furthermore, the study is based on national registries with high validity, minimizing missing data and the risk of selection bias. Finally, we were able to adjust for relevant confounders.
Covariates associated with lower school performance were maternal smoking during pregnancy (Fig. 2). Smoking during pregnancy was more common among IVF mothers in the ninth grade (13.4%) compared to ICSI mothers (7.4%). Findings from other studies have indicated an association with impaired cognitive function in children of smoking mothers, measured by IQ tests (Frydman, 1996; Mortensen et al., 2005). A population-based Swedish cohort study (Lambe et al., 2006) however suggested that the associations between maternal smoking during pregnancy and poor cognitive performance in the offspring might not be causal but depend on unmeasured confounders. Covariates associated with good school performance were high parental education and low number of siblings (Fig. 2), which characterized parents of ART children, probably explaining why ICSI children performed better in the crude analyses compared to SC children. In an earlier study, where the same dataset was used, we compared school performance in the ninth grade between singletons born after ART and SC (Norrman et al., 2018). That study also showed that ART children performed better in the crude analyses but slightly worse in the adjusted analyses. Children born after ICSI with non-ejaculated sperm had significantly lower results in Swedish and English and a significantly higher risk of poor school performance than children born after ICSI with ejaculated sperm. Although, being an important finding, the result is based on a subgroup analysis and with few individuals (131 individuals, 14 events); therefore, the effect size needs further studies. Such a finding might well be a chance finding. Yet, some earlier studies have found differences for ICSI concerning autistic disorders (Kissin et al., 2015) or subgroups of ICSI concerning mental retardation (Sandin et al., 2013). Several significance tests were performed, also for secondary outcomes. We did not adjust for multiple comparisons as the outcomes are not independent, and therefore formal adjustment for multiple comparisons is not possible. Yet, none of the secondary outcomes would be considered statistically significant if standard methods of adjustment for multiple testing were applied.
Limitations of this study are unmeasured and unknown confounders, where information about infertility diagnoses and indication for ICSI were not available and where the proportion of children born after ART and SC varied in the different grading systems used. However, the only difference between the two grading systems used was that the later grading system (with a higher proportion of children born after ART) had four instead of six categories to choose from. It is difficult to estimate whether this has affected the result. Another limitation was that test scores were missing in 2.1%, 2.0% and 2.3% in ICSI, IVF and SC children, respectively. Yet, the number of children not registered in the education system in this study was low compared to other studies on school performance (Wagenaar et al., 2008; Mains et al., 2010; Spangmose et al., 2017). The exact reason for no registered education is not known but may include severe physical and mental disorders such as cerebral palsy and mental retardation. Our results indicate that cerebral palsy was more common among ART children with missing school grades than such SC children. Earlier studies concerning cerebral palsy in children born after ART have found divergent results. An increased risk has mainly been associated with prematurity and multiple pregnancies (Stromberg et al., 2002; Klemetti et al., 2006). Another reason for missed registration could be that children attending non-public schools were not registered before 1993. It should also be pointed out that the power to detect meaningful differences between certain groups is limited. This is particularly the case for the comparison between children born from ejaculated versus non-ejaculated sperm, where many confidence intervals are wide, not excluding important differences.
Conclusion
Children born after ICSI had similar school performance compared to children born after IVF. Compared to children born after SC, small differences were observed in the third grade in favour of SC children. In the ninth grade, no differences between ICSI and SC children were observed. Our results are relevant and important to most countries where IVF and ICSI are used since there may be some differences in choice of procedure. In recent years, there has been an increasing trend towards using ICSI not only in the treatment of male infertility but also when the sperm sample is normal (Adamson et al., 2018). Our results indicate that the school performance of children born after ICSI is reassuring.
Acknowledgements
This study was conducted with permission from the Swedish MFR/Q-IVF registry, the Swedish National Board of Health and Welfare and Statistics Sweden. We thank them for their assistance with data collection.
Authors’ roles
All authors contributed to the conception and design of the study. All authors also collected data from the different registers. M.P. performed the statistical analyses. All authors contributed to the analysis and interpretation of data. E.N. drafted the manuscript. U.B.W., C.B. and M.P. revised the manuscript and all authors approved the final version.
Funding
Sahlgrenska University Hospital (ALFGBG-70 940); Hjalmar Svensson Research Foundation and Nordforsk (project number 71450). The funding sources had no role in the design and conduct of the study, the collection, management, analysis or interpretation of data, writing of the manuscript nor the decision to submit the manuscript for publication.
Conflict of interest
None reported.
References
Author notes
Shared last authorship
