


Skip to results
Modify your search
NARROW
1-20 of 4459

Image
Cumulative rank probability analysis on intervention outcomes. BMI change ...
in
Human Reproduction Update
>
Comparative efficacy of exercise, diet and/or pharmacological interventions on BMI, ovulation, and hormonal profile in reproductive-aged women with overweight or obesity: a systematic review and network meta-analysis
Published: 16 April 2024
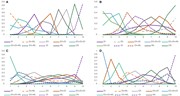
Figure 4.
Cumulative rank probability analysis on intervention outcomes. BMI change from baseline ( A ), ovulation ( B ), testosterone change from baseline ( C ), and SHBG change from baseline ( D ). The number on the X -axis represents the rank. As the number goes up, the rating goes down. The number on th
Image
Mechanisms linking obesity with functional disruption of the hypothalamic–p...
in
Human Reproduction Update
>
Comparative efficacy of exercise, diet and/or pharmacological interventions on BMI, ovulation, and hormonal profile in reproductive-aged women with overweight or obesity: a systematic review and network meta-analysis
Published: 16 April 2024
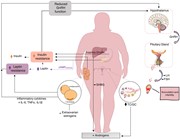
Figure 5.
Mechanisms linking obesity with functional disruption of the hypothalamic–pituitary–ovarian axis. GC, granulosa cells; SHBG, sex hormone-binding globulin; TC, Theca cells; TNF-α, tumor necrosis factor alpha.
Image
Network plots of available direct comparisons of outcomes when using differ...
in
Human Reproduction Update
>
Comparative efficacy of exercise, diet and/or pharmacological interventions on BMI, ovulation, and hormonal profile in reproductive-aged women with overweight or obesity: a systematic review and network meta-analysis
Published: 16 April 2024
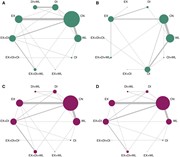
Figure 2.
Network plots of available direct comparisons of outcomes when using different interventions. BMI change from baseline ( A ), ovulation ( B ), testosterone change from baseline ( C ), and SHBG change from baseline ( D ). The size of the nodes is proportional to the number of participants (i.e. samp
Journal Article
Comparative efficacy of exercise, diet and/or pharmacological interventions on BMI, ovulation, and hormonal profile in reproductive-aged women with overweight or obesity: a systematic review and network meta-analysis
Human Reproduction Update, dmae008, https://doi.org/10.1093/humupd/dmae008
Published: 16 April 2024
Image
Graphical Abstract The combination of exercise, diet, and pharmacologi...
in
Human Reproduction Update
>
Comparative efficacy of exercise, diet and/or pharmacological interventions on BMI, ovulation, and hormonal profile in reproductive-aged women with overweight or obesity: a systematic review and network meta-analysis
Published: 16 April 2024
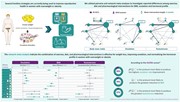
Graphical Abstract
Graphical Abstract The combination of exercise, diet, and pharmacological interventions is effective for weight loss, improving ovulation, and normalizing the androgen levels of women with overweight or obesity. RCT, randomized controlled trials; SUCRA, surface under the cumulative ranking cur
Image
PRISMA flowchart for the selection of studies in a systematic review and ne...
in
Human Reproduction Update
>
Comparative efficacy of exercise, diet and/or pharmacological interventions on BMI, ovulation, and hormonal profile in reproductive-aged women with overweight or obesity: a systematic review and network meta-analysis
Published: 16 April 2024
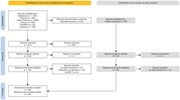
Figure 1.
PRISMA flowchart for the selection of studies in a systematic review and network meta-analysis on the comparative efficacy of exercise, diet and/or pharmacological interventions in reproductive-aged women with overweight or obesity .
Image
Polar plots for outcomes. BMI change from baseline, ovulation, testosteron...
in
Human Reproduction Update
>
Comparative efficacy of exercise, diet and/or pharmacological interventions on BMI, ovulation, and hormonal profile in reproductive-aged women with overweight or obesity: a systematic review and network meta-analysis
Published: 16 April 2024
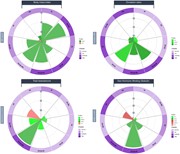
Figure 3.
Polar plots for outcomes. BMI change from baseline, ovulation, testosterone change from baseline and SHBG change from baseline. The polar plots show the relative effects of each strategy and control groups. Colour indicates the relative performance of the intervention of interest and the precision
Image
Summary of the TGFβ family induced signalling in EVT. During placentation,...
in
Human Reproduction Update
>
TGFβ signalling: a nexus between inflammation, placental health and preeclampsia throughout pregnancy
Published: 22 March 2024
Figure 2.
Summary of the TGFβ family induced signalling in EVT. During placentation, the coordinated migration and invasion of EVTs is critical for the maintenance of a successful pregnancy. During the first trimester, CTs undergo an EMT-like process and differentiate into EVTs. These EVTs migrate and invade
Journal Article
TGFβ signalling: a nexus between inflammation, placental health and preeclampsia throughout pregnancy
Human Reproduction Update, dmae007, https://doi.org/10.1093/humupd/dmae007
Published: 22 March 2024
Image
Graphical Abstract TGFβ signalling governs essential processes in place...
in
Human Reproduction Update
>
TGFβ signalling: a nexus between inflammation, placental health and preeclampsia throughout pregnancy
Published: 22 March 2024
Graphical Abstract
Graphical Abstract TGFβ signalling governs essential processes in placental development, coordinating trophoblast invasion, vascularization, immune tolerance, and tissue remodelling across cell types, to ensure a healthy pregnancy outcome.
Image
TGFβ signalling in the placenta. ( A ) TGFβ signalling in the first and th...
in
Human Reproduction Update
>
TGFβ signalling: a nexus between inflammation, placental health and preeclampsia throughout pregnancy
Published: 22 March 2024
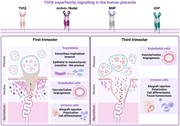
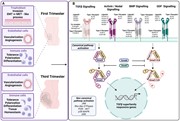
Figure 1.
TGFβ signalling in the placenta. ( A ) TGFβ signalling in the first and third trimester placenta. TGFβ signalling is crucial for placental development and the functional regulation of placental cells. In trophoblasts, particularly during the first trimester, TGFβ signalling is involved in regulatin
Image
The unequal importance of TGFβ signalling in PE-compromised placental cells...
in
Human Reproduction Update
>
TGFβ signalling: a nexus between inflammation, placental health and preeclampsia throughout pregnancy
Published: 22 March 2024
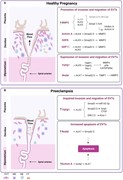
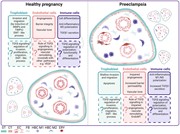
Figure 3.
The unequal importance of TGFβ signalling in PE-compromised placental cells. The figure provides a cross-sectional representation of the placental villous structure, illustrating a comparison between a healthy (CTR) placenta and a preeclamptic (PE) placenta. The main placental cell types, including
Journal Article
Revealing the molecular landscape of human placenta: a systematic review and meta-analysis of single-cell RNA sequencing studies
Human Reproduction Update, dmae006, https://doi.org/10.1093/humupd/dmae006
Published: 13 March 2024
Image
Regression between the number of reads/cell and the mean genes/cell or the ...
in
Human Reproduction Update
>
Revealing the molecular landscape of human placenta: a systematic review and meta-analysis of single-cell RNA sequencing studies
Published: 13 March 2024
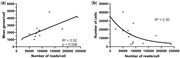
Figure 1.
Regression between the number of reads/cell and the mean genes/cell or the total number of cells. Data from single-cell RNA sequencings of human placentas using 10×. ( a ) Reads/cell compared to the mean genes/cell; ( b ) reads/cell compared to the total number of cells; R 2 calculated using lin
Image
Results of integration of raw data from first trimester human placentas . (...
in
Human Reproduction Update
>
Revealing the molecular landscape of human placenta: a systematic review and meta-analysis of single-cell RNA sequencing studies
Published: 13 March 2024
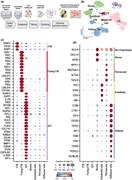
Figure 5.
Results of integration of raw data from first trimester human placentas . ( a ) Representation of the process for the integration. ( b ) UMAP of the integration. Dotplots of the genes identified using the comparison of already annotated datasets, the curation of markers genes and integration for tro
Image
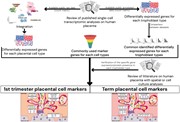
Graphical abstract Following the integration of existing single-cell t...
in
Human Reproduction Update
>
Revealing the molecular landscape of human placenta: a systematic review and meta-analysis of single-cell RNA sequencing studies
Published: 13 March 2024
Graphical abstract Following the integration of existing single-cell transcriptomic data and a comprehensive literature review, we successfully identified marker genes crucial for defining distinct placental cell types. CTB: cytotrophoblast; EVT: extravillous trophoblast .
Image
Upset plots of differentially expressed genes in the different trophoblast ...
in
Human Reproduction Update
>
Revealing the molecular landscape of human placenta: a systematic review and meta-analysis of single-cell RNA sequencing studies
Published: 13 March 2024
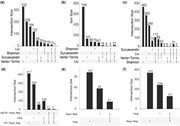
Figure 4.
Upset plots of differentially expressed genes in the different trophoblast types by comparing original count matrices of studies on first trimester and term human placenta . ( a ) and ( d ) CTB, ( b ) and ( e ) STB, ( c ) and ( f ) EVT differentially expressed genes. (a–c) correspond to analysis of
Image
Results of integration of raw data from term human placentas . ( a ) Repres...
in
Human Reproduction Update
>
Revealing the molecular landscape of human placenta: a systematic review and meta-analysis of single-cell RNA sequencing studies
Published: 13 March 2024
Figure 6.
Results of integration of raw data from term human placentas . ( a ) Representation of the process for the integration. ( b ) UMAP of the integration. Dotplots of the genes identified using the comparison of already annotated datasets, the curation of markers genes, and integration for trophoblasts
Image
Specific markers of human first trimester and term placental villous cells ...
in
Human Reproduction Update
>
Revealing the molecular landscape of human placenta: a systematic review and meta-analysis of single-cell RNA sequencing studies
Published: 13 March 2024
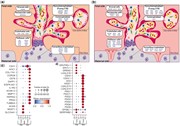
Figure 7.
Specific markers of human first trimester and term placental villous cells and their evolution across pregnancy . ( a ) Representation of human placenta from first trimester with specific markers identified in this review. ( b ) Representation of human placenta at term with specific markers identifi
Image
Heatmap of commonly used genes to define the different human placental cell...
in
Human Reproduction Update
>
Revealing the molecular landscape of human placenta: a systematic review and meta-analysis of single-cell RNA sequencing studies
Published: 13 March 2024
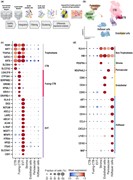
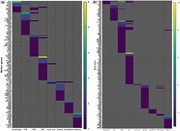
Figure 2.
Heatmap of commonly used genes to define the different human placental cell types from first trimester and term. Analysis of first trimester ( a ) and term ( b ) literature on single-cell RNA sequencing of human placenta. The scale bar represents the occurrence of the gene as a marker to define pla
