


Abstract
Background Lesbian, gay and bisexual (LGB) populations evidence higher rates of psychiatric disorders than heterosexuals, but most LGB individuals do not have mental-health problems. The present study examined risk modifiers at the social/contextual level that may protect LGB individuals from the development of psychiatric disorders.
Methods Data are drawn from Wave 2 of the National Epidemiologic Survey on Alcohol and Related Conditions (N = 34 653), a nationally representative study of non-institutionalized US adults. Risk variables included social isolation and economic adversity. High state-level concentration of same-sex couples, obtained from the US Census, was examined as a protective factor.
Results The past-year prevalence of major depression and generalized anxiety disorder was lower among LGB respondents living in states with higher concentrations of same-sex couples, compared with LGB respondents in states with lower concentrations. Additionally, the increased risk for mood and anxiety disorders among LGB individuals exposed to economic adversity and social isolation was evident only in states with low concentrations of same-sex couples. These interactions between the risk and protective factors were not found among heterosexuals, suggesting specificity of the effects to LGB individuals. Results were not attenuated after controlling for socio-demographic factors, state-level income inequality, state-level policies targeting LGBs and state-level attitudes towards LGB-relevant issues.
Conclusions These results provide evidence for the protective effect of social/contextual influences on the prevalence of psychiatric disorders in LGB individuals. Measures of the social environment should be incorporated into future research on the mental health of LGB populations.
Introduction
Lesbian, gay and bisexual (LGB) populations are at increased risk for multiple mental-health burdens compared with heterosexuals.1–3 A growing body of research has aimed to identify the determinants that drive these disparities; consequently, scholarly attention has focused on identifying risk factors at both the individual and structural level. This research has provided important information, but it has obscured the fact that many, even most, LGB individuals do not develop mental-health problems. Recent psychiatric epidemiological surveys have shown that the majority of LGB individuals do not meet diagnostic criteria for psychiatric disorders.2–4 Evidence from these studies suggests the existence of factors that protect against the development of mental-health problems, but few studies have attempted to identify such factors. Consequently, numerous questions about factors that may have a beneficial effect on mental health in LGB populations remain unanswered.
First, protective factors have been conceptualized as characteristics that ameliorate the negative effects of a potentially harmful exposure.5 The identification of a protective factor, therefore, requires evidence that it interacts with a stressor or adverse event to predict poor health, such that those at high risk are buffered from negative outcomes in the presence of the protective factor, whereas those at low risk derive minimal benefits. Existing studies with LGB samples, however, have examined only main-effect models. Research is therefore needed to identify protective factors that reduce the risk of developing psychiatric disorders in the context of exposure to adverse circumstances. Secondly, given that disparities in psychiatric morbidity among LGB populations emerge early in development, research has concentrated on factors that buffer LGB adolescents from experiencing mental-health problems. Greater attention is needed to understand protective processes across the life course,6 especially among LGB adults, who also evidence elevated rates of psychiatric disorders.1–3 Finally, consistent with resilience research more broadly, existing research on factors that may reduce mental-health disparities in LGB populations has relied almost exclusively on individual-level measures, such as social support.7,8 As such, there has been limited investigation of contextual-level protective factors, which have been shown to buffer other at-risk populations from the development of adverse outcomes.9 Identification of contextual factors that confer protection against the development of psychiatric morbidity represents an important public health priority, given the opportunities to target such factors with policies and structural interventions that may hold greater potential for influencing population mental health than existing individual-level interventions.
Drawing on the psychological literature on risk and protective factors in the context of adversity,5,6 the goal of the current study was to examine risk modifiers at the social/contextual level that may protect LGB individuals from the development of mood and anxiety disorders. Specifically, we used the concentration of same-sex couples at the state level, which was obtained from the US Census, as our measure of a protective social/contextual factor. There is an extensive literature documenting that racial/ethnic minorities living in neighbourhoods with greater densities of individuals from their racial/ethnic group have lower levels of mental-health problems,10–12 including depression and anxiety.13,14 Based on this research, we hypothesized that LGB individuals living in states with greater concentrations of same-sex couples would have lower prevalence of mood and anxiety disorders. Additionally, we evaluated whether LGB individuals living in states with greater concentrations of same-sex couples were buffered against the negative effects of two well-established risk factors for the development of psychopathology: economic adversity15–17 and social isolation.18,19 These two risk factors are also particularly relevant for LGB individuals.20,21 This study therefore represents a novel attempt to identify social/contextual-level influences that protect against psychiatric morbidity in LGB populations, and to evaluate whether these protective influences exert salubrious effects on mental health even in the context of exposure to economic and social risk factors for psychopathology.
Methods
Sample
Data are drawn from Wave 2 of the National Epidemiologic Survey on Alcohol and Related Conditions (NESARC), a longitudinal population-based epidemiological survey of civilian non-institutionalized US adults aged ≥18 years. Wave 1 was conducted in 2001–02, with a follow-up in 2004–05. Of the 43 093 Wave 1 participants, 34 653 (86.7%) participated in face-to-face re-interviews at Wave 2. The cumulative response rate was 70.2%. Sample weights for Wave 2 respondents were calculated to ensure that they were representative of the non-institutionalized US population in 2000. The present study focused on participants at the Wave 2 survey, as data on sexual orientation were only collected at this time point. Further information on the study design and implementation is found elsewhere.22 All procedures received full ethical review and approval from the US Census Bureau and U.S. Office of Management and Budget.
Measures
Sexual orientation
Participants were asked ‘Which of the categories best describes you?’ and were given four categories: heterosexual (straight), gay or lesbian, bisexual and not sure. Of the total NESARC sample, 577 (1.67%) respondents self-identified as gay, lesbian or bisexual (men: 1.86%, women: 1.52%), which is comparable with rates seen in other nationally representative surveys.3 Preliminary analyses indicated that the direction and magnitude of the effects were similar across lesbians, gays, and bisexuals; thus, these three groups were combined in the present analysis to maximize power. Further information on the LGB sample is found elsewhere.4
Risk factors
Economic adversity
Respondents indicated whether they had experienced any of the following three adverse economic events in the past 12 months: (i) being fired or losing a job; (ii) being unemployed and looking for work for longer than a month; and (iii) experiencing a major financial crisis, declaring bankruptcy or being unable to pay their bills on more than one occasion (α = 0.93). We created a dichotomous variable indicating whether each respondent had experienced any of the three adverse economic events in the past year.
Social isolation
We used the Social Network Index (SNI) as an indicator of social isolation.23 The SNI assesses participation in 11 types of social relationships, such as spouse/partner, work colleagues and neighbours. The total number of such persons whom respondents saw or talked on the phone or Internet at least once every 2 weeks was summed to create a continuous indicator of the number of network members, ranging from 0 to 235 members. Previous analysis indicated good test–retest reliability for this scale [intraclass correlation coefficient (ICC = 0.70)].24 Respondents whose reports of the number of network members were in the lowest quartile of the distribution were coded 1; all other respondents were coded 0.
Protective factor
We used data from the Census Bureau’s Census 2000 Summary File 2 to calculate the state-level concentration of same-sex partners.25 This measure assessed where gay and lesbian couples live relative to the general population, depicting the extent to which same-sex couples are either over- or under-represented in a particular state (Figure 1). The index of same-sex couples was calculated using the total number of households, as well as the number of households headed by a male and female same-sex unmarried partner couple for each census tract or county. These numbers were summed over the entire state. This total was then transformed into a relative proportion. For example, a value of 2.0 means that same-sex couples are twice as likely as the typical households to be living in that state (i.e. same-sex couples are more concentrated in that state).
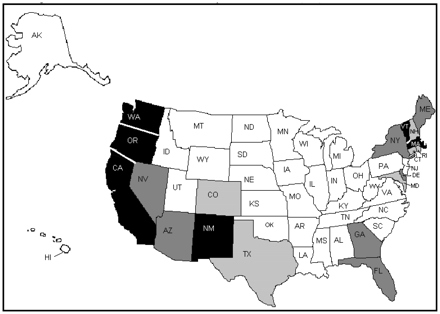
State-level concentration of same-sex couples in the USA (2000).25 Figure depicts quartiles of the concentration of same-sex couples in the USA in 2000. White = low concentration, light grey = moderate concentration, dark grey = high concentration, black = very high concentration. Reprinted with permission from the Urban Institute Press
State-level covariates
In order to rule out spurious contextual influences on our results, we controlled for three state-level confounders. First, based on previous research examining state-level influences on health outcomes,26 we adjusted for state-level income inequality. We calculated the ratio of the top fifth to the bottom fifth of household income by state using census data from 1998 to 2000.27 Secondly, previous research has shown that LGB individuals living in states with more protective policies (i.e. employment non-discrimination and hate crimes protections) have lower rates of psychiatric disorders.4 Consequently, we created a sum of the presence or absence of these two policies and included this as a covariate. Thirdly, there is currently substantial regional variation in terms of attitudes towards LGBs. As such, we controlled for mean state-level attitudes towards LGB-relevant issues (e.g. gay marriage and gay adoptions) based on a recent measure of attitudes collected from several large-scale studies.28
Outcome variables
Past-year Diagnostic and Statistical Manual of Mental Disorders, 4th Edition (DSM-IV) mood and anxiety disorders were assessed by the Alcohol Use Disorder and Associated Disabilities Interview Schedule-IV (AUDADIS-IV),29 a face-to-face structured diagnostic interview. We examined the following disorders: major depression, dysthymia, generalized anxiety disorder (GAD), panic disorder with or without agoraphobia, social phobia and post-traumatic stress disorder (PTSD). Substance-induced disorders, disorders due to somatic illnesses, and (in the case of major depression) bereavement, were each ruled out, per DSM-IV definitions.30 Diagnoses all met the DSM-IV30 criterion requiring distress or social/occupational dysfunction. The reliability and validity (including psychiatrist re-appraisal) of mood and anxiety disorder diagnosis and symptom items range from fair (κ for specific phobia = 0.42) to good (κ for PTSD = 0.77).24,31,32 Diagnoses were further validated using the SF-12v2, a mental disability score, in controlled linear regressions.33
Statistical analysis
First, we examined the associations between the risk factors, economic adversity and social isolation, and psychiatric disorders among LGB respondents using cross-tabulations and logistic regression models. We examined these associations in both unadjusted models and in models adjusted for sex, age, race/ethnicity, education, marital status, personal income, state-level income inequality, state-level policies targeting LGBs and state-level attitudes towards LGB-relevant issues. Secondly, we examined the association between the protective factor, state-level concentration of same-sex couples, and psychiatric disorders using the same modelling approach. Thirdly, we examined whether economic adversity and social isolation interacted with concentration of same-sex couples. We stratified respondents based on the presence of the protective factor (i.e. separating respondents living in states above vs below the median on concentration of same-sex couples), and regressed psychiatric morbidity on economic adversity and social isolation using logistic models adjusted for the covariates used in the main effect models described above. Finally, we examined the specificity of our findings to LGB individuals by replicating analyses among non-LGB respondents. Analyses were conducted using SUDAAN software version 10.0 to adjust standard errors for the complex sampling design of the NESARC. Measures in the present analyses involved negligible missing responses; all missing data were handled by exclusion.
Results
Associations between risk factors and psychiatric disorders
The prevalence of each of the mood and anxiety disorders was higher among LGB respondents who reported one or more adverse economic event in the past year than among LGB individuals reporting no such events (Table 1). In adjusted models, economic adversity remained positively associated with each of the eight psychiatric outcomes.
Association between economic adversity, social isolation and psychiatric disorders among LGB respondents (N = 577)
| High risk % | Low risk % | ORa 95% CI | ORb 95% CI | |
|---|---|---|---|---|
| Economic adversityc | ||||
| Any mood disorder | 29.5 | 12.1 | 3.0 (1.8–5.1) | 2.2 (1.2–4.0) |
| Major depression | 28.4 | 12.1 | 2.9 (1.7–4.9) | 2.1 (1.2–3.8) |
| Dysthymia | 4.8 | 0.6 | 8.1 (1.5–44.2) | 11.8 (1.7–82.1) |
| Any anxiety disorder | 33.3 | 18.9 | 2.1 (1.3–3.5) | 1.5 (0.8–2.6) |
| GAD | 13.9 | 5.5 | 2.8 (1.3–6.2) | 2.3 (1.1–5.1) |
| Social phobia | 10.1 | 4.6 | 2.4 (1.1–5.0) | 1.6 (0.7–3.7) |
| PTSD | 18.9 | 9.7 | 2.2 (1.3–3.7) | 1.6 (0.9–3.0) |
| Panic disorder | 14.1 | 4.8 | 3.2 (1.5–7.2) | 2.5 (1.1–5.6) |
| Social isolationd | ||||
| Any mood disorder | 31.1 | 14.0 | 2.8 (1.6–4.8) | 2.5 (1.3–4.7) |
| Major depression | 30.1 | 13.9 | 2.7 (1.5–4.7) | 2.4 (1.3–4.5) |
| Dysthymia | 2.5 | 2.0 | 1.2 (0.4–4.4) | 1.0 (0.1–6.2) |
| Any anxiety disorder | 30.5 | 21.9 | 1.6 (0.9–2.6) | 1.3 (0.7-2.2) |
| GAD | 10.0 | 8.0 | 1.3 (0.6–2.9) | 1.3 (0.6–2.9) |
| Social phobia | 14.5 | 3.9 | 4.2 (1.9–9.15) | 3.0 (1.3–6.9) |
| PTSD | 17.0 | 11.7 | 1.6 (0.9–2.8) | 1.2 (0.7–2.3) |
| Panic disorder | 14.8 | 5.9 | 2.8 (1.2–6.4) | 2.6 (1.2–5.8) |
aUnadjusted model.
bAdjusted for sex, age, race/ethnicity, education, marital status, personal income, state-level income inequality, presence of state policies extending protections to LGBs and mean state-level attitudes towards LGB-relevant issues.
cRespondents who reported none of the three economic adversity events were considered low risk; respondents with one or more events were considered high risk.
dRespondents in the upper 75% of the distribution of number of network members were considered low risk; respondents in the bottom 25% of the distribution of number of network members were considered high risk.
OR = odds ratio; CI = confidence interval.
We observed similar patterns of results when we examined the association of social isolation with psychiatric disorders, such that the prevalence of mood and anxiety disorders was higher among LGB respondents who were socially isolated than among LGB individuals who were not isolated. In adjusted models, social isolation was positively associated with each of the psychiatric outcomes, with the exception of dysthymia.
Associations between protective factor and psychiatric disorders
The prevalence of any mood disorder was higher among LGB respondents living in states with a low concentration of same-sex couples (21.9%) than among LGB respondents living in states with higher concentrations (16.1%) (Table 2). The prevalence of any anxiety disorder was similar among respondents living in states with high (23.6%) and low (25.0%) concentrations of same-sex couples. In adjusted models, state-level concentration of same-sex couples was inversely associated with six of the eight (62.5%) psychiatric outcomes.
Association between concentration of same-sex couples in respondent state and psychiatric disorders among LGB (N = 577) and heterosexual (N = 34 076) respondents
| High concentration % | Low concentration % | ORa (95% CI) | ORb (95% CI) | |
|---|---|---|---|---|
| LGBs | (n = 355) | (n = 222) | ||
| Any mood disorder | 16.1 | 21.9 | 0.7 (0.4–1.1) | 0.5 (0.3–0.9) |
| Major depression | 15.9 | 21.3 | 0.7 (0.4–1.2) | 0.5 (0.3–0.9) |
| Dysthymia | 1.0 | 3.8 | 0.3 (0.1–1.0) | 0.3 (0.1–1.5) |
| Any anxiety disorder | 23.6 | 25.0 | 0.9 (0.6–1.5) | 0.9 (0.5–1.7) |
| GAD | 5.9 | 12.4 | 0.4 (0.2-1.0) | 0.3 (0.1–0.8) |
| Social phobia | 6.3 | 7.0 | 0.9 (0.4–1.8) | 1.5 (0.6–3.9) |
| PTSD | 13.1 | 13.0 | 1.0 (0.6–1.8) | 1.4 (0.7–2.6) |
| Panic disorder | 7.0 | 9.9 | 0.7 (0.3–1.5) | 0.4 (0.1–1.1) |
| Heterosexuals | (n = 17 396) | (n = 16 680) | ||
| Any mood disorder | 8.4 | 8.6 | 1.0 (0.9–1.2) | 1.0 (0.9–1.2) |
| Major depression | 8.0 | 8.2 | 1.0 (0.9–1.2) | 1.0 (0.9–1.2) |
| Dysthymia | 1.0 | 1.3 | 1.3 (1.0–1.6) | 1.3 (1.0–2.1) |
| Any anxiety disorder | 11.0 | 11.6 | 1.1 (1.0–1.2) | 1.1 (0.9–1.2) |
| GAD | 3.5 | 3.9 | 1.1 (0.9–1.3) | 1.1 (0.9–1.3) |
| Social phobia | 2.3 | 2.7 | 1.2 (1.0–1.4) | 0.9 (0.7–1.2) |
| PTSD | 6.3 | 6.5 | 1.1 (0.9–1.2) | 1.0 (0.9–1.2) |
| Panic disorder | 2.2 | 2.7 | 1.2 (1.0–1.4) | 0.9 (0.7–1.1) |
aUnadjusted model.
bAdjusted for sex, age, race/ethnicity, education, marital status, personal income, state-level income inequality, presence of state policies extending protections to LGBs and mean state-level attitudes towards LGB-relevant issues.
OR = odds ratio; CI = confidence interval.
The prevalence of past-year mood and anxiety disorders among heterosexual respondents did not differ as a function of the state-level concentration of same-sex couples.
Interaction between risk and protective factors among LGB respondents
We observed a number of interactions between state-level concentration of same-sex couples and the presence of past-year economic adversity in predicting mood and anxiety disorders among LGB respondents (Table 3). The interaction between economic adversity and our protective factor predicted any mood disorder, major depression, any anxiety disorder and PTSD. To explore these interactions, we stratified on state-level concentration of same-sex couples and examined the association of economic adversity with each of the psychiatric outcomes. Among LGB respondents living in states with a low concentration of same-sex couples, economic adversity was associated with any mood disorder, major depression, dysthymia, any anxiety disorder, GAD, PTSD and panic disorder. In contrast, economic adversity was not associated with any of the mood or anxiety disorder outcomes among LGB respondents living in states with a high concentration of same-sex couples.
Association between economic adversity and psychiatric disorders as a function of concentration of same-sex couples in respondent state among LGB respondentsa (N = 577)
| Low concentration, economic adversity, (n = 80) | Low concentration, no economic adversity, (n = 142) | High concentration, economic adversity (n = 111) | High concentration, no economic adversity (n = 244) | |||||||
|---|---|---|---|---|---|---|---|---|---|---|
| % | OR (95% CI) | % | OR (95% CI) | % | OR (95% CI) | % | OR (95% CI) | F-test for interactionb | P-value | |
| Any mood disorder | 40.8 | 4.1 (1.6–10.2) | 10.9 | 1.00 | 21.8 | 1.4 (0.7–3.1) | 12.9 | 1.00 | 4.4 | 0.04 |
| Major depression | 39.0 | 3.8 (1.5–9.6) | 21.2 | 1.00 | 10.9 | 1.4 (0.6–3.1) | 12.9 | 1.00 | 4.1 | 0.047 |
| Dysthymia | 9.3 | 32.5 (3.3–321.0) | 1.6 | 1.00 | 0.5 | 2.9 (0.1–58.5) | 0.7 | 1.00 | 1.4 | 0.25 |
| Any anxiety disorder | 41.7 | 2.8 (1.1–6.7) | 27.6 | 1.00 | 15.2 | 1.1 (0.5–2.2) | 21.3 | 1.00 | 4.0 | 0.04 |
| GAD | 22.8 | 4.6 (1.4–15.4) | 7.8 | 1.00 | 6.4 | 1.6 (0.6–4.2) | 4.9 | 1.00 | 3.2 | 0.07 |
| Social phobia | 13.9 | 2.5 (0.6–10.6) | 7.5 | 1.00 | 3.1 | 1.2 (0.4–3.9) | 5.6 | 1.00 | 1.7 | 0.19 |
| PTSD | 24.6 | 6.2 (2.0–19.3) | 15.1 | 1.00 | 6.2 | 1.2 (0.5–2.9) | 11.9 | 1.00 | 5.0 | 0.03 |
| Panic disorder | 18.3 | 3.2 (1.1–10.8) | 11.2 | 1.00 | 5.0 | 1.8 (0.4–7.2) | 4.7 | 1.00 | 0.6 | 0.45 |
aAdjusted for sex, age, race/ethnicity, education, marital status, personal income, state-level income inequality, presence of state policies extending protections to LGBs and mean state-level attitudes towards LGB-relevant issues.
bInteraction between economic adversity and concentration of same-sex couples in predicting psychiatric outcomes.
OR = odds ratio; CI = confidence interval.
We found similar patterns of interactions between state-level concentration of same-sex couples and social isolation in predicting mood and anxiety disorders among LGB respondents. The interaction between social isolation and state-level concentration of same-sex couples predicted any mood disorder, major depression, any anxiety disorder and panic disorder. After stratifying on state-level concentration of same-sex couples, social isolation was associated with any mood disorder, social phobia and panic disorder among LGB respondents living in states with a low concentration of same-sex couples (Table 4). Social isolation was not associated with any mood or anxiety disorders among LGB respondents living in states with a high concentration of same-sex couples.
Association between social isolation and psychiatric disorders as a function of concentration of same-sex couples in respondent state among LGB respondentsa (N = 577)
| Low concentration, social isolation, (n = 71) | Low concentration, no social isolation, (n = 151) | High concentration, social isolation (n = 89) | High concentration, no social isolation (n = 266) | |||||||
|---|---|---|---|---|---|---|---|---|---|---|
| % | OR (95% CI) | % | OR (95% CI) | % | OR (95% CI) | % | OR (95% CI) | F-test for interactionb | P-value | |
| Any mood disorder | 26.2 | 2.8 (1.1–7.3) | 17.9 | 1.00 | 16.8 | 2.1 (0.9–5.2) | 14.4 | 1.00 | 6.0 | 0.02 |
| Major depression | 25.0 | 2.7 (0.8–5.6) | 17.9 | 1.00 | 16.8 | 2.2 (0.9–5.3) | 13.9 | 1.00 | 5.4 | 0.02 |
| Dysthymia | 2.8 | 1.8 (0.2–18.4) | 1.7 | 1.00 | 5.0 | 0.1 (0.0–2.5) | 0.4 | 1.00 | 0.02 | 0.86 |
| Any anxiety disorder | 31.5 | 1.5 (0.7–3.4) | 23.4 | 1.00 | 17.1 | 1.0 (0.5–2.2) | 23.7 | 1.00 | 4.8 | 0.03 |
| GAD | 14.8 | 1.5 (0.6–4.2) | 5.1 | 1.00 | 9.6 | 0.5 (0.1–3.1) | 6.7 | 1.00 | 3.8 | 0.06 |
| Social phobia | 11.2 | 6.0 (1.5–24.2) | 9.3 | 1.00 | 2.1 | 3.0 (0.9–8.5) | 3.4 | 1.00 | 1.0 | 0.30 |
| PTSD | 15.4 | 1.5 (0.6–3.9) | 13.6 | 1.00 | 10.0 | 0.9 (0.3–2.8) | 12.6 | 1.00 | 1.0 | 0.30 |
| Panic disorder | 12.6 | 3.6 (1.3–9.9) | 4.8 | 1.00 | 6.8 | 1.7 (0.4–7.2) | 9.1 | 1.00 | 5.6 | 0.03 |
aAdjusted for sex, age, race/ethnicity, education, marital status, personal income, state-level income inequality, presence of state policies extending protections to LGBs and mean state-level attitudes towards LGB-relevant issues.
bInteraction between social isolation and concentration of same-sex couples in predicting psychiatric outcomes.
OR = odds ratio; CI = confidence interval.
We found no interactions between state-level concentration of same-sex couples and either economic adversity or social isolation in predicting past-year mood and anxiety disorders among heterosexual respondents (Table 5). These results indicate that the protective effects of living in a state with a greater concentration of same-sex couples are conferred specifically to LGB individuals in those states.
Interaction of concentration of same-sex couples in respondent state with economic adversity and social isolation in predicting psychiatric disorders among heterosexual respondentsa (N = 34 076)
| Interaction with economic adversityb | Interaction with social isolationc | |||
|---|---|---|---|---|
| F-value | P-value | F-value | P-value | |
| Any mood disorder | 0.3 | 0.58 | 0.0 | 0.91 |
| Major depression | 0.3 | 0.58 | 0.0 | 0.91 |
| Dysthymia | 0.2 | 0.68 | 1.0 | 0.32 |
| Any anxiety disorder | 0.1 | 0.76 | 0.3 | 0.56 |
| GAD | 0.7 | 0.41 | 0.2 | 0.66 |
| Social phobia | 0.1 | 0.74 | 0.6 | 0.42 |
| PTSD | 2.7 | 0.10 | 3.2 | 0.08 |
| Panic disorder | 2.0 | 0.16 | 0.1 | 0.71 |
aModels adjusted for sex, age, race/ethnicity, education, marital status, personal income, state-level income inequality, presence of state policies extending protections to LGBs and mean state-level attitudes towards LGB-relevant issues.
bInteraction between concentration of same-sex couples with economic adversity.
cInteraction between concentration of same-sex couples with social isolation.
Discussion
The primary goal of the current study was to examine social and contextual processes that confer protection against psychiatric morbidity within LGB populations. Specifically, we identified a contextual factor unique to LGB individuals—the concentration of same-sex couples in one’s state of residence—and showed that LGB individuals exposed to economic adversity and social isolation experienced increased risk for past-year mood and anxiety disorders ‘only’ in states with low concentrations of same-sex couples. To our knowledge, this is the first study to demonstrate that a social–contextual factor exerted a salubrious effect on the mental health of LGB populations, despite exposure to robust predictors of psychiatric morbidity. Importantly, these results were not attenuated after adjusting for multiple socio-demographic characteristics, as well as potential confounds, including state-level income inequality, state-level policies targeting LGBs and state-level attitudes towards LGB-relevant issues. Moreover, these results were specific to LGB respondents; among heterosexuals, no interactions emerged between state-level concentration of same-sex couples and either risk factor in predicting mood and anxiety disorders.
We propose two potential pathways through which greater density of same-sex couples may lead to better mental health among LGBs in the context of adversity: increases in social capital and decreases in discrimination. Social capital refers to features of the social environment that facilitate cooperation and integration among community members.34 Prior research has found lower depressive symptoms among Latinos residing in communities with greater density of other Latinos,13 and these health-buffering effects are believed to result from strong social networks and the social capital that these ties foster.35 Although there are important differences between sexual and racial/ethnic minorities, this research suggests that areas with higher concentrations of same-sex couples may be similarly likely to confer greater social capital among LGBs.
Research on the ‘ethnic density effect’ has shown that racial/ethnic minorities living in areas of higher within-group density are also less likely to perceive discrimination.12,14 A higher density of same-sex couples could similarly diminish discrimination against sexual minorities in a number of ways. States with larger numbers of same-sex couples may facilitate greater collective action36 among LGBs, which may enable the election of legislators who endorse pro-gay platforms. Greater density of same-sex couples may also reduce discrimination through changing negative attitudes of heterosexuals, as suggested by the inter-group contact theory.37 Heterosexuals who personally know sexual minorities have more favorable attitudes towards these groups than heterosexuals without such contact,38 and a greater number of same-sex couples in a state increases the likelihood that others come into contact with LGB individuals. Additional research is needed to further explore these and other potential pathways.
The study has a number of limitations. First, we are unable to infer causal association between the risk and protective factors and psychiatric disorders due to the cross-sectional design. Reverse causality may be responsible for some of these associations. For example, individuals with mood and anxiety disorders may have smaller social networks than individuals without these disorders. However, evidence from a large number of prospective studies shows that social isolation predicts the subsequent onset of major depression and increases in depressive symptoms.39,40
Secondly, LGB individuals with better mental health may be more likely to settle in places with higher concentrations of same-sex couples. Some research has indicated that regional migration patterns of same-sex couples do not differ from migration patterns of heterosexuals;41 however, these results require replication among LGB individuals who are not in partnered relationships. Prospective studies are therefore needed to determine whether selection effects are responsible for the associations documented in the current study. Thirdly, because the effects were largely similar across the three sexual minority groups, we combined lesbians and gays with bisexual participants. It is important to acknowledge, however, that bisexuals have health profiles and risk factors that are somewhat distinct from individuals with same-sex sexual orientations.42 Future research is therefore needed to identify social/contextual processes that may confer protection against psychiatric morbidity specifically among bisexuals.
An additional limitation is that the NESARC only released information regarding state of residence at Wave 1. Movement between waves could have led to misclassification of a subset of respondents. Finally, in order to protect participant confidentiality, the NESARC does not release information below the state level. Consequently, we cannot examine relationships at a geographic level lower than the state. Substantial variation in health outcomes and health inequalities has been observed across smaller geographic areas, such as census tracts within the same US city.43–45 Some have argued that census tracts are the most relevant area-based measure for examining health inequities, most notably because of the ability to generate area-based measures of socio-economic status and poverty.46 The density of same-sex couples almost certainly varies across neighbourhoods, census tracts and cities within a state, and this variation may be related to differential psychiatric risk among LGB individuals across these smaller geographic areas. Examination of the associations of LGB mental health outcomes with density of same-sex couples and with other relevant social and contextual factors assessed at these smaller levels of aggregation represents a critical area for future research. Because of these limitations, our results are particularly striking given that these state-level protective factors are distal determinants of health compared with more proximal measures. As such, our results should likely be considered conservative estimates.
The current study also had several strengths. The large number of LGB respondents and population-based sampling scheme increases generalizability of the results. In addition to this methodological strength, the study provided novel data on the protective effects of social/contextual factors on psychiatric morbidity among LGB populations, even in the context of exposure to economic adversity and social isolation. It is our hope that these results will focus greater scholarly attention on protective processes in LGB populations, particularly risk modifiers at the social/contextual level.
Funding
National Institute of Mental Health (Grant Number F31MH083401 to M.L.H.).
Acknowledgements
The content is the sole responsibility of the authors and does not necessarily represent the official views of the National Institutes of Health. The study’s funders had no role in the study design, data gathering, data analysis, data interpretation, or writing of this report. The authors thank the Robert Wood Johnson Foundation Health & Society Scholars program for its financial support.
Conflict of interest: None declared.
Because LGB populations are at greater risk for psychiatric disorders than heterosexuals, research has focused almost exclusively on understanding determinants of psychiatric morbidity, rather than on identifying factors that may protect against the development of mental-health problems.
This study demonstrated that exposure to two well-documented risk factors for psychopathology, social isolation and economic adversity, was associated with increased risk for mood and anxiety disorders among LGB individuals living in states with a low density of same-sex couples, but not among LGB individuals living in states with a high density of same-sex couples.
These results were not observed among heterosexual respondents, suggesting that the protective effects of living in states with a greater density of same-sex couples are conferred specifically to LGB individuals in those states.
References
Author notes
†Mark Hatzenbuehler is a Robert Wood Johnson Foundation Health & Society Scholar at Columbia University in New York City.

