


Abstract
Central and Eastern European (CEE) countries have lower life expectancies and higher alcohol-attributable mortality than Western European countries. We examine the contribution of alcohol consumption to mortality across Europe, and specifically to the East-West life expectancy gap from 1990 onward.
We retrieved alcohol-attributable mortality rates (GBD Study 2013) and all-cause mortality rates (Human Mortality Database) by age and sex for nine CEE countries and for the EU-15 countries. We assessed country-specific potential gains in life expectancy (PGLE) by eliminating alcohol-attributable mortality using associated single decrement life tables. We decomposed the life expectancy differences between each CEE country and the EU-15 population-weighted average for 1990–2012/13 into alcohol-attributable and non-alcohol-attributable mortality.
In 2012/13, the PGLE for men and women were, respectively, 2.15 and 1.00 years in the CEE region and 0.90 and 0.44 years in the EU-15 region. The contribution of alcohol to the East-West gap in life expectancy was largest among men in Russia {2.88 years [uncertainty interval (UI): 1.57–4.06]}, Belarus [3.70 years (UI: 1.75–5.45)] and Ukraine [2.47 years (UI: 0.90–3.88)]. The relative contributions increased in most of the countries between 1990 and 2005 (on average, from 17.0% to 25.4% for men, and from 14.7% to 22.5% for women), and declined thereafter (20.2% for men and 20.5% for women in 2012/13).
Alcohol contributed substantially to the East-West life expectancy gap in Europe, and to its increase (1990–2005) and decline (2005 onward). Diminishing alcohol consumption in CEE countries to Western European levels can contribute to mortality convergence across Europe.
The impact of alcohol on life expectancy differences over time in Europe is unknown.
Alcohol contributed substantially to the East-West life expectancy gap in Europe, especially among men and in Russia, Belarus and Ukraine.
The contribution of alcohol to the East-West life expectancy gap in Europe increased from 1990 to 2005.
Recent declines in alcohol-attributable mortality in CEE countries, fed by declines in alcohol consumption, have contributed to mortality convergence across Europe.
Further gains in life expectancy in CEE countries and in life expectancy convergence across Europe can be achieved partly by tackling excessive alcohol consumption in CEE countries and reducing differences in drinking patterns.
Introduction
Levels of alcohol consumption are higher in Europe than elsewhere in the world,1 and excess alcohol consumption is the third leading cause of premature death in the EU.2 Both alcohol prevalence and alcohol-attributable mortality levels differ substantially across Europe, with Eastern European countries experiencing higher levels of alcohol-attributable mortality than Western European countries.1,3–5 Eastern European countries also perform worse than Western European countries in terms of overall mortality and life expectancy, with countries in the East having lower life expectancies and more irregular trends than countries in the West.6,7 The marked East-West differences in both alcohol-attributable mortality4 and life expectancy7 suggest that alcohol contributes substantially to life expectancy differentials. Understanding the potential contribution of alcohol to the East-West life expectancy gap, and how it might be changing over time, is important for informing health policies aimed at reducing inequalities in mortality between countries.
Most of the previous research on the East-West mortality gap was based on analyses of broad groups of diseases6,8–11 and showed that cardiovascular diseases and injuries were the main contributors to this life expectancy gap.6,8,10,12,13 Because mortality from cardiovascular diseases and injuries is closely related to alcohol consumption in Eastern Europe,13–16 several authors have postulated that alcohol is one of the main drivers of mortality and mortality differences across Europe.8,17–22
The actual impact of alcohol on life expectancy levels and trends has been assessed in few countries,23,24 and only once on East-West life expectancy levels.6 This study by Zatoński estimated that in 2002, the contribution of alcohol to the life expectancy differences between the old and the new EU countries ranged from between 3% and 33% among men and between −8% and 22% among women.6
However, for non-EU countries the size of this gap remains unknown. When studying alcohol-attributable mortality across Europe, it is essential that Russia and other former Soviet countries are included, because relative to the EU countries, these countries have lower life expectancy levels and more irregular life expectancy trends,7 riskier drinking patterns25 and higher levels of alcohol-related mortality.26
In addition, it is unknown how the contribution of alcohol to East-West differences in life expectancy levels has developed in recent years. This is particularly interesting because of the East-West country-specific differences in life expectancy trends. Whereas life expectancy levels have gradually increased in Western Europe, in Eastern Europe they actually declined or stagnated from 1986 onwards. Increases re-occurred in central European countries around 1990 and in the Baltic states in 1995,7 but in the other former Soviet countries from 2005 onwards.27 This has led to divergence in mortality until 2005, followed by convergence.28 In this context, examining the relative importance of alcohol may provide insights into the determinants of mortality disparities across Europe.
Our aim is to examine the impact of alcohol consumption on mortality in 24 European countries, and its contribution to the East-West life expectancy gap from 1990 onward.
Methods
Settings
We studied the EU-15 countries as representative of Western Europe, and nine Central and Eastern European (CEE) countries: Belarus, the Czech Republic, Estonia, Hungary, Latvia, Lithuania, Poland, Russia and Ukraine.
Data
Alcohol-attributable mortality rates, with their corresponding 95% uncertainty intervals (UI), were retrieved from the Global Burden of Disease Study 2013 (GBD) by country, 5-year age group (up until 80+), sex and year (1990, 1995, 2000, 2005, 2010 and 2013).29,30 The GBD estimates include deaths due to causes wholly attributable to alcohol, and they estimated the proportions of deaths due to causes partly related to alcohol using alcohol prevalence and dose-specific relative risks.30,31
All-cause mortality data by country, year and 5-year age group were retrieved from the Human Mortality Database (HMD).32 We used 2012 all-cause mortality data (data for 2013 were not available for all countries) and 2013 alcohol-attributable mortality data to obtain results for 2012/13.
Methods
The analyses were performed separately by sex, using 5-year age group data (up to 110+). We applied the alcohol-attributable death rate for 80+ to the age groups from age 80 onward. Life expectancies at birth (e0) were calculated for each country using standard life table techniques.33 To visualize the geographical differences, we mapped e0 and age-standardized alcohol-attributable mortality for European countries for 2012 and 2013, respectively.
To estimate the contribution of alcohol to life expectancy in each individual country in 2012/13, we applied associated single decrement life tables (ASDLT)33 to non-alcohol-attributable mortality obtained by subtracting alcohol-attributable mortality from all-cause mortality. Comparing e0 from the ASDLT with the original e0, we obtained potential gains in life expectancy (PGLE) by eliminating alcohol-attributable mortality.
To estimate the East-West life expectancy gap by year, we calculated an average life expectancy for Western Europe using the total death counts and exposures from EU-15 countries, and subtracted from these population-weighted averages the life expectancies of each individual CEE country.
To estimate the contribution of alcohol to the East-West life expectancy gap, we used the decomposition technique by Andreev et al.34 This involved: (i) decomposing the differences in life expectancy into the contribution of each age-specific group;34 (ii) decomposing these age-specific contributions into the contribution of alcohol-attributable mortality and the contribution of non-alcohol-attributable mortality, by multiplying the age-specific contributions by the relative importance of alcohol to total mortality differences in each age group; and (iii) summing up the age-specific contributions of alcohol- and non-alcohol attributable mortality. The upper and lower 95% uncertainty intervals (UI) were obtained using the 95% UI data from CEE countries. All of the data analyses were performed using R 3.2.435 in R studio 0.99.893.36
Results
Descriptive results
Across Europe, the age-standardized alcohol-attributable mortality rates were higher for men than for women. For both men and women, these rates were higher in most of the CEE countries than in the Western European countries, in 2013 (Figure 1A). This pattern persisted over the period 1990–2013 (Supplementary Table 1, available as Supplementary data at IJE online). Life expectancies in 2012 displayed the same patterns (but inversed), and all of the Western European countries had higher life expectancy levels than the CEE countries (Figure 1B) across the period 1990–2012 (Supplementary Figure 1, available as Supplementary data at IJE online).
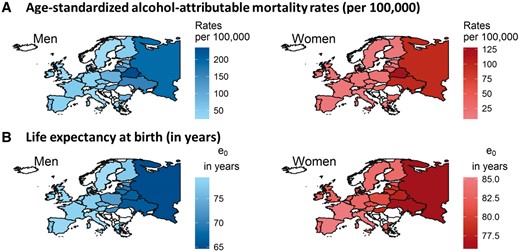
Age-standardized alcohol-attributable mortality (per 100,000) in Europe in 2013 (A) and life expectancy at birth (e0) in Europe in 2012 (B), by country and sex.
In 2012/13 in Western Europe, the average PGLE after alcohol-attributable mortality was eliminated was 0.90 years among men, ranging from 0.51 years (UI: 0.16–0.86) in Sweden to 1.43 years (UI: 1.10–1.76) in Portugal (Figure 2). Among women in Western Europe, the average PGLE was 0.44 years, ranging from 0.24 years (UI: −0.03 to 0.47) in Greece to 0.57 years (UI: 0.24–0.85) in Denmark. Among men in Eastern Europe, the average PGLE was 2.15 years, ranging from 1.13 years (UI: 0.75–1.47) in the Czech Republic to 3.59 years (UI: 2.14–5.10) in Belarus. The average PGLE among Eastern European women was 1.00 years, ranging from 0.38 years (UI: 0.07–0.64) to 2.38 years (UI: 1.19–3.75). Over the period 1990–2012/13, the PGLE were generally higher in the CEE countries than in the Western European countries (Supplementary Tables 2 and 3, available as Supplementary data at IJE online).
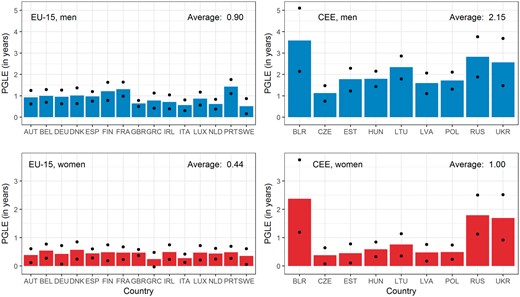
Potential gains in life expectancy (PGLE) by eliminating alcohol-attributable mortality in 2012/13, by country and sex. a. Black dots represent the upper and lower bounds of the uncertainty interval (UI). b. Country abbreviations: Austria (AUT), Belgium (BEL), Germany (DEU), Denmark (DNK), Spain (ESP), Finland (FIN), France (FRA), United Kingdom (GBR), Greece (GRC), Ireland (IRL), Italy (ITA), Luxembourg (LUX), Netherlands (NLD), Portugal (PRT), Sweden (SWE), Belarus (BLR), Czech Republic (CZE), Estonia (EST), Hungary (HUN), Lithuania (LTU), Latvia (LVA), Poland (POL), Russia (RUS), and Ukraine (UKR).
In 2013, the sizes of the life expectancy gaps between Eastern European countries and the average Western European level (78.7 years among men, 83.7 years among women) ranged from almost 4 to 15 years among men and from 2.5 to 8 years among women (Figure 3). The contribution of alcohol to the East-West difference in life expectancy was greater in Russia, Belarus and Ukraine than in any of the other countries (Figure 3). Among men, it was 3.70 years (UI: 1.75–5.45) in Belarus, 2.88 years (UI: 1.57–4.06) in Russia and 2.47 years (UI: 0.90–3.88) in Ukraine. The average across the other analysed countries (the Czech Republic, Estonia, Hungary, Latvia, Lithuania and Poland) was smaller, but still positive at 1.23 years. Among women, the gap was 2.14 years (UI: 1.01–3.24) in Belarus, 1.74 years (UI: 0.95–2.53) in Russia and 1.67 years (UI: 0.62–2.60) in Ukraine.
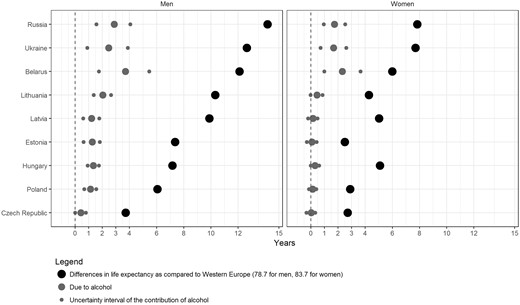
The contribution of alcohol to life expectancy differentials between nine CEE countries and the average Western European level in 2012/13, by sex.
In 2012/13, the contributions of alcohol to the life expectancy differences between individual CEE countries and Western Europe were at or above 20% in Russia, Belarus and Ukraine for both sexes (Figure 4; and Supplementary Table 4, available as Supplementary data at IJE online). In all of the other CEE countries, the contributions of alcohol were between 10% and 20% among men, and around or below 10% among women.
The relative contribution of alcohol to the life expectancy gap between individual CEE countries and the average Western European level over time (1990-2012/13), by sex.
The relative contributions of alcohol to the life expectancy gap increased between 1990 and 2005 from 17.0% to 25.4% among men and from 14.7% to 22.5% among women (population-weighted averages). Increases in the contributions of alcohol were observed in most of the countries over the period 1990–2005, except in Belarus and Hungary. Since 2005, the contribution of alcohol to life expectancy differences has been (slightly) declining in all of the CEE countries, except in Belarus and Poland; in 2012/13, the average contribution across the CEE countries had reached 20.2% among men and 20.5% among women.
Discussion
Summary of results
In 2012/13, the impact of alcohol on life expectancy was substantial, and was greater in the CEE countries (2.15 and 1.00 years of PGLE for men and women, respectively) than in the Western European countries (0.90 and 0.44 years). This impact differed greatly within the CEE region, and was largest among men in Belarus, Russia and Ukraine. In most of the CEE countries, the relative contribution of alcohol to the East-West gap in life expectancy increased between 1990 and 2005 (on average, from 17.0 to 25.4% among men and from 14.7% to 22.5% among women), but declined thereafter, falling to 20.2% among men and 20.5% among women in 2012/13. Recently, the relative contribution of alcohol among men has been relatively similar across the countries, whereas among women it has been larger in Belarus, Russia and Ukraine.
Evaluation of data
The study used harmonized, uniformly calculated, and comparable mortality data across countries from the Human Mortality Database (HMD).37 The data on deaths were nearly complete for all of the countries under study. To ensure the accuracy and consistency of the data, the HMD adjusted the raw population data for the CEE countries.38
The estimation of alcohol-attributable mortality is a challenge for researchers, as death certificates provide information on the so-called ‘underlying cause of death’ (e.g. heart disease, cancer or a digestive disease), but not on conditions underlying the occurrence of disease and injuries, such us excessive alcohol consumption. We have carefully considered different approaches for estimating alcohol-attributable mortality. In addition to using the Global Burden of Disease (GBD) approach, we considered two cause-of-death approaches: an approach that only takes into account the main diseases that are wholly attributed to alcohol consumption, as well as liver cirrhosis; and the Health for All-Database (HFA-DB) approach. The first method clearly underestimates alcohol-attributable mortality (Figure 5), because much of the impact of alcohol on health and mortality outcomes is channelled through diseases and injuries that are not caused solely by alcohol.39 The HFA-DB approach is based on strong assumptions, such as that all external deaths are due to alcohol. The GBD estimates include both deaths due to conditions that are wholly attributable to alcohol and a share of deaths due to conditions that are partly attributable to alcohol.
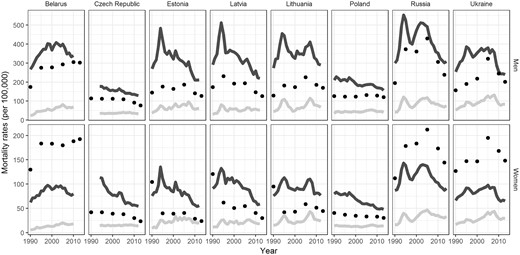
Comparison of age-standardized alcohol-attributable mortality rates between the GBD estimates (black dots), conditions wholly attributable to alcohol and liver cirrhosis (light gray line), and estimates using the HFADB definition (dark gray line)1, for selected CEE countries over time (1990-2012/2013)2. 1. Different approaches to estimating alcohol-attributable mortality exist. These can be divided into cause-of death-approaches and attributable fraction approaches. Examples of cause-of-death approaches are those that include the main diseases wholly attributable to alcohol consumption and liver cirrhosis (F10, K70-K76, X45); and the Health for All-Database (HFA-DB) approach, which includes cancers of the esophagus and larynx, alcohol dependence syndrome, liver cirrhosis, and all external causes (C15, C32, F10, K70-76, V00-Y99). The GBD estimates include both the share of deaths due to conditions wholly attributable to alcohol and the share of deaths due to conditions partly attributable to alcohol using alcohol prevalence data, cause-specific mortality, and dose-specific relative risks. Because the first method clearly underestimates alcohol-attributable mortality, whereas the second is based on strong assumptions (e.g., that all external deaths are due to alcohol), we used the GBD estimates for this article. 2. Data for Hungary were not available. Source: Own elaboration based on data from the Global Burden of Disease 2013 Study and from the Human Cause-of-death Database (http://www.causesofdeath.org/)..
The estimation of alcohol-attributable mortality from diseases that are partly attributable to alcohol depends on the quality of alcohol prevalence data and on the relative risks used.40,41Alcohol prevalence was estimated by the GBD using alcohol consumption per capita data, adjusted for unrecorded consumption (using a correction factor from WHO); and country survey data that provide information on the distribution of alcohol consumption according to sex and age.30 Although this approach is sophisticated, and enormous efforts have been made by Rehm and colleagues, the use of different sources of data for different countries and over time—which vary in their levels of completeness and accuracy—may have influenced our results. Thus, the GBD estimates are less reliable in countries with large shares of unreported alcohol consumption (Russia, Ukraine and Belarus), because of the inherent uncertainty of unrecorded alcohol consumption estimates.
In terms of the relative risks (RRs), it should be noted that the GBD used Russian sex-specific RRs11 for the most important causes of death partly attributable to alcohol for Russia, Belarus and Ukraine; for all of the estimations from 1990 to 2013;30 and for the Baltic states in 1990 (Max Griswold, personal communication, 13 August 2016). This was done to account for differences in the risk of dying from alcohol-related causes of death.11
However, Russian-specific RRs have several important limitations, as already discussed by Shield and Rehm.42 Additional analysis, in which we compared the GBD estimates with cause-specific alcohol-attributable mortality approaches (Figure 5), revealed that the GBD estimates for women—but not for men—are much higher in Russia, Belarus and Ukraine from 1990 to 2013. In addition, trends for women in Baltic states revealed high and unlikely differences between 1990 and 1995. Especially among women in the countries where Russian-specific RRs were applied, we should be cautious about the estimates. Overall time trends seem only affected for Baltic states in 1990–95.
Comparison of results
The only previous study that formally assessed the contribution of alcohol to life expectancy differences across European countries found that in 2002, the contribution of alcohol to the differences between new and the old EU countries (at ages 20–64) was 25% among men and 6% among women.6 Our all-age estimates are similar for men (weighted average of 22.1% in 2000 and 25.4% in 2005), but higher for women (18.2% and 22.5%). Differences in mortality ages above 65 have limited impact on the overall contribution to life expectancy differences across countries. Therefore, we do not expect the use of different age groups to have a big influence, although we recognize that our results may be slightly higher because of the use of all age groups. Moreover, both studies used similar methods to estimate alcohol-attributable mortality, except that we used more recent attributable fractions. A main difference is that we included Russia, Ukraine and Belarus, where levels of alcohol-attributable mortality are especially high for women.
Discussion of results
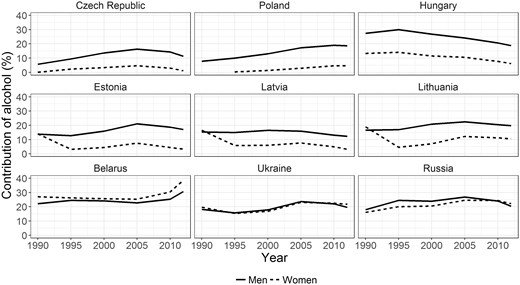
Our findings for 2012/13 that alcohol had a greater impact on life expectancy in the CEE countries than in the Western European countries, and that alcohol therefore made a positive contribution to the East-West differences in life expectancy, are likely related to the demonstrable East-West differences in alcohol consumption. In 2010, the recorded levels of alcohol consumption were higher in CEE than in Western Europe (Supplementary Figure 2). In addition, Eastern European countries had higher shares of unreported consumption and riskier drinking patterns.1,44–46 Both the total amounts of alcohol consumed and the binge drinking prevalence levels are especially high among men, and in Russia, Belarus and Ukraine.1
The increase in the relative contribution of alcohol to the East-West life expectancy gap until 2005 might in principle have occurred because the East-West gap in life expectancy itself decreased. However, this gap increased until 2005.47 Therefore, the increasing contribution is likely to be linked to trends in alcohol consumption.
In the 1990s and the early 2000s, alcohol consumption increased in the former Soviet republics.1,48 For example, the recorded levels of pure alcohol consumption per person per year in Russia increased from around 8 litres in 1990 to around 11 litres in 1995 and to 12 litres in 2006,48 and similar increases are observed for unrecorded alcohol consumption in the early 1990s and 2000s.49,50 This rise in alcohol consumption in the early 1990s likely occurred because the anti-alcohol measures implemented by Gorbachev were phased out during a severe health and socioeconomic crisis. In that context, alcohol consumption kept increasing in most former Soviet republics until around mid 2000. In Central Europe, the socioeconomic and health circumstances were much more favourable and alcohol consumption stagnated in Czech Republic and Poland in the 1990s, whereas it kept moderately declining in Western Europe.1
From around 2005 onward, the relative contribution of alcohol to the East-West life expectancy gap declined. This development occurred in the context of overall mortality convergence28 and a decline in alcohol consumption in the CEE region. Between 2007 and 2010, pure alcohol consumption per capita dropped in all of the CEE countries analysed, except in Belarus. Especially in in Russia, Latvia, Estonia and Hungary, these declines were marked, for example at or above 10%.51
These recent declines in alcohol consumption can partly be linked to the implementation starting in the mid 2000s of a range of policies that have proven successful in tackling alcohol abuse: alcohol tax increases in Estonia (2008), Latvia (2006, 2009), Lithuania (2008, 2009)23 and Ukraine (2009);52 the enactment of a federal law regulating the production and sale of ethyl alcohol in Russia (2005);48,53 and the adoption of the third programme of alcoholism prevention in Belarus (2011).48 Alcohol-related policies cannot be the only factor though. That is, in some CEE countries (such as Russia and Belarus), the decline in alcohol consumption had started before these policies were implemented.48 In addition, the economic crisis of 2008 might have affected alcohol consumption. According to studies conducted in Ukraine and the Baltic states, the recession may have contributed to declines to alcohol consumption and attributable mortality, because alcohol became less affordable.50 However, a recent review showed that economic crises can affect alcohol consumption in many different ways.53 More research is needed to completely unravel the causes behind the recent declines in alcohol consumption in CEE countries.
Conclusion
Despite some important data limitations, we showed that alcohol consumption contributed substantially to the East-West life expectancy gap in Europe, especially among those populations characterized by riskier patterns of drinking: namely, men in Russia, Belarus and Ukraine. Furthermore, alcohol contributed to both the diverging (1990–2005) and the converging (2005 onwards) mortality trends in Europe. The implementation of alcohol-related policies in the CEE countries may have contributed to the recent convergence in mortality. The further development of preventive alcohol policies is needed to ensure that life expectancy levels further increase in the CEE countries and become more equal across Europe.
Supplementary Data
Supplementary data are available at IJE online.
Funding
This work was supported by the Netherlands Organisation for Scientific Research (NWO) in connection with the research programme ‘Smoking, alcohol, and obesity, ingredients for improved and robust mortality projections’ [grant number 452–13–001]; see [www.futuremortality.com].
Acknowledgements
The authors are grateful to Vladimir M Shkolnikov (Max Planck Institute for Demographic Research, Rostock, Germany) for his useful comments on an earlier version of this work. We acknowledge Max Griswold (Institute for Health Metrics and Evaluation, Seattle, USA) for discussing and providing detailed insights on the alcohol-attributable mortality estimates from the Global Burden of Disease Study 2013.
Conflict of interest: None declared.

