


Skip to results
Modify your search
NARROW
1-20 of 7933

Journal Article
ACCEPTED MANUSCRIPT
Understanding the therapeutic action of antipsychotics: from molecular to cellular targets with focus on the islands of Calleja
International Journal of Neuropsychopharmacology, pyae018, https://doi.org/10.1093/ijnp/pyae018
Published: 17 April 2024
Journal Article
ACCEPTED MANUSCRIPT
Outpatient antipsychotic use and severe COVID-19: avoiding the impact of age in a real-world data study
International Journal of Neuropsychopharmacology, pyae020, https://doi.org/10.1093/ijnp/pyae020
Published: 11 April 2024
Journal Article
ACCEPTED MANUSCRIPT
Placebo Effects Are Small on Average in the 7.5% CO2 Inhalational Model of Generalised Anxiety
International Journal of Neuropsychopharmacology, pyae019, https://doi.org/10.1093/ijnp/pyae019
Published: 05 April 2024
Journal Article
ACCEPTED MANUSCRIPT
Acute Dissociation and Ketamine’s Antidepressant and Anti-Suicidal Ideation Effects in a Midazolam-controlled Trial
International Journal of Neuropsychopharmacology, pyae017, https://doi.org/10.1093/ijnp/pyae017
Published: 04 April 2024
Journal Article
ACCEPTED MANUSCRIPT
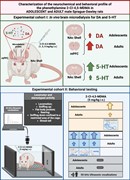
Characterization Of The Neurochemical And Behavioral Effects Of The Phenethylamine 2-Cl-4,5-Mdma In Adolescent And Adult Male Rats
International Journal of Neuropsychopharmacology, pyae016, https://doi.org/10.1093/ijnp/pyae016
Published: 28 March 2024
Image
Graphical abstract
in
International Journal of Neuropsychopharmacology
>
Characterization Of The Neurochemical And Behavioral Effects Of The Phenethylamine 2-Cl-4,5-Mdma In Adolescent And Adult Male Rats
Published: 28 March 2024
Graphical Abstract
Graphical abstract
Journal Article
Corrigendum to: Anhedonia, Apathy, Pleasure, and Effort-Based Decision-Making in Adult and Adolescent Cannabis Users and Controls
International Journal of Neuropsychopharmacology, Volume 27, Issue 3, March 2024, pyae004, https://doi.org/10.1093/ijnp/pyae004
Published: 26 March 2024
Journal Article
Profiling Small RNA From Brain Extracellular Vesicles in Individuals With Depression
International Journal of Neuropsychopharmacology, Volume 27, Issue 3, March 2024, pyae013, https://doi.org/10.1093/ijnp/pyae013
Published: 08 March 2024
Image
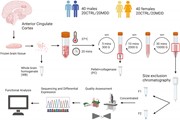
Schematic diagram representing study workflow. CTRL, control; F1, fraction...
in
International Journal of Neuropsychopharmacology
>
Profiling Small RNA From Brain Extracellular Vesicles in Individuals With Depression
Published: 08 March 2024
Figure 1.
Schematic diagram representing study workflow. CTRL, control; F1, fraction 1; F2, fraction 2; MDD, major depressive disorder. Figure was created using BioRender.
Image
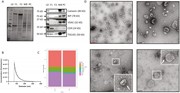
Quality assessment of EV isolation. (A) Left: Representative stain-free ima...
in
International Journal of Neuropsychopharmacology
>
Profiling Small RNA From Brain Extracellular Vesicles in Individuals With Depression
Published: 08 March 2024
Figure 2.
Quality assessment of EV isolation. (A) Left: Representative stain-free image showing total protein loading for western blot. Right: Representative western blot for Calnexin, BiP, VDAC, CD9, and TSG101 in F1, F2, WB, and PC. (B) Average distribution of particle size from 20 subjects (5 M-CTRL, 5 M-M
Image
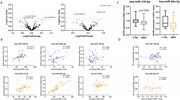
Comparative analysis of EV miRNAs in males and females. (A) Volcano plots s...
in
International Journal of Neuropsychopharmacology
>
Profiling Small RNA From Brain Extracellular Vesicles in Individuals With Depression
Published: 08 March 2024
Figure 3.
Comparative analysis of EV miRNAs in males and females. (A) Volcano plots showing altered miRNA expression for males (blue) and females (orange) at a cut-off of P value ≤ .05. (B) Correlation plots between normalized sequencing counts and qPCR expression of the 3 top miRNAs for males (blue) and fe
Journal Article
Blunted Cortisol Response to Acute Psychosocial Stress in Women With Premenstrual Dysphoric Disorder
International Journal of Neuropsychopharmacology, Volume 27, Issue 3, March 2024, pyae015, https://doi.org/10.1093/ijnp/pyae015
Published: 07 March 2024
Image
The effect of time and diagnosis on serum cortisol. Considering the baselin...
in
International Journal of Neuropsychopharmacology
>
Blunted Cortisol Response to Acute Psychosocial Stress in Women With Premenstrual Dysphoric Disorder
Published: 07 March 2024
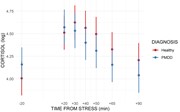
Figure 1.
The effect of time and diagnosis on serum cortisol. Considering the baseline, PMDD participants had lower cortisol levels at +40 ( P ≤ .01), +50 ( P ≤ .01), +65 ( P ≤ .01), and +90 ( P ≤ .01) minutes from the start of TSST relative to the healthy controls. The intervals represent confidence inte
Image
Change over time in Oxford Depression Questionnaire (ODQ) score and subscal...
in
International Journal of Neuropsychopharmacology
>
Emotional Blunting in Depression in the PREDDICT Clinical Trial: Inflammation-Stratified Augmentation of Vortioxetine With Celecoxib
Published: 05 March 2024
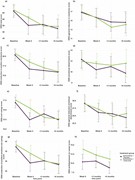
Figure 2.
Change over time in Oxford Depression Questionnaire (ODQ) score and subscales over time by treatment group. Plots of the mean of vortioxetine + placebo and vortioxetine + celecoxib scores at baseline, week 8, 3-month follow-up, and 6-month follow-up time points for a ODQ total score, b ODQ gener
Image
Change over time in Oxford Depression Questionnaire (ODQ) score and subscal...
in
International Journal of Neuropsychopharmacology
>
Emotional Blunting in Depression in the PREDDICT Clinical Trial: Inflammation-Stratified Augmentation of Vortioxetine With Celecoxib
Published: 05 March 2024
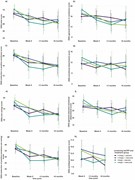
Figure 3.
Change over time in Oxford Depression Questionnaire (ODQ) score and subscales over time by treatment group and high sensitivity C-reactive protein (hsCRP) strata. Plots of the mean respective scores at baseline, week 8, 3-month follow-up, and 6-month follow-up time points of participants treated wit
Journal Article
Emotional Blunting in Depression in the PREDDICT Clinical Trial: Inflammation-Stratified Augmentation of Vortioxetine With Celecoxib
International Journal of Neuropsychopharmacology, Volume 27, Issue 3, March 2024, pyad066, https://doi.org/10.1093/ijnp/pyad066
Published: 05 March 2024
Image
PREDDICT RCT schedule of treatments and assessmentsa. ...
in
International Journal of Neuropsychopharmacology
>
Emotional Blunting in Depression in the PREDDICT Clinical Trial: Inflammation-Stratified Augmentation of Vortioxetine With Celecoxib
Published: 05 March 2024
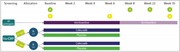
Figure 1.
PREDDICT RCT schedule of treatments and assessments a . a Adapted from Kavakbasi et al. , 2023 . A, administration of the Oxford Depression Questionnaire (ODQ) assessment; B, collection of peripheral venous blood; R, randomization. Participation in the trial and continued treatment with vo
Image
Forest plot of comparison in the risk ratio of conversion to psychosis in t...
in
International Journal of Neuropsychopharmacology
>
Network Meta-Analysis Indicates Superior Effects of Omega-3 Polyunsaturated Fatty Acids in Preventing the Transition to Psychosis in Individuals at Clinical High-Risk
Published: 26 February 2024
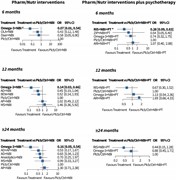
Figure 3.
Forest plot of comparison in the risk ratio of conversion to psychosis in the network meta-analysis for transition outcome at 6, 12, and ≥24 months in 2 levels: pharmacological/nutritional interventions group (on the left) and pharmacological/nutritional interventions plus psychotherapy group (on th
Image
Network plots of direct comparisons in the network meta-analysis for transi...
in
International Journal of Neuropsychopharmacology
>
Network Meta-Analysis Indicates Superior Effects of Omega-3 Polyunsaturated Fatty Acids in Preventing the Transition to Psychosis in Individuals at Clinical High-Risk
Published: 26 February 2024
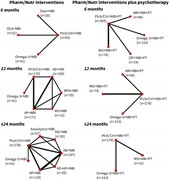
Figure 2.
Network plots of direct comparisons in the network meta-analysis for transition outcome at 6, 12, and ≥24 months in 2 levels: pharmacological/nutritional interventions group (on the left) and pharmacological/nutritional interventions plus psychotherapy group (on the right). The width of the lines is
Journal Article
Network Meta-Analysis Indicates Superior Effects of Omega-3 Polyunsaturated Fatty Acids in Preventing the Transition to Psychosis in Individuals at Clinical High-Risk
International Journal of Neuropsychopharmacology, Volume 27, Issue 3, March 2024, pyae014, https://doi.org/10.1093/ijnp/pyae014
Published: 26 February 2024
