


Community carriage of ESBL-producing Escherichia coli (EPE) is common worldwide and there is a need to understand the connection between carriage and infection. We compared the molecular characteristics of EPE among Swedish community carriers with those of EPE causing invasive infections.
We collected 2134 faecal samples from randomly selected Swedish inhabitants and examined them for the presence of EPE. All participating volunteers answered a questionnaire about putative risk factors for EPE carriage. Suspected EPE isolates (n = 418) from patients with bloodstream infection (BSI) were collected from Swedish laboratories. Isolates were genotypically and phenotypically characterized.
Our results show that the EPE population found in carriers generally had lower pathogenicity compared with the isolates from BSIs, since carriers had a lower proportion of E. coli belonging to phylogroup B2, ST131 and ST131 subclone H30-Rx. Isolates from carriers also had lower levels of multiresistance. The Swedish carriage rate of EPE was 4.7% (101/2134) among healthy volunteers. Risk factors associated with carriage were travel to countries in Asia (OR = 3.6, 95% CI = 1.4–9.2) and Africa (OR = 3.6, 95% CI = 1.7–7.7) and a diet without pork (OR = 0.5, 95% CI = 0.3–0.8 for pork eaters).
E. coli host factors previously associated with higher pathogenicity were all more common in BSIs compared with carriers. This indicates that the risk of invasive infection with EPE may be relatively modest in many community carriers and that EPE carriage of high-risk strains should be the focus of attention for prevention.
Introduction
Asymptomatic faecal carriage of resistant bacteria, such as ESBL-producing Enterobacteriaceae, poses a major health challenge worldwide.1,2 Faecal carriage of ESBL-producing Escherichia coli (EPE) usually precedes clinical infections, such as urinary tract infections, that in turn are associated with increased risk of acquiring more severe infections, such as bloodstream infections (BSIs).3 Hence, faecal carriage of EPE might increase the risk of clinical infections resulting in difficult to treat non-severe infections and/or the need for broadened empirical treatment of severe infections, such as BSIs. However, it is not currently known to what extent community carriage of EPE contributes to invasive infections. In Sweden, the fraction of EPE in BSIs has increased from 2.3% in 2007 to 5.4% in 2014, which is a significant increase (P < 0.001) and a worrying development.4
The prevalence of asymptomatic community carriers in Sweden has been estimated to be up to 5%, whereas in other countries the prevalence might be as high as 60%.5–8 Studies on faecal carriage of EPE have been conducted and described worldwide.1 However, several of these studies might be biased as they were performed on patients seeking various types of healthcare. In addition these studies often involved few participants with a narrow age range in a single geographical location.
Specific phylogenetic lineages in E. coli, such as phylogroup B2, ST131 and the ST131 subclone H30-Rx, have been linked to global spread and increased potential to cause severe infections because of higher virulence.9–20 The subclone H30-Rx was also shown to be more common in patients with sepsis compared with other sub-lineages of ST131.11
We aimed to determine the prevalence of EPE carriage in the Swedish community and to identify risk factors associated with community carriage by doing a population-based cross-sectional study. We also compared genetic characteristics between isolates from community carriers and isolates from patients with BSI, to determine the risk of invasiveness associated with carriage of specific EPE strains. Collections of isolates from both carriage and BSI were performed on a nationwide basis, but were focused on the densely populated areas of Sweden.
Methods
Ethics
This study was conducted in accordance with the Declaration of Helsinki and national and institutional standards and was approved by the research ethics committee in Stockholm, Sweden (Recordal: 2012/1204-31/4). Written consent was obtained from all volunteers who contributed a faecal sample and questionnaire answers.
Study population and community sampling
To obtain a representative insight into the molecular epidemiology of EPE in community carriers we wanted to collect >100 EPE isolates. As a 5% prevalence was assumed (based on previous smaller studies), the resulting number of individuals needed to be screened was >2000.5,6,21 A pilot study, where 2000 individuals were approached, gave a 20% response rate which meant that ∼10 000 individuals needed to be approached to reach the target number of around 100 isolates. Questionnaires, along with instructions and material for collection of faecal samples, was sent out to a total of 11 350 individuals (age 18–72), between November 2012 and December 2013. The addresses of individuals were randomly extracted from the Swedish Person Address Register (SPAR) (based on social security numbers held by all Swedish citizens). The following counties were included: Stockholm, Gothenburg, Malmö, Helsingborg, Linköping, Uppsala, Västerås, Gävle and Örebro; the number of asked participants was proportionate to the population density in each county. Together the nine counties represent 47% (∼4.5 million of a total 9.6 million inhabitants) of the Swedish population.
The questionnaire (available as Supplementary data at JAC Online) could be answered online or in paper format. It contained questions about travel abroad, healthcare contacts and antibiotic use within the past 6 months, as well as eating habits and contact with animals. Faecal samples were taken at home by each participant using Eswab (Copan Diagnostics Inc., Mantua, Italy).
Collection of BSI isolates
In Sweden it is mandatory according to the Communicable Disease Act to report findings of ESBL and plasmid-mediated AmpC (pAmpC) in patients. In 2011–12, there were 715 invasive cases of E. coli reported with confirmed ESBL and/or pAmpC phenotype in the Swedish national internet-based notification system for communicable diseases SmiNet2.22 The clinical isolates of E. coli from blood cultures (n = 418) from 2011 to 2012, with non-susceptibility [resistant (R) and intermediate (I)] to cefotaxime and/or ceftazidime, were collected from Swedish clinical microbiology laboratories in Stockholm, Halmstad, Linköping, Växjö, Örebro, Skövde, Kalmar, Visby, Kristianstad, Västerås, Eskilstuna, Malmö, Borås, Gävle, Umeå, Jönköping, Lund and Sundsvall. Only isolates where the ESBL gene could be identified by sequencing were included in the analysis (n = 385).
Phenotypic verification and susceptibility testing
Faecal samples from community carriers were cultivated on a CHROMoriental-agar plate supplemented with 3 mg/L cefpodoxime (Karolinska University Laboratory, Stockholm, Sweden). Species identification of presumptive E. coli and K. pneumoniae colonies were determined by MALDI-TOF (Biotyper, Bruker Corporation, the Netherlands). All E. coli/K. pneumoniae presenting unique morphologies on the plate from the same sample were analysed for ESBL production. The BSI samples were sent from the clinical laboratories to the Public Health Agency and cultured on blood agar. Antimicrobial susceptibility profiles were determined using disc diffusion and gradient tests with EUCAST clinical breakpoints (http://www.eucast.org/clinical_breakpoints/). Phenotypic screening for EPE was performed with combination disc testing with clavulanic acid for ESBL (Becton-Dickinson, Cockeysville, MD, USA) and cloxacillin as inhibitor for pAmpC (Rosco Diagnostica A/S, Taastrup, Denmark).
Molecular characterization
ESBL/pAmpC genes were identified using the Check-MDR microarray system (CT-101 or -103) (Checkpoint BV, Wageningen, the Netherlands). ESBL/pAmpC genes were sequenced using Sanger sequencing.23 Phylogroups were identified using a triplex PCR with published primers.24 All isolates from BSI were subjected to O25b-ST131 pabB PCR.25 BSI isolates negative in the pabB PCR, along with all isolates from community carriers, were typed by MLST according to protocols at the University of Warwick web site (http://mlst.warwick.ac.uk/mlst/dbs/Ecoli). Alleles and STs (Sanger sequencing) were identified using BioNumerics 7.0 MLST Plug-in (Applied Maths, Gent, Belgium). All ST131 isolates were subjected to fimH30-specific PCR Sanger sequencing for identification of subclone H30-Rx using a method published by Price et al.11 in 2013.26 If an ST131 isolate were positive for both H30-Rx-related SNPs, it was considered part of the H30-Rx clonal lineage.
Transfer of plasmid-carrying genes encoding ESBL was performed by electroporation to ElectroMax™DH10B™ cells and transformation of plasmids was confirmed by detection of the genes as previously described.27 All transformants positive for an ESBL gene were tested for plasmid replicon types using the Diatheva PBRT-kit (Fano, Italy). All isolates from carriers were investigated for presence of the virulence genes fimA, fimH, papAH, papEA, papC, papGI and papGII with qPCR using a previously described method.28
Statistical analysis
The dataset used for statistical analysis is available as Supplementary data at JAC Online.
Analysis of risk factors associated with community carriage
A logistic regression model was used to analyse risk factors for carriage of ESBL and pAmpC-positive isolates. The parameters were estimated with Firth's method for penalized maximum likelihood estimates due to the sparse number of carriers.29 The variables showing P values <0.20 in the univariate analysis, as well as all travel regions, were subjected to multivariable analysis. Missing values (5%–20%) in the dataset was replaced using 10 imputed datasets that were weighted together to a single result using Rubin's method.30,31
Analysis of BSI versus carrier isolates
The prevalence of phylogroups, STs, ESBL genes and antibiotic resistance among carrier and BSI isolates was compared using logistic regression models. The age of subjects with carrier isolates was lower compared with patients with BSI isolates and there was an age restriction on subjects with carrier isolates (≤72 years of age). Analyses were performed including all patients and on a modified dataset restricted to ≤72 years. The association between age and source of isolate was non-linear. Hence, in adjusted analyses age was categorized as <45 years, 45–64 years and ≥65 years. An interaction test was performed to assess if the association between bacterial characteristics and pathogenicity was modified by age. Calculations of P value for plasmid transfer rates and genetic traits connected to high levels of combined resistance were made using Fisher's exact test in R statistical software (version 3.1.0). The increase in ESBL in isolates causing BSIs in Sweden (see the Introduction) was calculated using the Cochran–Armitage test with Stata 13.1 (StataCorp., TX, USA).
Results
A total of 2134 faecal samples, along with completed questionnaires from community carriers, were collected. This corresponded to a response frequency of 18.8% (11 350 persons contacted). Of the 2134 faecal samples, 93 were positive for EPE and 8 for pAmpC, giving a carriage rate of 4.7%. In two of the individuals two different types of EPE were identified. Hence, in total 103 isolates from 101 carriers were collected. The mean age for all community carrier participants was 51 years, which is higher than the national mean of 44 years (Statistics Sweden 2011–13 for inhabitants aged 18–72 years). No significant differences in carriage rates were observed with regards to age or sex.
Three risk factors for EPE carriage could be identified from the multivariate analysis: (i) travel to Asia; (ii) travel to Africa; and (iii) a diet without pork (Table 1). No difference in types of ESBL/pAmpC genes acquired could be linked to travel destination (data not shown). Healthcare contact and antimicrobial exposure were not associated with increased risk of EPE carriage.
Investigation of risk factors associated with community carriage of ESBL and plasmid-mediated AmpC-producing E. coli
| Variable | Carrier (n = 101), row % (no.)a | Non-carrier (n = 2033), row % (no.)a | P | Unadjusted OR (95% CI)b | Adjusted OR (95% CI)b | ||
|---|---|---|---|---|---|---|---|
| Age (median, years) | 53 | 52 | — | — | |||
| Sex | male | 5.1 (46) | 94.9 (849) | — | 1 | ||
| female | 4.5 (55) | 95.5 (1172) | 0.5 | 0.9 (0.6–1.3) | |||
| Food intake | leafy greens | never | 5.7 (1) | 94.3 (17) | — | 1 | |
| >1 time/month | 4.6 (96) | 95.4 (1987) | 0.5 | 0.6 (0.1–3.2) | |||
| beef | never | 3.5 (5) | 96.5 (137) | — | 1 | ||
| >1 time/month | 4.8 (95) | 95.2 (1867) | 0.6 | 1.3 (0.5–3) | |||
| pork | never | 8.3 (19) | 91.7 (209) | — | 1 | 1 | |
| >1 time/month | 4.1 (76) | 95.9 (1776) | 0.004 | 0.5 (0.3–0.8) | 0.5 (0.3–0.8) | ||
| chicken | never | 4.7 (6) | 95.3 (121) | — | 1 | ||
| >1 time/month | 4.7 (93) | 95.3 (1882) | 0.9 | 0.9 (0.4–2.1) | |||
| other meat | never | 4.6 (21) | 95.4 (433) | — | 1 | ||
| >1 time/month | 4.7 (69) | 95.3 (1398) | 1 | 1 (0.6–1.7) | |||
| fish | never | 5.1 (3) | 94.9 (56) | — | 1 | ||
| >1 time/month | 4.7 (96) | 95.3 (1958) | 0.7 | 0.8 (0.3–2.4) | |||
| Travel (last 6 months) | Nordic countries (including Sweden) | 3.7 (35) | 96.3 (919) | — | 1 | 1 | |
| Rest of Europe | 4.2 (28) | 95.8 (644) | 0.6 | 1.2 (0.7–1.9) | 1.1 (0.7–1.8) | ||
| Africa | 13 (6) | 87 (40) | 0.002 | 4.2 (1.7–10.2) | 3.6 (1.4–9.2) | ||
| Asia | 13.2 (10) | 86. 8 (66) | <0.001 | 4.1 (2–8.5) | 3.6 (1.7–7.7) | ||
| North America | 6.1 (2) | 93.9 (31) | 0.3 | 2.1 (0.5–7.9) | 2.3 (0.6–8.8) | ||
| South America | 0 (0) | 100 (13) | 1 | 1 (0.05–18.3) | 0.7 (0.03–12.8) | ||
| several countriesc | 6.2 (20) | 93.8 (304) | 0.05 | 1.7 (1–3.1) | 1.6 (0.9–2.8) | ||
| Healthcare (last 6 months) | none | 4.6 (40) | 95.4 (837) | — | 1 | 1 | |
| in Sweden | 5.2 (48) | 94.8 (868) | 0.5 | 1.2 (0.8–1.8) | 1.1 (0.7–1.6) | ||
| abroad | 13.3 (6) | 86.7 (39) | 0.007 | 3.4 (1.4–8.3) | 1.9 (0.7–4.8) | ||
| Type of healthcare | none | 4.5 (40) | 95.5 (837) | — | 1 | ||
| hospitald | 2.8 (3) | 97.2 (106) | 0.5 | 0.7 (0.2–2.1) | |||
| othere | 5.4 (54) | 94.6 (954) | 0.4 | 1.2 (0.8–1.8) | |||
| Daily animal contactf | no | 5.4 (83) | 94.6 (1463) | — | 1 | 1 | |
| yes | 3.1 (18) | 96.9 (559) | 0.04 | 0.6 (0.4–1.0) | 0.6 (0.4–1.1) | ||
| Antibiotic treatment (last 6 months) | no | 4.7 (83) | 95.3 (1675) | — | 1 | ||
| yes | 4.6 (15) | 95.4 (308) | 0.98 | 1 (0.6–1.8) | |||
aUnless otherwise specified.
bOR with 95% CI.
c‘Several countries’ refers to persons who had travelled to more than one country in the last 6 months.
dDefined as emergency room and/or hospitalized for at least one night.
eDefined as primary care, maternity care, specialized care, dentist or other.
fDaily contact defined as contact with pets/domestic animals on a daily basis.
Virulence profiling showed that <20% of the isolates from carriers had pap genes (Table S1).
A total of 385 EPE isolates from BSIs were included in the analyses to assess pathogenicity potential in connection to genetics. One of the isolates from BSIs produced carbapenemases as well as ESBL (NDM-1 and CTX-M-3). The mean age of BSI patients was 70 years compared with 51 years for individuals with EPE carriage. In BSI patients (n = 204) restricted to ≤72 years the mean age was 58 years.
We compared the distribution of ESBL genotypes of BSI and carrier isolates (Table 2). BSI isolates had a higher prevalence of blaCTX-M-15, while carrier isolates had a higher prevalence of blaCTX-M-14 and blaCTX-M-1. The same differences remained for age-stratified BSI isolates.
Distribution and comparison of ESBL genes in E. coli isolates from BSIs and carriers
| ESBL genea | BSIs (n = 359), column % (no.) | Carriers (n = 95), column % (no.) | Pb | Unadjusted OR (95% CI) | Adjusted OR (95% CI)c | Adjusted OR (95% CI)c, stratified to patients aged 18–72 yearsd |
|---|---|---|---|---|---|---|
| blaCTX-M-15 | 66.9 (240) | 45.3 (43) | <0.001 | 2.4 (1.5–3.9) | 2.4 (1.4–4.0) | 2.0 (1.2–3.4) |
| blaCTX-M-14 | 9.2 (33) | 20.0 (19) | 0.004 | 0.4 (0.2–0.8) | 0.4 (0.2–0.7) | 0.5 (0.2–1.0) |
| blaCTX-M-27 | 8.9 (32) | 8.4 (8) | 0.9 | 1.1 (0.5–2.4) | 1.4 (0.6–3.5) | 1.6 (0.6–3.8) |
| blaCTX-M-1 | 3.6 (13) | 11.6 (11) | 0.003 | 0.3 (0.1–0.7) | 0.2 (0.1–0.6) | 0.3 (0.1–0.8) |
aThe four most prevalent genotypes presented.
bP value for carrier versus BSI isolates.
cAdjusted for age.
dRestricted to study subjects aged 18–72 years, carrier isolates (n = 95) and BSI isolates (n = 204).
Plasmid replicon types, for the plasmid containing the ESBL gene from positive transformants, could be determined in 224 BSI and 64 carrier isolates. The most common replicon types identified were IncF (63% versus 45%), IncI1 (13% versus 23%) and IncK (1% versus 5%) for BSI and carrier isolates, respectively. No significant differences between the two groups in occurrence of plasmid replicon types could be detected.
The plasmid containing the ESBL gene could not be transferred by electroporation for 140 (39%) BSI and 37 (39%) carrier isolates. For isolates carrying blaCTX-M-15, 58% (n = 164) of the plasmids could be transferred compared with 73% (n = 124) for other genes (P = 0.002) and for isolates with the gene blaCTX-M-27, plasmids could be transferred for 100% (n = 40) compared with 60% (n = 243) for other genes (P < 0.001).
Distribution of phylogroups and MLST in EPE isolates from BSIs and carriers
| Variable | BSIs (n = 359), column % (no.) | Carriers (n = 95), column % (no.) | Pa | Unadjusted OR (95% CI) | Adjusted OR (95% CI)b | Adjusted OR (95% CI)b, stratified to patients aged 18–72 yearsc |
|---|---|---|---|---|---|---|
| Phylogroup A | 12.5 (45) | 22.1 (21) | 0.02 | 0.5 (0.3–0.9) | 0.5 (0.2–0.9) | 0.5 (0.2–0.9) |
| ST10 | 2.5 (9) | 7.4 (7) | 0.03 | 0.3 (0.1–0.9) | 0.5 (0.1–1.5) | 0.5 (0.2–1.7) |
| Phylogroup B1 | 1.0 (3) | 13.7 (13) | <0.001 | 0.05 (0.01–0.2) | 0.03 (0.007–0.1) | 0.03 (0.003–0.2) |
| Phylogroup B2d | 52.7 (189) | 25.3 (24) | <0.001 | 3.3 (2.0–5.5) | 3.7 (2.1–6.4) | 3.6 (2.0–6.4) |
| ST131 | 44.6 (160) | 16.8 (16) | <0.001 | 4.0 (2.2–7.1) | 3.6 (1.9–6.7) | 3.4 (1.8–6.4) |
| H30-Rx | 28.1 (101) | 6.3 (6) | <0.001 | 5.8 (2.5–13.7) | 5.0 (2.0–12.2) | 4.4 (1.8–11.0) |
| Phylogroup Dd | 32.2 (119) | 39.0 (37) | 0.3 | 0.8 (0.5–1.2) | 0.8 (0.5–1.4) | 0.8 (0.5–1.4) |
| ST38 | 7.3 (26) | 10.5 (10) | 0.3 | 0.7 (0.3–1.4) | 0.6 (0.2–1.5) | 0.7 (0.3–1.7) |
| ST405 | 5.3 (19) | 4.2 (4) | 0.4 | 1.3 (0.4–3.8) | 1.2 (0.3–4.0) | 1.1 (0.3–3.9) |
| ST648 | 7.5 (27) | 2.1 (2) | 0.1 | 3.7 (0.9–16.2) | 4.2 (0.9–19.0) | 3.7 (0.8–17.4) |
| ST69 | 2.2 (8) | 3.2 (3) | 0.6 | 0.7 (0.2–2.7) | 0.8 (0.2–3.6) | 0.9 (0.2–3.9) |
| MLST singletonse | 9.7 (35) | 35.7 (34) | <0.001 | — | — | — |
aP value for carrier versus BSI isolates.
bAdjusted for age.
cRestricted to study subjects aged 18–72 years, carrier isolates (n = 95) and BSI isolates (n = 190).
dVariations in ST/phylogroup B2 and D relationship were the following: ST131, two isolates belonged to phylogroup D and one to group A; ST38, ST405, ST69 and ST648, one isolate from each ST belonged to phylogroup A; and ST648, one isolate belonged to B1.
eMLST found in only one isolate (different phylogroups).
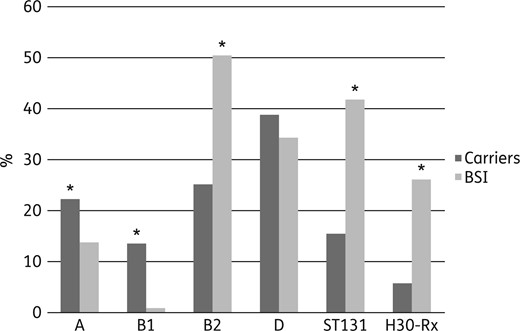
Distribution of phylogroups, ST131 and H30-Rx among ESBL- and pAmpC-producing E. coli isolates from BSI and carriers. Significant differences are marked with an asterisk. See Table 3 for statistical data.
Among EPE isolates with ST131, H30-Rx was detected in 6/16 (37.5%) of carriers compared with 101/161 (62.7%) with BSIs (P = 0.06, OR = 2.81, 95% CI = 0.97–8.11). The H30-Rx subclone was strongly associated with fimH30 (97%) and blaCTX-M-15. Only 3 out of 110 H30-Rx isolates had another ESBL gene, 2 blaCTX-M-3 and 1 blaCTX-M-32. A higher genetic diversity of E. coli strains was observed in carrier isolates, which was demonstrated by a higher proportion of STs identified in only one isolate (singletons) (Table 3).
Isolates from BSIs exhibited resistance to more antimicrobials compared with carrier isolates (R + I) (Table 4). Combined antimicrobial resistance was also more frequent in BSI isolates compared with carriers. A total of 202 EPE isolates were resistant to fluoroquinolones, aminoglycosides and penicillin + lactamase inhibitor. These isolates also had a higher occurrence of blaCTX-M-15, H30-Rx, ST131 (P < 0.001 for all) and B2 (P = 0.03), but a lower occurrence of blaCTX-M-27 and blaCTX-M-1 (P < 0.001 for both).
Single and combined phenotypic resistance (R + I) in EPE isolates from BSIs and carriers
| Antimicrobial class | Antimicrobial(s) | BSIs (n = 359), column % (no.)a | Carriers (n = 95), column % (no.) | Pb | Unadjusted OR (95% CI) |
|---|---|---|---|---|---|
| Single resistance | |||||
| extended-spectrum cephalosporin | cefotaxime, ceftazidime | 100 (359) | 97.9 (93) | 0.04 | NA |
| penicillins + inhibitor | amoxicillin/clavulanic acid | 86.0 (308) | 69.5 (66) | <0.001 | 2.7 (1.6–4.6) |
| antipseudomonal penicillin + inhibitor | piperacillin/tazobactam | 45.1 (162) | 17.9 (17) | <0.001 | 3.8 (2.2–6.6) |
| fluoroquinolones | ciprofloxacin | 76.9 (276) | 37.9 (36) | <0.001 | 5.4 (3.4–8.8) |
| aminoglycosides | tobramycin, gentamicin | 59.1 (212) | 30.5 (29) | <0.001 | 3.3 (2.0–5.3) |
| amikacin | 2.0 (7) | 0 | 0.35 | NA | |
| carbapenems | ertapenem | 5.9 (21) | 0 | 0.01 | NA |
| meropenem | 0.6 (2) | 0 | 1.0 | NA | |
| imipenem | 0.6 (2) | 1.0 (1) | 0.5 | 0.5 (0.05–5.9) | |
| phosphoic acid | fosfomycin | 2.2 (8) | 2.1 (2) | 0.9 | 1.1 (0.2–5.1) |
| penicillins | ampicillin | 100 (359) | 100 (95) | 1.0 | NA |
| mecillinam | 4.2 (15) | 2.1 (2) | 0.5 | 2.0 (0.5–9.0) | |
| glycylcyclins | tigecycline | 0.8 (3) | 0 | 1.0 | NA |
| polymyxins | colistin | 0.3 (1) | 1.0 (1) | 0.4 | 0.3 (0.02–4.2) |
| nitrofurans | nitrofurantoin | 2.5 (9) | 0 | 0.2 | NA |
| Combined resistance | |||||
| fluoroquinolones, aminoglycosides | 53.2 (191) | 20.0 (19) | <0.001 | 4.5 (2.6–7.8) | |
| fluoroquinolones, penicillin + inhibitor | 66.0 (237) | 28.4 (27) | <0.001 | 4.9 (3.0–8.0) | |
| aminoglycosides, penicllin + inhibitor | 57.4 (206) | 24.2 (23) | <0.001 | 4.2 (2.5–7.0) | |
| fluoroquinolones, aminoglycosides, penicillin + inhibitorc | 51.8 (186) | 17.9 (17) | <0.001 | 4.9 (2.8–8.7) | |
NA, not applicable.
aAntibiotic resistance data were missing for one isolate.
bP value for carrier versus BSI isolates.
cHigh levels of combined resistance.
Discussion
Herein, we show that the EPE population found in carriers had traits associated with lower pathogenicity compared with the isolates from BSIs. The results indicate that EPE belonging to phylogroups B2 and ST131 and H30-Rx have high pathogenicity, since they are more common in BSIs, while phylogroups B1 and A have low pathogenicity. We therefore suggest that EPE isolates positive for B2, ST131 and/or H30-Rx should be considered high-risk strains when detected in carriers, which is in concordance with previous studies.9–16
The strength of our study is that we could compare isolates from BSIs and carriers from the general population in the same geographical area during the same time period. The subclone H30-Rx was strongly connected to the ESBL gene blaCTX-M-15 and to the high occurrence of resistance to clinically important antibiotics. These traits were all more common in BSIs, demonstrating that the EPE population causing BSIs was strongly selected towards the most resistant and invasive isolates. High occurrence of combined resistance showed a strong relationship with H30-Rx. Our results also support previous studies that have shown that H30-Rx is of particular concern compared with other ST131 subclones in BSIs.11,16 One option for clinical laboratories could be to introduce rapid detection of specific ST131 biomarker proteins via MALDI-TOF, as has been described in several studies.32,33
Isolates from carriers had a low prevalence of virulence genes known to be associated with invasive infections, which indicates an overall lower pathogenicity.34 This is not unexpected given the lower prevalence of phylogroup B2 isolates in this cohort.
Even though clear differences were detected between the EPE population in carriers and BSIs, the same types of ESBL genes and plasmid replicon types were identified in both populations. This indicates that a close exchange and spread of genes and plasmids does not dictate which isolates become invasive; this is rather determined by the E. coli host factors and specific virulent clonal lineages (such as H30-Rx). It should be pointed out that ESBL resistance is highly dynamic since resistance can disseminate quickly horizontally. However, the presence of ESBL in clones such as ST131 and H30-Rx indeed seems to be very stable. Many of the plasmids with blaCTX-M-15 could not be transferred, which was also commonly seen for plasmids in the H30-Rx clone (data not shown). This could be due to chromosomal location of genes such as blaCTX-M-15, as has been described previously.11
Our study demonstrates that close to 5% of the Swedish population carry EPE in their faecal microbiota. To our knowledge, this is the largest population-based random screening study on faecal carriage of EPE ever conducted. The carriage rate is slightly higher than in previous point prevalence studies, performed in Sweden on different groups representing the community.5,6 Studies in the Netherlands and Germany showed a similar prevalence of 4.9% and 6.3%, respectively, in selected populations.35,36 None of the isolates identified from community carriers produced carbapenemases, indicating that carbapenemase-producing E. coli are still uncommon in the Swedish general population.
Risk factors for becoming a carrier of EPE were identified as travel to countries in Asia and Africa during the last 6 months, which is also supported by previous studies in Sweden and Finland on travellers.6,21,37 Unexpectedly, having a diet that includes pork appeared to have a protective effect against becoming an EPE carrier, which was independent of travel during the last 6 months. There is to our knowledge no reasonable biological explanation why pork should protect against becoming an EPE carrier. Explanations could be unmeasured confounding or random effects. We did not detect an association between EPE colonization and contact with healthcare or exposure to antibiotics during the last 6 months prior to participating in the study. A limitation of the study was that only 19% of the invited individuals to assess EPE carriage participated with a faecal sample. This resulted in an age-bias with younger patients more likely to decline participation. Yet, EPE carriage was not associated with age and hence it should have only minor effects on our results. Also, since we did not have access to data on socio-economic status or co-morbidity we could only adjust for age in the comparative analyses of BSI and carriage isolates.
Finally, based on our data the risk of BSI in patients with carriage of isolates with high pathogenicity is low. With the assumption of the same carriage rate of, for example, ST131 in 7.6 million Swedes (national data from 2012) ≥18 years of age and in patients with BSI caused by EPE, the BSI:carrier ratio is 1:200. This also means that the individual risk for a healthy carrier to acquire an EPE BSI, even if they carry an isolate with higher pathogenicity, is likely to be low. However, the overall risk with community carriage as a reservoir for EPE is likely to increase if more people in society are colonized with high-risk isolates. This could be an important argument for characterizing EPE isolates in carriage beyond today's common practice and to consider risk stratification of carriers, as well as targeted interventions towards carriage of high-risk EPE strains.
Funding
This work was supported by the Swedish Civil Contingency Agency.
Transparency declarations
None to declare.
Supplementary data
Acknowledgements
Part of this study was presented at the Twenty-Fifth European Congress of Clinical Microbiology and Infectious Diseases, Copenhagen, Denmark, 2015 (Presentation O012).
We thank all participating Swedish laboratories for submitting clinical isolates and healthy volunteers for submitting faecal samples and questionnaires.
