


Abstract
In the absence of a safe, effective vaccine, the worldwide spread of COVID-19 (SARS-CoV-2) infection will continue. Laboratory tests with ideal precision, sensitivity, and specificity should be used in public health and clinical settings to gauge the extent of virus exposure. Toward this end, we evaluated the analytical and clinical performance of the Abbott SARS-CoV-2 IgG and the Roche Anti-SARS-CoV-2 immunoassays.
Quality control, pooled COVID-19, and non-COVID-19 patient specimens were used for the imprecision study. Two hundred and forty-six specimens from 70 patients with COVID-19 diagnosis were tested to study the sensitivity. Seventy-three non-COVID-19 control specimens were measured to study the specificity. All specimens were analyzed by both assays.
Total analytic variability (CV) of the negative and positive controls were 5.5% and 3.6% for the Abbott assay and 4.5% and 1.9% for the Roche assay. Both assays demonstrated 100% qualitative reproducibility of negative and positive controls. The clinical specificities of the Abbott and the Roche assays were 100% (95% CI: 94%—100%) and 97% (95% CI: 90%—100%), respectively. The clinical sensitivities of the Abbott assay were 49% (95% CI: 41%—56%), 86% (95% CI: 74%—93%), and 100% (95% CI: 76%—100%) for samples collected at 0–6 days, 7–13 days, and ≥14 days after the first RT-PCR, while the sensitivities of the Roche assay were 55% (95% CI: 47%—62%), 86% (95% CI: 74%—93%), and 100% (95% CI: 76%—100%).
This study demonstrates similar analytical and clinical performance of the Abbott and the Roche SARS-CoV-2 antibody assays, but the Roche assay may be slightly more sensitive for patients tested within 0–6 days after first positive RT-PCR of SARS-CoV-2.
COVID-19 is a respiratory infectious disease caused by SARS-CoV-2. Laboratory tests with ideal precision, sensitivity, and specificity should be used in public health and clinical settings. We analyzed analytical and clinical performance of the Roche and Abbott SARS-CoV-2 antibody assays in pre-pandemic and pandemic patient populations. Additionally, we analyzed the sensitivity of both assays in patients at different stages of the disease. The 2 assays showed similar analytical and clinical performance, but the Roche assay may be slightly more sensitive for patients tested within 0–6 days after first positive RT-PCR of SARS-CoV-2. Our findings help other clinical labs select appropriate assays for SARS-CoV-2 antibody testing.
Introduction
Coronavirus disease 2019 (COVID-19) is a respiratory infectious disease caused by the novel severe acute respiratory syndrome coronavirus 2 (SARS-CoV-2), a single-stranded and enveloped RNA virus of the family Coronaviridae (1). COVID-19 can cause severe respiratory illness with high mortality in patients with comorbidities such as diabetes, hypertension, and cardiovascular disease (2). Laboratory testing plays an important role in identifying infected patients and providing pandemic information for the government to make proper strategies to alleviate or stop the spread of this virus. Nucleic acid-based diagnostic molecular testing, primarily reverse transcription polymerase chain reaction (RT-PCR) for detecting SARS-CoV-2 RNA, usually requires nasopharyngeal, oropharyngeal, or nasal swab samples, and false-negative results can occur if specimens are collected inappropriately (3). Combining RNA and antibody testing significantly improves the sensitivity of pathogenic diagnosis for COVID-19 in the early phase of infection (4). A study shows the RT-PCR positivity in patients with mild symptoms starts to decline by week 3 after the disease onset and subsequently becomes undetectable (5). Serological diagnosis is potentially important for patients with mild to moderate illness who may present late, beyond the first 2 weeks of illness onset. Serological diagnosis is also becoming a crucial tool for understanding the extent of COVID-19 in the community and to identify individuals who are already exposed and potentially “protected” from a second infection (6).
Although nucleic acid-based diagnostic methods are well known for their high sensitivity and specificity, they also have the disadvantage of dependence on either specialized instruments or specially trained laboratory professionals to run the test, therefore not readily available to some hospital laboratories. This may cause longer turnaround time and adversely impact the management of certain patients (7). Serology tests for detecting the virus antibodies could be implemented on automated immunoassay analyzers that are available to most hospital laboratories in the United States. Several diagnostic manufacturers have released automated serology assays for SARS-CoV-2 antibody testing. Studies have already shown that immunocompetent patients infected with SARS-CoV-2 may develop IgA, IgM, and/or IgG antibodies against SARS-CoV-2 (8–10).
Most SARS-CoV-2 immunoassays have a similar principle employing the spike protein, nucleocapsid protein, or receptor binding domain as the bait to detect the corresponding IgG or total antibodies. However, their clinical performance may vary, as shown by a study on 4 commercial SARS-CoV-2 IgG immunoassays (11). Both the Abbott SARS-CoV-2 IgG (Abbott Laboratories Diagnostics Division, Abbott Park, IL, USA) and the Roche Anti-SARS-CoV-2 assay (Roche Diagnostics, Indianapolis, IN, USA) are sandwich immunoassays utilizing the nucleocapsid protein antigens as the capturing molecule, although it is unknown whether the same epitopes are used. The Abbott assay employs anti-human IgG acridinium-labeled conjugate as the detecting molecule to detect the IgG antibodies against the nucleocapsid protein, whereas the Roche assay utilizes the ruthenium-labeled nucleocapsid protein antigen as the detecting molecule to detect the total antibodies, presumably including IgA, IgM, and IgG. In this study, we compared the analytical and clinical performance of the Abbott SARS-CoV-2 IgG and the Roche Anti-SARS-CoV-2 assay.
Methods and Materials
This investigation was approved by the Institutional Review Board of Pennsylvania State University Hershey Medical Center (study number STUDY00015728). We analyzed imprecision, sensitivity, and specificity in different specimen types of various patient populations including pre-pandemic and pandemic patients.
Patients and Specimens
The specimens for the imprecision studies were the positive and negative quality control samples provided by the manufacturer of the Abbott assay or the pooled specimens from COVID-19 and non-COVID-19 patients collected in our laboratory for the Roche assay. Specimens for the sensitivity studies were derived from residual lithium heparin (hereinafter heparin) plasma or potassium EDTA (hereinafter EDTA) plasma of 70 patients who were tested positive for SARS-CoV-2 by RT-PCR with respiratory specimens after routine laboratory testing. From the total of 350 specimens, 104 pairs of heparin and EDTA samples were from the same draw, which were used to evaluate the concordance between the heparin and the EDTA samples. After removing the duplicate of these 104 paired samples, there were 246 samples representing unique collections at different time points from these patients after the diagnosis of COVID-19. Seventy-three specimens for the specificity studies include 38 de-identified pre-pandemic (November 2018–September 2019) heparin plasma specimens stored in our lab, 30 pairs of remnant heparin and EDTA plasma from randomly selected patients without COVID-19 diagnosis after routine lab tests, and 5 pairs of heparin and EDTA plasma specimens from patients without COVID-19 diagnosis but with positive results of other respiratory pathogen infections, including respiratory syncytial virus, rhinovirus, and influenza A.
Instruments and Methods
Samples were analyzed on the Abbott Architect i1000SR instrument with the Abbott SARS-CoV-2 IgG assay and the Roche Cobas e602 modules with the Elecsys Anti-SARS-CoV-2 assay following the manufacturer’s instructions. The Abbott assay calculates the mean calibrator signal and the results are reported by dividing the sample result by the calibrator signal. The default result unit for the assay is S/C index. A result is interpreted as reactive when S/C index is ≥ 1.4. Similarly, the Roche assay calculates the cutoff index (COI; signal sample/cutoff) based on the measurement of negative and positive calibrators. A result is interpreted as reactive when COI is ≥ 1.0.
Statistical Analysis: A confidence interval was of 95% calculated with online tools (http://vassarstats.net/) following the efficient-score method (12). The Mann-Whitney U test was performed using Microsoft Excel (Microsoft Corporation, Redmond, WA, USA). Concordance comparisons were analyzed by McNemar chi-square test for symmetry using EP Evaluator 11 (Data Innovations, Burlington, VT, USA). It is statistically significant if P < 0.05.
Results
Imprecision
For the Abbott assay, both negative QC (mean S/C index: 0.06) and positive QC samples (mean S/C index: 3.15) were analyzed 38 times on 2 Architect i1000 analyzers on 7 different days. The total CVs were 5.5% and 3.6% for negative and positive QC. The reproducibility of the results of both QC samples was 100% (95% CI: 89%100%). For the Roche assay, the pooled COVID-19 negative (mean COI: 0.076) and positive samples (mean COI: 8.59) were analyzed 72 times and 40 times, respectively, by 4 Roche Cobas e602 analyzers on 7 different days. The total CVs were 4.5% and 1.9% for the negative and positive pooled samples. The reproducibility was 100% (95% CI: 94%–100%) for the negative and 100% (95% CI: 89%–100%) for the positive pooled samples.
Concordance between the Results of the Paired Heparin and EDTA Plasma
There were 139 pairs of heparin and EDTA plasma collected from the same draw, including 104 pairs from COVID-19 patients and another 35 pairs from non-COVID-19 patients. Both the Roche Anti-SARS-CoV-2 and the Abbott SARS-CoV-2 IgG assays showed 100% (95% CI: 97%–100%) concordance between the results from the paired heparin plasma and EDTA plasma samples.
Specificity
Both the Roche and the Abbott assays were nonreactive in the 5 samples collected from non-COVID-19 patients with other respiratory pathogen infections and 30 randomly selected non-COVID-19 patients. For the 38 samples collected before this COVID-19 pandemic, the Abbott assay results were all nonreactive, but the Roche assay generated 2 reactive results with the COI values of 1.18 and 5.01, respectively. Therefore, the specificities of the Abbott and the Roche assays were 100% (95% CI: 94%–100%) and 97% (95% CI: 90%–100%), respectively. The difference in specificities between these 2 assays was not statistically different (P = 0.500).
Sensitivity
Two hundred and forty-six samples were collected on different days from 70 patients who were diagnosed with COVID-19 by the RT-PCR test. The Roche assay generated 160 reactive results and the sensitivity was 65% (95% CI: 59%–71%). The Abbott assay identified 149 reactive samples and the sensitivity was 61% (95% CI: 54%–67%) (Fig. 1 and Table 1). Only 15 samples from 13 patients showed discordant results between the Roche and the Abbott assays, with 13 samples reactive in the Roche assay but nonreactive in the Abbott assay, and vice versa for the other 2 samples. These 13 patients became serologically positive by both assays later, and the 15 samples with discordance were collected around the seroconversion periods. For all 246 samples, the agreement between these 2 assays was 94% (95% CI: 90%–96%). The McNemar chi-square test suggested the discordance was statistically significant (P = 0.005).
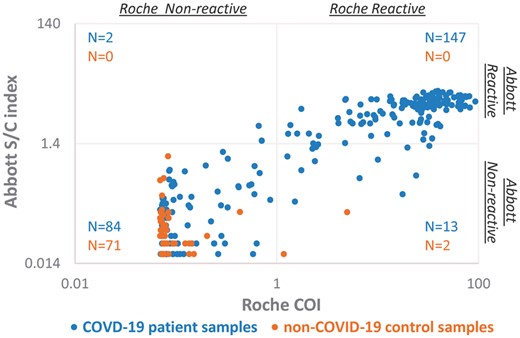
The scatter plot of signal indices of COVID-19 patient samples and non-COVID19 control samples when measured by the Roche and the Abbott immunoassays. Two hundred and forty-six specimens collected from 70 COVID-19 patients and 73 non-COVID19 control samples were tested by both the Roche (x) and the Abbott (y) immunoassays. The Roche assay interprets COI ≥ 1.0 as reactive, whereas the Abbott assay interprets S/C index ≥ 1.4 as reactive. Both COI and S/C index are in log scale.
Sensitivities of the Roche Anti-SARS-CoV-2 and Abbott SARS-CoV-2 IgG immunoassays.
| Roche sensitivity | Abbott sensitivity | |
|---|---|---|
| All specimens | 65% (160/246) (95% CI: 59%–71%) | 61% (149/246) (95% CI: 54%–67%) |
| 0–6 days | 55% (95/173) (95% CI: 47%–62%) | 49% (84/173) (95% CI: 41%-56%) |
| 7–13 days | 86% (49/57) (95% CI: 74%–93%) | 86% (49/57) (95% CI: 74%–93%) |
| ≥ 14 days | 100% (16/16) (95% CI: 76%–100%) | 100% (16/16) (95% CI: 76%–100%) |
These 246 samples were further classified according to blood collection dates after their first positive SARS-CoV-2 RT-PCR results. One hundred and seventy-three samples were collected within 6 days, 57 samples between 7 to 13 days, and 16 samples 14 days or later after the first positive RT-PCR test. The Roche assay showed sensitivities of 55% (95% CI: 47%–62%), 86% (95% CI: 74%–93%), and 100% (95% CI : 76%–100%) in these 3 groups of samples, whereas the Abbott assay demonstrated sensitivities of 49% (95% CI: 41%–56%), 86% (95% CI: 74%–93%) and 100% (95% CI : 76% –100%). For the same 3 groups of specimens, the agreement between these 2 assays were 91% (95% CI: 86%–95%), 100% (95% CI: 94%–100%), and 100% (95% CI: 81%–100%). The McNemar chi-square test analysis suggested that the Roche assay detected more positive results than the Abbott assay in the specimens collected within 6 days after the first positive RT-PCR test ( P = 0.005). However, for samples collected between 7 and 13 days and ≥ 14 days, there was no difference in sensitivity between these two assays.
Discussion
According to the manufacturers’ package inserts, the Abbott SARS-CoV-2 IgG assay has a specificity of 99.6% and the Roche Anti-SARS-CoV-2 assay has a specificity of 99.81%. The specificities for the Roche and the Abbott assays in this study of 73 specimens were 97% (95% CI: 90%–100%) and 100% (95% CI: 94%–100%), respectively, similar to the manufacturers’ claims. The COI values of the 2 reactive pre-pandemic samples measured by the Roche assay were 1.18 and 5.01. The COI value of 1.18 is very close to the cutoff value of 1.0. This could be due to a random error for a sample in the borderline zone and may become negative by retesting. The COI of the second false-positive sample was 5.01. This could be due to an interference or the cross reactivity with other coronavirus strains. The patient had hospital-acquired pneumonia, but it was unknown if the patient was infected with other coronavirus strains. This sample was also assayed by the DiaSorin SARS-CoV-2 S1/S2 IgG assay on the LIAISON XL analyzer (DiaSorin, Stillwater, MN, USA) and the result remained negative. The Roche package insert states that this assay has no biotin interference in serum concentrations up to 1200 ng/mL. Studies also showed no interference from hemolysis, icterus, lipemia (13), or rheumatoid factors (14). According to the package insert, potential interferences from pharmaceutical compounds other than biotin have not been tested and an interference cannot be excluded. In addition, in rare cases, interference due to extremely high titers of antibodies to analyte-specific antibodies, streptavidin or ruthenium can occur. We should point out that the pre-pandemic, respiratory pathogen-positive, and pandemic samples used for the specificity study were from presumptive non-COVID-19 patients because they were not confirmed by the RT-PCR testing. This is a limitation of the study, although the pre-pandemic samples were unlikely from individuals with SARS-CoV-2 infection. Another limitation of this study is that we did not use a QC sample with signal index close to the cutoff for the imprecision study. The manufacturers should provide this kind of QC samples in the future.
According to the CDC interim guidelines for COVID-19 antibody testing, the prevalence of SARS-CoV-2 antibody is expected to be low, ranging from <5% to 25%, so that testing at this point might result in relatively more false-positive results and fewer false-negative results (https://www.cdc.gov/coronavirus/2019-ncov/lab/resources/antibody-tests-guidelines.html, accessed June 15, 2020). To reduce false-positive results, one of the approaches recommended by the CDC is to employ an orthogonal testing algorithm in which persons who initially test positive are tested with a second test. As demonstrated in this study, the 2 false-positive results reported by the Roche assay were actually negative as determined by the Abbott assay.
Current evidence indicates SARS-CoV-2 antibodies begin to develop approximately 6 to 10 days after symptom onset (13). Abbott states that its assay has sensitivities of 25% (95% CI: 3.19%–65.09%), 86.4% (95% CI: 65.09%–97.09%), and 100% (95% CI: 95.89%–100.00%) at 3–7 days, 8–13 days, and ≥14 days after symptom onset; and Roche claims sensitivities of 65.5% (95% CI: 56.1%–74.1%), 88.1% (95% CI: 77.1%–95.1%) and 100% (95% CI: 88.1%–100.0%) at 0–6 days, 7–13 days, and ≥ 14 days, after RT-PCR confirmation. In our data set, the sensitivity of the Roche assay (55%) in samples collected within 0–6 days post RT-PCR is higher than that of the Abbott assay (49%). As the confidence intervals for the sensitivity of the 2 assays overlap, the clinical significance of this finding remains unclear. This observation may be due to differing definitions of early disease such as “after symptom onset” or “post RT-PCR” as shown in other studies (14–16). RT-PCR testing is typically performed after symptom onset and the delay may vary widely. Tang et al. also reported that the sensitivity of the Roche assay is higher when time from positive RT-PCR (0–13 days) instead of time from symptom onset was used as the starting point (14). We found that the sensitivities of both Abbott and Roche assays were 86% and 100% in samples collected between 7 and 13 days and ≥14 days post RT-PCR confirmation. It was reported that the sensitivities of the Abbott and the Roche assays in samples collected over 14 days post symptom onset were 93.75% and 89.36% (13, 15). Another recent study reported that the Abbott SARS-CoV-2 IgG assay had a specificity of 99.9% from 1020 pre-COVID-19 samples and a sensitivity of 100% at 17 days after symptom onset or 13 days after PCR positivity (17). The data in the current study additionally suggest that the cutoff values may dictate differing sensitivity and specificity. As shown in Fig.1, the S/C indices of non-COVID-19 patients in the Abbott assay are well below the cutoff value of 1.4. However, our study only included 73 non-COVID-19 samples. More non-COVID-19 samples could provide valuable information to optimize the cutoff value.
Both the Abbott SARS-CoV-2 IgG and the Roche Anti-SARS-CoV-2 assays list EDTA plasma and heparin plasma as acceptable specimens. In this study, 139 pairs of EDTA plasma and heparin plasma specimens showed 100% concordant results when tested by both assays. The linear regression of the COI index showed minimal bias for the Roche assay between EDTA and heparin plasma (Fig. 2). In contrast, the Abbott assay generated about 17% higher signal in average in heparin plasma compared with that in EDTA plasma at high S/C indices (>1.4). The bias was less than 10% when S/C index was below the cutoff value of 1.4. However, the qualitative results of heparin and EDTA plasma remained the same.
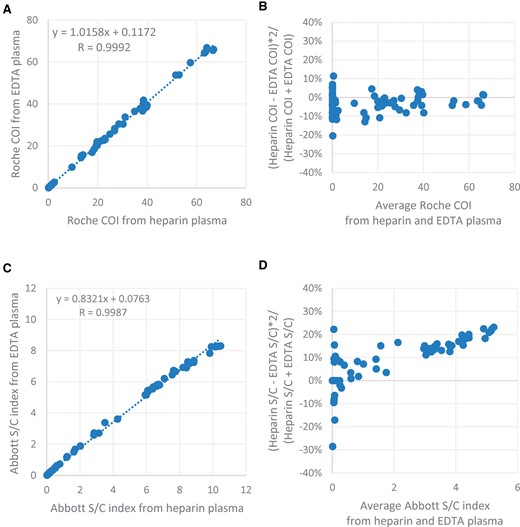
Comparison of the signal indices between 139 pairs of EDTA and heparin specimens for both Abbott and the Roche immunoassays. Roche COIs from the paired EDTA and heparin specimens were analyzed by linear correlation (A) and percent difference plot (B). Abbott S/C indices from the paired EDTA and heparin specimens were analyzed by linear correlation (C) and percent difference plot (D).
Both the Abbott (y) and the Roche (x) are qualitative assays based on quantitative measurement. There is a positive correlation (y = 0.1199x + 1.3349, R = 0.772) between the relative signals of the antibodies generated by the Abbott and the Roche assays in COVID-19 patients (Fig. 1). For both the Roche and Abbott assays, there was no significant difference among the signal index of the specimens collected at 0–6 days, 7–13, and ≥14 days post RT-PCR confirmation by Mann-Whitney U test when analyzed as a whole (Fig. 3). However, we did observe longitudinal increases in signal index in most patients, when analyzed individually (Fig. 4). This may be due to 2 reasons. First, the patients visited hospital for healthcare at different days after exposure to the virus. Second, there is a large inter-individual variation in patients’ antibody response. This implies that a single quantitative signal index is of little value in estimating the stage of the disease.
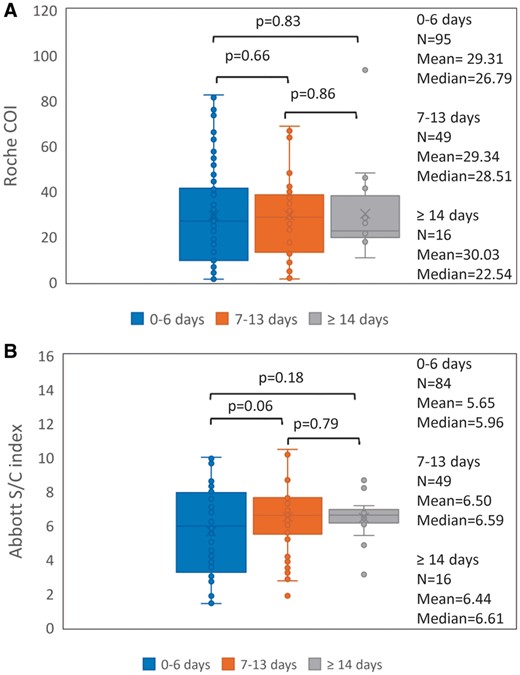
Comparison of the signal indices of all reactive samples from COVID-19 patients among three groups for both the Roche (A) and Abbott (B) assays. The specimens were divided into three groups according to their collection days: 0–6 days (n = 95 for the Roche assay and n = 84 for the Abbott assay), 7–13 days (n = 49 samples for both assays), and ≥ 14 days (n = 16 samples for both assays) post RT-PCR confirmation. Mann-Whitney U test was performed to determine whether the difference in the signal index among the 3 groups was statistically significant. The box and whisker plots represent the median, interquartile range, and the 5th percentile and the 95th percentile. The ‘X’ symbol indicates the mean.
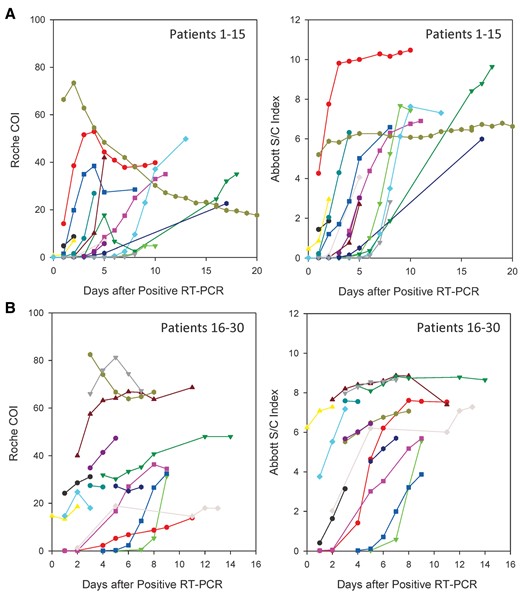
Antibody response in 30 patients with serial samples determined by the Roche and the Abbott assays. The signal indices of randomly selected patients 1–15 (A) and patients 16–30 (B) determined by the Roche and the Abbott assays were plotted according to the days after their first positive RT-PCR. The symbols with the same color in (A) or in (B) are corresponding to the same patient.
The Roche assay is designed to detect the total antibodies and the Abbott assay is to detect IgG antibody. In theory, the Roche assay should better detect early seroconversion. This advantage was true for 11 patients in this study, but the other 2 patients showed early seroconversion by the Abbott assay. It is unknown whether this finding is a consequence of differing antigen epitopes used in the immunoassay, although both assays utilize the nucleocapsid protein as target protein. This may also reflect the very heterogeneous nature of patients’ immune response to SARS-CoV-2. One study showed that patients developed IgG first, or IgM first, or both IgG and IgM antibodies simultaneously (9). Another study showed that patients developed IgM and IgA within a median of 5 days, and IgG with a median of 14 days after symptom onset (8). Similar to the finding in another report (14), we observed a few patients had transient decrease in the signal index of the Roche assay in the late stage, which may represent the switching from IgM to IgG production as well as different affinities between IgG and IgM (Fig. 4). More studies are needed to understand the kinetics of the antibody development in this novel disease.
In summary, this study demonstrates that the analytical performance of both the Abbott SARS-CoV-2 IgG and the Roche Anti-SARS-CoV-2 immunoassays is consistent with their claims. The clinical performance between these 2 immunoassays are similar, but the Roche assay may be slightly more sensitive for patients tested within 0–6 days after first positive RT-PCR of SARS-CoV-2.
Nonstandard Abbreviations: COI, cutoff index; COVID-19, coronavirus disease-2019; RTPCR, reverse transcription polymerase chain reaction; SARS-CoV-2, severe acute respiratory syndrome coronavirus 2.
Author Contributions: All authors confirmed they have contributed to the intellectual content of this paper and have met the following 4 requirements: (a) significant contributions to the conception and design, acquisition of data, or analysis and interpretation of data; (b) drafting or revising the article for intellectual content; (c) final approval of the published article; and (d) agreement to be accountable for all aspects of the article thus ensuring that questions related to the accuracy or integrity of any part of the article are appropriately investigated and resolved.
Authors’ Disclosures or Potential Conflicts of Interest: No authors declared any potential conflicts of interest. Role of Sponsor: No sponsor was declared. Acknowledgment: We thank Dr. Wallace Greene (Virology Laboratory, Department of Pathology and Laboratory Medicine, Penn State Hershey Medical Center and Penn State University College of Medicine) for confirming a false-positive sample in this study using a third assay.
