


Abstract
Epidemiologic studies have demonstrated that overweight/obese girls (OW/OB) undergo thelarche and menarche earlier than normal weight girls (NW). There have been no longitudinal studies to specifically investigate how body weight/fat affects both clinical and biochemical pubertal markers in girls.
To investigate the effect of total body fat on reproductive hormones and on the maturation of estrogen-sensitive tissues during puberty in girls.
Ninety girls (36 OW/OB, 54 NW), aged 8.2 to 14.7 years, completed 2.8 ± 1.7 study visits over 4 years. Visits included dual-energy x-ray absorptiometry to calculate total body fat (TBF), Tanner staging, breast ultrasound for morphological staging (BMORPH; A-E), pelvic ultrasound, hormone tests, and assessment of menarchal status. The effect of TBF on pubertal markers was determined using a mixed, multistate, or Cox proportional hazards model, controlling for baseline BMORPH.
NW were older than OW/OB (11.3 vs 10.2 years, P < .01) at baseline and had more advanced BMORPH (P < .01). Luteinizing hormone, estradiol, and ovarian and uterine volumes increased with time with no effect of TBF. There was a time × TBF interaction for follicle-stimulating hormone, inhibin B, estrone, total and free testosterone, and androstenedione: Levels were initially similar, but after 1 year, levels increased in girls with higher TBF, plateaued in girls with midrange TBF, and decreased in girls with lower TBF. Girls with higher TBF progressed through BMORPH stage D more slowly but achieved menarche earlier than girls with lower TBF.
In late puberty, girls with higher TBF demonstrate differences in standard hormonal and clinical markers of puberty. Investigation of the underlying causes and clinical consequences of these differences in girls with higher TBF deserves further study.
There have been significant secular changes both in the timing and duration (or tempo) of puberty in girls in the United States and abroad. Over the past few decades, the average age of thelarche has decreased by more than 1 year, whereas the average age of menarche has decreased by less than 4 months (1, 2). The disparate secular changes in these 2 key reproductive milestones suggest that girls are starting puberty earlier but developing at a slower pace. A recent meta-analysis of 14 studies concluded that earlier thelarche is in fact associated with slower progression to menarche (3). Contemporary overweight (OW) or obese (OB) girls, however, show a slightly different maturational pattern: thelarche and menarche are both occurring significantly earlier than in normal weight (NW) girls of current and past generations (4, 5). This is not a novel observation; an association between obesity and earlier puberty was reported in studies of US girls as early as the 1970s (6). With more detailed longitudinal studies, however, it has recently become apparent that in contrast to NW girls, in whom earlier thelarche is associated with a longer time to menarche (5), girls with greater childhood adiposity have earlier thelarche and progress through puberty at a faster rate than NW girls (reviewed in [3]).
These data suggest that obesity affects the female reproductive axis in a manner that is distinct from other environmental factors contributing to earlier puberty in modern NW girls. Studies of gonadotropin and estradiol (E2) levels in early pubertal OW/OB vs NW girls, however, have produced conflicting results, with some suggesting earlier activation of the central components of the axis in OW/OB girls and others being more consistent with a peripheral source of estrogen (eg, adipose tissue) driving puberty in OW/OB girls (7-13). Importantly, there has been no longitudinal assessment of contemporaneous clinical and biochemical indices (gonadotropins and sex steroids) during pubertal development in OW/OB vs NW girls.
Here we report the results of a longitudinal study in a cohort of 90 (40% OW/OB, 60% NW) pubertal girls. This study was specifically designed to investigate the effect of total body fat on reproductive hormone profiles and on the maturation of the estrogen-sensitive tissues (breast, uterus, urogenital epithelium, growth plates) from early/midpuberty through menarche.
Materials and Methods
Participants
Participants were healthy premenarchal girls with some breast development (per parental report) recruited from the Triangle region of North Carolina. Baseline characteristics for 80 of the participants were reported previously (10). The girls had no chronic medical conditions, were not taking any medications or supplements known to affect puberty, and had no history of precocious puberty or premature pubarche (defined as breast development or pubic and/or axillary hair before age 8 years, respectively). The girls also had no signs of hyperandrogenism (HA; defined as moderate or severe acne or hirsutism). The study was approved by the National Institute of Environmental Health Sciences Institutional Review Board. Signed informed assent and consent was obtained from each girl and her parent, respectively.
Protocol
Participants were enrolled from January 2016 to September 2020. They completed 1 to 8 study visits (mean ± SD: 2.8 ± 1.7 visits) approximately 8 months apart (Fig. 1). All visits included a complete physical exam with Tanner staging of the breast and pubic hair, breast ultrasound for breast morphological staging (BMORPH) (Fig. 2), and blood and urine collection. Dual-energy x-ray absorptiometry (DXA), a transabdominal pelvic ultrasound, and a hand x-ray (bone age; BA) were performed during visits 1 (V1) and 2 (V2). Menarchal status was determined at each study visit and every 3 months by telephone until September 2020. A questionnaire (by phone interview or online) was also administered to participants with a free testosterone (FT) greater than the median value at V2 and/or visit 3 (V3) in 2020 to inquire about menstrual regularity and any changes to their medical history, medications, and family history. The number of girls who completed each study visit and associated study procedures is listed in Supplementary Table 1 (14). Participants who were lost to follow-up after V2 were more likely to be younger (10.6 ± 1.3 vs 11.0 ± 1.3 years, P = .1) with less mature BMORPH (P < .01) than those who completed more than 2 study visits. There were no differences in ethnicity or body mass index (BMI) Z scores, but girls lost to follow-up tended to have higher total body fat (TBF; 34.6 ± 8.9 vs 31.4 ± 9.4, P = .1).
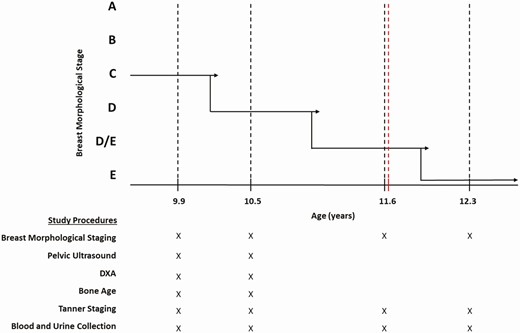
Protocol schema. Maturation of breast morphology from stage C to E is shown for a representative participant who was studied at 6 visits from age 9.9 years (premenarche) to 12.3 years (7 months post menarche). Solid black lines indicate hypothetical transition points between breast morphological stages, black dotted lines indicate study visits, and the red dotted line indicates menarche. The study procedures completed at each visit are denoted by an “X” below the graph. DXA, dual energy x-ray absorptiometry.
All study procedures were conducted at the clinical research unit of the National Institute of Environmental Health Sciences or off-site at a private medical imaging facility.
Anthropometrics and Tanner Staging
Height and weight were measured using a stadiometer (SECA AccuHite 216) and a physician beam scale (Healthometer model 402KL), respectively. Waist-to-hip ratio was measured according to the National Health and Nutrition Examination Survey (NHANES) Anthropometry Procedures Manual (15). Breast Tanner stage was assigned by a pediatric endocrinologist (N.D.S.) based both on palpation and inspection of the breast.
Annual height and weight measurements dating back to age 3 years were collected from each participant’s primary care physician, with permission, to identify different classes of childhood BMI trajectories, as previously described (16).
Blood and Urine Sampling
A nonfasting blood sample was collected between 8 am and 4 pm to measure reproductive hormones. Gonadotropins were measured by direct immunoassay using the automated Abbott ARCHITECT system (Abbott Diagnostics) which has a limit of quantification (LOQ) of 0.1 IU/L both for luteinizing hormone (LH) and follicle-stimulating hormone (FSH) (17). Estradiol (E2), estrone (E1), total testosterone (TT), and androstenedione (AD) were measured by liquid chromatography–mass spectrometry (Triple Quad 6500 LC/MS/MS System, AB SCIEX) at the Division of Laboratory Sciences, National Center for Environmental Health, Centers for Disease Control and Prevention. The assay limits of detection and LOQ are E2 1.72 pg/mL and 5.74 pg/mL; E1 0.13 ng/dL and 0.44 ng/dL; TT 0.57 ng/dL and 1.91 ng/dL; and AD 0.82 ng/dL and 2.75 ng/dL, respectively. All hormone measurements were above the limits of detection except for E1 (2 samples at V2) and E2 (23 samples at V1, 14 samples at V2), and all measurements were above the LOQ except for E1 (6 samples at V1, 4 samples at V2) and E2 (31 samples at V1, 19 samples at V2). Sex hormone–binding globulin (SHBG) was measured using a chemiluminescent immunoassay (Siemens Immulite 2000 XPi analyzer). FT was calculated from total T, SHBG, and albumin (set at 4.3 g/dL) using the equation developed by Vermeulen et al (18). Inhibin B (INHB) was measured in a subset of V2 and V3 samples (n = 95) using the Ansh Labs enzyme-linked immunosorbent assay, which has a sensitivity of 14 pg/mL, at the Ligand Assay and Analysis Core, Center for Research in Reproduction, University of Virginia. Urine was collected to obtain urogenital epithelial cells for calculation of a modified vaginal maturation index (mVMI), as previously described (10). Cells were classified as superficial (mature, indicative of estrogen exposure) or nonsuperficial (other), and the mVMI was reported as the percentage of superficial squamous cells.
Breast Ultrasound
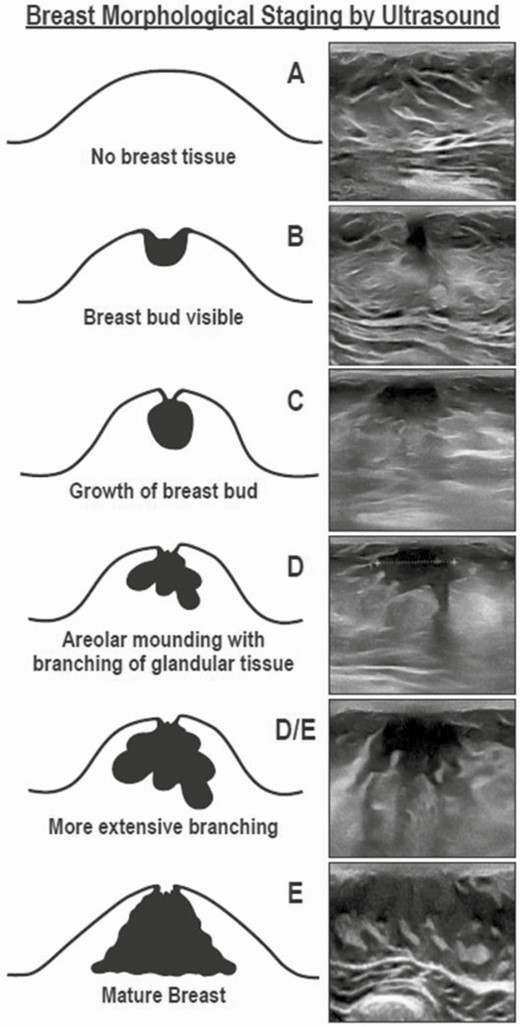
BMORPH was determined by ultrasound using a linear transducer (Samsung H60, 6-4 Hz or Toshiba Nemio 30, 12 Hz) and classified as stage A (no breast bud), stage B (bud < 1 cm and circular), stage C (bud > 1 cm and circular), stage D (bud with several branches extending into surrounding stromal matrix), or stage E (extensive branching), as previously described (19). An additional stage, stage D/E, was added to the staging system to best represent girls who had an intermediate level of ductal branching (see Fig. 2). Breast ultrasounds were performed by a single investigator (N.D.S.).
Pelvic Ultrasound
A transabdominal pelvic ultrasound was performed using the full-bladder technique and a curved, 6- to 4-Hz transducer (Siemens S-2000). Maximum follicle diameter, ovarian and uterine dimensions, and endometrial thickness were recorded. Uterine and ovarian volumes were calculated using the formula for an ellipsoid (L × H × W × 0.523). Both ovaries were visualized in 71 girls at V1 and 56 girls at V2, 1 ovary was visualized in 9 girls at V1 and 12 girls at V2, and neither ovary was visualized in 2 girls at V2. All images were independently reviewed by trained research staff.
Dual-Energy X-Ray Absorptiometry
Participants underwent a DXA (GE Medical Systems Lunar; software version 13.60.033) to determine TBF, percent gynoid fat (ie, percentage of hip and upper thigh tissue made up of fat), and percentage android fat (ie, percentage of tissue between the ribs and pelvis made up of fat). A negative pregnancy test was documented before the exam.
Bone Age
An x-ray of the left hand was taken and skeletal age was determined by a single investigator (N.D.S.) blinded to each participant’s age using the Greulich and Pyle atlas (21).
Data Analysis
Body weight category was assigned according to age-adjusted BMI categories of either NW (5th to < 85th percentile), OW (85th to < 95th), or obese (> 95th) (22). OW and OB participants were then collapsed into a single category (OW/OB) for comparison of clinical characteristics with NW using t test or Fisher exact test. An ordinal logistic regression, with body weight category and age at V1 as covariates, was performed to determine whether the difference in BMORPH at V1 between OW/OB and NW was attributable to their difference in age.
Participants were also categorized as having 1 of 4 childhood BMI trajectory patterns, as determined using latent growth mixture modeling (LGMM): class 1 (chronic healthy lean; n = 24 [26.9%]; Z-score -0.5 to -1), class 2 (chronic healthy normal; n = 23 [25.3%]; Z score 0-0.5), class 3 (chronic overweight; n = 31 [34.0%]; Z score > 1 since age 5-6 years), or class 4 (chronic obese with pubertal exacerbation; n = 12 [13.8%]; Z score > 1.64 since age 5-6 years with peak of nearly 2.5 at age 9 years) (Supplementary Fig. 1 [14]). Standardized BMI scores were modeled using the censored normal model in SAS Proc Traj (23). The optimal number of profiles was determined by generating a series of LGMM models with an increasing number of classes and iteratively comparing each successive model using Bayesian information criterion.
Longitudinal analysis of reproductive hormone levels and hormone action according to body fat or body mass index
Serum hormones and mVMI were analyzed after natural-log or square-root transformation, respectively, due to non-Gaussian distributions. A mixed model with random intercepts for each participant and unstructured covariance was used to investigate the effect of V1 TBF (continuous) on the change in: 1) reproductive hormones (FSH, LH, E1, E2, TT, FT, AD, INHB) from V1 to V3; 2) mVMI from V1 to V3; 3) indices of systemic estrogen exposure (BA, uterine volume, and endometrial thickness) from V1 to V2; and 4) indices of FSH action (maximum ovarian volume, maximum follicle diameter) from V1 to V2. Mixed modeling performed well in all cases except for follicle diameter because of low within-subject covariance; follicle diameter was therefore analyzed using a standard regression model.
The first iteration (model 1) included BMORPH at V1, time since V1, TBF, an interaction term (time*TBF), and race. The model for uterine volume also included participant height and age at V1, the model for ovarian volume included age at V1, and models of serum hormones included the time of blood draw (am or pm). The interaction term was dropped if not significant, using P less than .05 (model 2). To test for potential nonlinear changes over time (eg, accelerations or decelerations), model 3 included quadratic time and a 3-way interaction term (time*time*TBF) in addition to the interaction term, time*TBF. The 3-way interaction term was dropped if not significant (model 4). The most parsimonious model was selected as the final model. Analyses were repeated after substituting percentage gynoid fat, BMI percentile, or childhood BMI trajectory pattern for TBF. Race did not alter the effects of time or interactions (eg, time*TBF) and was therefore dropped from all models.
Each participant’s influence on a given model was determined using iterative influence analysis. This analysis focused primarily on the restricted likelihood distance, which reflects a participant’s overall influence on the model parameters when her observations are removed and the model is recalculated. The restricted likelihood distance flagged 2 participants: 1) an OW girl who had an extremely long (~ 2-year) interval between V2 and V3; her hormonal data from V3 were therefore excluded, and 2) an NW participant with FSH values greater than 3 SDs above the mean at each visit; her FSH values were excluded.
Body fat, hormones, and the pace of breast development
A multistate Markov model (msm) was used to study the relationship between TBF and the pace of breast maturation. Multistate models are frequently used to study transitions through multiple states of a condition (eg, health-illness-severe illness in disease progression studies). The states in the current msm are the 6 stages of breast maturation as determined by ultrasound (A, B, C, D, D/E, and E; see Figs. 2 and 3). An msm was selected for these data because 1) observations of the state (breast ultrasound stage) were collected at arbitrary times that varied across participants, and 2) the exact times of a participant’s transitions were unknown. Msms may include an absorbing state (eg, death) from which no transitions can occur; the current model does not include such an absorbing state because regressions to more immature breast stages were observed, albeit rarely (n = 7).
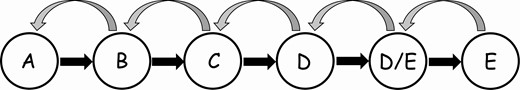
Diagram of multistate model of transitions among breast morphological stages A to E.
A total of 224 data points (154 transitions for 70 participants; Supplementary Table 2; [14]) were used to fit a model by maximum likelihood with the R package msm (24). The msm output consists of estimates of the rates of transition out of each breast stage. Total body fat percentage was included as a covariate. Because TBF was determined only at V1 and V2, the average TBF from V1 and V2 for each participant was carried forward to subsequent visits. Sensitivity analyses demonstrated that excluding postmenarchal data points (when progesterone exposure may have influenced breast maturation) or limiting the analysis to BMORPH stages C and higher (which represents the majority of the data) did not alter the results. Note that the identity of the reproductive hormone(s) most likely to account for the TBF-driven differences in BMORPH maturation could not be determined because of collinearity among hormones. See the Supplementary Methods (14) for additional details.
Body fat, race, and the time to menarche
The effects of body fat/BMI (TBF, percentage gynoid fat, or BMI percentile) at V1 and race on time to menarche were determined using Cox proportional hazard models (Proc PHREG, SAS v9.4, SAS Institute Inc). Measures of body fat/BMI were modeled as continuous variables. BMI percentile (determined at each visit) was modeled as a time-varying exposure. Hazard ratios (HRs) were calculated for body fat/weight and for race (“White” as reference). The median age at menarche for each group was calculated using SAS Proc Lifetest, stratifying by race. Girls who remained premenarchal (n = 2 NW, 2 OW, 5 OB) or who were lost to follow-up (n = 15 NW, 4 OW, 4 OB) were right-censored. All statistical analyses were performed using either R 3.4.2 or SAS v9.4.
Results
Baseline Characteristics
Ninety girls, aged 10.9 ± 1.3 (mean ± SD) years at enrollment, participated (Table 1). Sixty percent were NW, 21.1% were OW, and 18.9% were OB. NW girls were older than OW/OB girls and were more likely to be non-Hispanic White. Overweight/obese girls had greater waist circumferences and waist-to-hip ratios than NW girls. Percentage TBF was higher in OW/OB than in NW because of larger depots of both gynoid and android fat.
Baseline characteristics of the cohort
| Baseline characteristics | All participants (n = 90) | NW (n = 54) | OW/OB (n = 36) | P |
|---|---|---|---|---|
| Age, y; mean, SD | 10.9 ± 1.3 | 11.3 ± 1.3 | 10.2 ± 1.1 | < .001 |
| Race (n, %) | ||||
| White, Non-Hispanic | 50 (56%) | 36 (66%) | 14 (40%) | .03 |
| Black, Non-Hispanic | 26 (30%) | 12 (22%) | 14 (40%) | |
| Hispanic | 9 (10%) | 3 (6%) | 6 (17%) | |
| Other | 4 (4%) | 3 (6%) | 1 (3%) | |
| Anthropometrics (mean, SD) | ||||
| Weight, kg (percentile) | 44.2 ± 10.6 (67.6 ± 28.5) | 39.1 ± 6.6 (51.0 ± 24.4) | 51.9 ± 11.1 (93.3 ± 7.2) | < .001 |
| Height, cm (percentile) | 147.3 ± 8.8 (64.1 ± 26.9) | 148.5 ± 8.8 (58.3 ± 26.7) | 145.5 ± 8.6 (73.1 ± 25.1) | .1 |
| BMI, kg/m2 | 20.2 + 4.1 | 17.6 ± 1.7 | 24.3 ± 3.5 | < .001 |
| BMI Z score | 0.6 + 1.1 | −0.08 ± 0.7 | 1.7 ± 0.4 | < .001 |
| Total body fat, % | 32.7 + 9.3 | 27.1 ± 6.8 | 41.3 ± 4.9 | < .001 |
| Gynoid fat, % | 41.25 + 7.8 | 35.3 ± 6.3 | 45.5 ± 5.5 | < .001 |
| Android fat, % | 38.6 + 13.6 | 23.3 ± 9.4 | 44.9 ± 7.1 | < .001 |
| Total body fat percentile, % | 50.2 + 34.0 | 29.5 ± 26.0 | 82.5 ± 13.5 | < .001 |
| Waist circumference, cm | 70.9 + 9.5 | 65.4 ± 5.4 | 75.5 ± 10.6 | < .001 |
| Waist-to-Hip ratio | 0.85 + 0.06 | 0.82 ± 0.05 | 0.9 ± 0.04 | .002 |
| Bone age, y; mean, SD | 11.3 + 1.1 | 11.7 ± 1.0 | 11.3 ± 1.3 | .1 |
| Bone age - chronologic age (y; mean, SD) | 0.7 ± 1.1 | 0.4 ± 1.0 | 1.1 ± 1.0 | .002 |
| Breast Tanner stage (n, %) | .4 | |||
| I | 8 (9%) | 3 (5%) | 5 (14%) | |
| II | 2 (3%) | 0 (0%) | 2 (6%) | |
| III | 56 (62%) | 37 (69%) | 19 (52%) | |
| IV | 12 (13%) | 8 (15%) | 4 (11%) | |
| V | 12 (13%) | 6 (11%) | 6 (17%) | |
| Pubic hair Tanner stage (n, %) | .9 | |||
| I | 15 (17%) | 7 (13%) | 8 (22%) | |
| II | 11 (12%) | 8 (15%) | 3 (8%) | |
| III | 29 (32%) | 20 (37%) | 9 (25%) | |
| IV | 26 (29%) | 15 (28%) | 11 (31%) | |
| V | 9 (10%) | 4 (7%) | 5 (14%) | |
| Breast morphological stage (n, %) | < .001 | |||
| A | 10 (11%) | 2 (4%) | 8 (22%) | |
| B | 10 (11%) | 3 (6%) | 7 (19%) | |
| C | 15 (17%) | 11 (20%) | 4 (11%) | |
| D | 26 (29%) | 14 (26%) | 12 (34%) | |
| D/E | 18 (20%) | 17 (31%) | 1 (3%) | |
| E | 11 (12%) | 7 (13%) | 4 (11%) |
Abbreviations: BMI, body mass index; NW, normal weight; OB, obese; OW, overweight.
NW and OW/OB girls had a similar distribution of Tanner breast and pubic hair stages that ranged from Tanner I to V in both groups. The full spectrum of BMORPH staging (A-E) was also observed in NW and OW/OB groups, but NW girls had more advanced BMORPH, a difference attributable to NW girls’ older age at enrollment.
Tanner breast stage II corresponded most frequently to BMORPH stage B; Tanner breast stage III to BMORPH stages C and D; Tanner breast stage IV to BMORPH stages D and D/E; and Tanner breast stage V to BMORPH stages D/E and E. Tanner breast staging overestimated the presence of breast tissue in 5 girls but underestimated the presence of breast tissue in 8 girls; all such girls had high TBF at V1 (defined as > median of 32.6%). These data represent a false-positive rate of 31% (95% CI, 11%-59%) and false-negative rate of 3% (95% CI, 2%-7%), consistent with a recent study of more than 600 Norwegian girls (25).
Relationship between visit 1 and visit 2 total body fat and the pace of breast maturation
Changes in breast morphology on ultrasound were determined in the 70 (~ 80%) girls who had at least 2 breast ultrasounds. Participants underwent 2.8 ± 1.7 (mean ± SD, range 1-8) breast ultrasounds during the course of the study with no difference in monitoring between NW and OW/OB girls (number of ultrasounds: NW 2.7 ± 1.7 vs OW/OB 2.9 ± 1.7 scans, P = 1.0). There was no change in average TBF (33.0 ± 9.0) from V1 to V2.
Analysis of BMORPH transitions using multistate modeling demonstrated that progression through the early stages of breast development was unaffected by mean TBF. Girls with higher mean TBF, however, progressed more slowly out of breast stage D (to D/E or E) than those with lower mean TBF (Fig. 4, Supplementary Table 3 [14]): An increase of 5 percentage points in mean TBF, for example, was associated with a 26% decrease in the transition rate out of stage D. Because the reciprocal of a transition rate is equal to the expected amount of time spent in a particular state (also known as sojourn time), the effect of TBF can also be illustrated by comparing sojourn times: A girl with TBF of 33%, for example, would be predicted to spend 0.68 (± 0.14) years in breast stage D, whereas a girl with 38% TBF would be predicted to spend 0.93 (± 0.19) years in breast stage D.
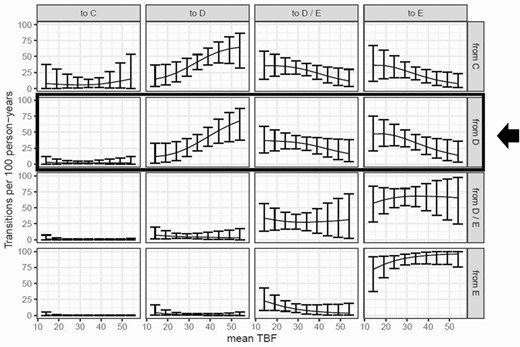
Higher total body fat percentage (TBF) is associated with slower progression out of breast stage D. This figure displays the number of transitions between breast morphological stages (BMORPH) C, D, D/E, and E as a function of TBF. BMORPH stages A and B are excluded because of low sample size. The y-axis shows the median number of transitions occurring over 100 person-years, based on 5000 simulations, as previously described (26). The x-axis shows mean TBFs. Transitions for mean TBFs of 14% to 54% are connected by a solid black line to aid visualization. Error bars indicate 95% CI based on percentiles of the simulated values. As highlighted by the black box and arrow, for an individual in breast stage D, a higher mean TBF is associated with a higher probability of remaining in stage D (second column) and a lower probability of transitioning to stages D/E (third column) or E (fourth column) after 1 year. Mean TBF has no effect on the probability of regressing to stage C (first column). See Supplementary material for additional details.
Relationship between visit 1 percentage total body fat and changes in reproductive hormones and modified vaginal maturation index from visit 1 to visit 3
All hormones and mVMI increased as a function of breast morphological stage at V1, and LH, E2, and mVMI increased in all participants over time (Fig. 5A, Table 2, Supplementary Table 4 [14]). Percentage TBF had no effect on LH, E2, or mVMI, whereas there was a significant interaction between time and TBF for FSH, INHB, E1, TT, and AD, and a similar trend for FT (TBF*years, P = .1). For these hormones, levels were initially similar in all TBF groups, but after 1 year, levels increased in girls with high TBF, remained relatively constant in girls with midrange TBF, and decreased in girls with low TBF. The finding of discordant FSH levels but comparable E2 levels according to TBF suggested decreased E2 negative feedback in girls with higher TBF. However, analysis of the FSH to E2 ratio at each time point revealed no effect of TBF, arguing against this hypothesis. Mixed modeling was repeated after substituting percentage gynoid fat, BMI Z score, or childhood BMI trajectory pattern (Supplementary Table 4 and Supplementary Fig. 1 [14]) for TBF, and these models produced similar results. The inclusion of menarchal status as a time-varying covariate did not alter the results of any model.
β coefficients with associated SEs and P values for each preferred mixed model that included percentage total body fat and breast morphological stage at study visit 1, time (expressed as years since first visit) and a serum hormone level, modified vaginal maturation index, or a measure of estrogen or follicle-stimulating hormone end-organ effects
| Covariate | β | SE | P | Covariate | β | SE | P | Covariate | β | SE | P | |||
|---|---|---|---|---|---|---|---|---|---|---|---|---|---|---|
| ln_E1 | TBF V1 | –.002 | 0.010 | .86 | ln_TT | TBF V1 | –.0001 | 0.009 | 1.0 | sqrt_OV VOL | TBF V1 | .001 | 0.008 | .90 |
| y | .476 | 0.280 | .09 | y | .213 | 0.193 | .27 | y | 0.335 | 0.105 | .002 | |||
| TBF V1ay | .003 | 0.008 | .69 | TBF V1ay | .002 | 0.006 | .77 | Age V1 | 0.152 | 0.056 | .009 | |||
| yay | –1.072 | 0.421 | .01 | yay | –.551 | 0.290 | .06 | BMORPH V1 | .06 | |||||
| TBF V1ayay | .030 | 0.013 | .02 | TBF V1ayay | .019 | 0.009 | .04 | A | –.623 | 0.285 | ||||
| Blood draw time | –.100 | 0.096 | .30 | Blood draw time | .043 | 0.068 | .53 | B | –.479 | 0.291 | ||||
| BMORPH V1 | < .001 | BMORPH V1 | < .001 | C | –.347 | 0.242 | ||||||||
| A | –1.758 | 0.293 | A | –1.127 | 0.266 | D | –.203 | 0.225 | ||||||
| B | –1.265 | 0.309 | B | –.859 | 0.277 | D/E | .125 | 0.212 | ||||||
| C | –.691 | 0.261 | C | –.372 | 0.238 | E | Ref | |||||||
| D | –.537 | 0.246 | D | –.207 | 0.223 | |||||||||
| D/E | –.163 | 0.236 | D/E | 0.101 | 0.214 | ln_uterine VOL | TBF V1 | .008 | 0.009 | .39 | ||||
| E | Ref | E | Ref | y | .489 | 0.111 | < .001 | |||||||
| Age V1 | .070 | 0.068 | .31 | |||||||||||
| ln_E2 | TBF V1 | .009 | 0.014 | .50 | ln_AD | TBF V1 | .001 | 0.009 | .95 | Height V1 | .087 | 0.028 | .003 | |
| y | 1.074 | 0.125 | < .001 | y | –.071 | 0.192 | .71 | BMORPH V1 | < .001 | |||||
| Blood draw time | .271 | 0.170 | .11 | TBF V1ay | .011 | 0.006 | .06 | A | –1.265 | 0.309 | ||||
| BMORPH V1 | < .001 | yay | –.447 | 0.288 | .12 | B | –.620 | 0.342 | ||||||
| A | –2.567 | 0.432 | TBF V1ayay | .019 | 0.009 | .04 | C | –.600 | 0.273 | |||||
| B | –1.917 | 0.460 | Blood draw time | .056 | 0.068 | .41 | D | –.291 | 0.237 | |||||
| C | –1.220 | 0.387 | BMORPH V1 | < .001 | D/E | .141 | 0.222 | |||||||
| D | –0.924 | 0.363 | A | –1.448 | 0.257 | E | Ref | |||||||
| D/E | .143 | 0.353 | B | –1.138 | 0.268 | |||||||||
| E | Ref | C | –.519 | 0.230 | ln_endo_thick | TBF V1 | .0003 | 0.007 | .963 | |||||
| D | –.384 | 0.215 | y | .393 | 0.130 | .004 | ||||||||
| ln_FSH | TBF V1 | .002 | 0.006 | .77 | D/E | –.084 | 0.207 | BMORPH V1 | < .001 | |||||
| y | –.330 | 0.197 | .10 | E | Ref | A | –1.251 | 0.230 | ||||||
| TBF V1ay | .016 | 0.006 | .01 | B | –1.180 | 0.244 | ||||||||
| Blood draw time | .192 | 0.071 | .008 | ln_INHB | TBF V1 | –.021 | 0.011 | .07 | C | –.827 | 0.208 | |||
| BMORPH V1 | < .001 | y | –1.091 | 0.564 | .07 | D | –.629 | 0.196 | ||||||
| A | –1.037 | 0.183 | TBF V1ay | .042 | 0.017 | .02 | D/E | –.289 | 0.186 | |||||
| B | –.894 | 0.195 | Blood draw time | –.134 | 0.140 | .35 | E | Ref | ||||||
| C | –.476 | 0.164 | BMORPH V1 | .05 | ||||||||||
| D | –.250 | 0.154 | A | –.768 | 0.329 | Bone age | TBF V1 | .016 | 0.015 | .28 | ||||
| D/E | –.018 | 0.151 | B | –.602 | 0.343 | y | 1.237 | 0.102 | < .001 | |||||
| E | Ref | C | .049 | 0.285 | BMORPH V1 | < .001 | ||||||||
| D | –.181 | 0.273 | A | –2.178 | 0.462 | |||||||||
| ln_LH | TBF V1 | .005 | 0.017 | .79 | D/E | .047 | 0.268 | B | –2.232 | 0.483 | ||||
| y | .788 | 0.111 | < .001 | E | Ref | C | –1.233 | 0.420 | ||||||
| Blood draw time | .264 | 0.162 | .11 | D | –.647 | 0.394 | ||||||||
| BMORPH V1 | < .001 | sqrt_mVMI | TBF V1 | –.024 | 0.021 | .26 | D/E | –.307 | 0.375 | |||||
| A | –3.553 | 0.544 | y | .858 | 0.203 | < .001 | E | Ref | ||||||
| B | –2.641 | 0.569 | BMORPH V1 | .007 | ||||||||||
| C | –1.665 | 0.487 | A | –2.290 | 0.650 | follicle size | TBF V1 | .040 | 0.033 | .23 | ||||
| D | –.962 | 0.456 | B | –2.053 | 0.689 | y | 1.170 | 0.672 | .09 | |||||
| D/E | –.005 | 0.439 | C | –1.622 | 0.582 | BMORPH V1 | .04 | |||||||
| E | Ref | D | –.835 | 0.560 | A | –2.604 | 1.072 | |||||||
| D/E | –1.231 | 0.553 | B | –2.445 | 1.102 | |||||||||
| ln_FT | TBF V1 | .022 | 0.013 | .09 | E | Ref | C | –.564 | 0.957 | |||||
| y | .338 | 0.062 | < .001 | D | –.590 | 0.909 | ||||||||
| Blood draw time | .032 | 0.102 | .75 | D/E | .065 | 0.855 | ||||||||
| BMORPH V1 | .002 | E | Ref | |||||||||||
| A | –.728 | 0.652 | ||||||||||||
| B | –.716 | 0.660 | ||||||||||||
| C | –.045 | 0.599 | ||||||||||||
| D | .039 | 0.594 | ||||||||||||
| D/E | .928 | 0.621 | ||||||||||||
| E | Ref |
All hormones, VOL, and endometrial (endo) thickness were natural-log (ln)-transformed and mVMI and OV VOL were square-root-transformed before analysis.
Abbreviations: AD, androstenedione; BMORPH, breast morphological stage; endo thick, endometrial thickness; E1, estrone; follicle size, maximum follicle size; FSH, follicle-stimulating hormone; FT, free testosterone; INHB, inhibin B; LH, luteinizing hormone; OV VOL, maximum ovarian volume; mVMI, modified vaginal maturation index; Ref, reference; TBF, total body fat; V1, study visit 1; VOL, volume.
aDenotes an interaction.
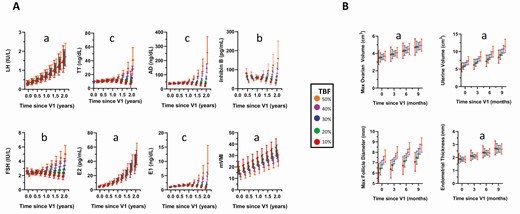
Temporal change in A, gonadotrophins, sex steroids, inhibin B, the modified vaginal maturation index (mVMI) and B, end-organ measures of estrogen or follicle-stimulating hormone (FSH) effects as a function of percentage total body fat (TBF). The x-axis reflects time since first study visit (V1). Models were adjusted for breast morphological stage at V1 and time of blood draw (am/pm). For models using square-root or natural log transformations, estimates were back-transformed for visualization purposes. aEffect of time, P < .005. bTime × TBF interaction, P < .05. cTime × time × TBF interaction, P < .05. Max, maximum.
Relationship between visit 1 total body fat and changes in indices of estrogen or follicle-stimulating hormone action from visit 1 to visit 2
Participants demonstrated the expected estrogen-induced changes in the uterus (increase in uterine volume [P < .001] and endometrial thickness [P = .003]) and growth plates (increase in BA, P < .001) from V1 to V2 (Fig. 5B, Table 2, Supplementary Table 4 [14]). Maximum ovarian volume, an index of FSH action, increased over time (P = .002) but maximum follicle size did not (P = .09) (see Fig. 5B, Table 2, Supplementary Table 4 [14]). Uterine volume and ovarian volume were positively related to height (P = .003) and age (P = .01) at V1, respectively, and all measures were influenced by BMORPH at V1 (P ≤ .03): Each measure increased in a stepwise fashion from breast stage A to E (see Table 2, Supplementary Table 4 [14]). Percentage TBF, gynoid fat, BMI Z score, and childhood BMI trajectory pattern had no effect on maturational changes.
Relationship between total body fat/body mass index, race, and age at menarche
The median age at menarche for all participants was 12.4 years (interquartile range 1.7). Black and Hispanic White participants achieved menarche earlier than non-Hispanic White participants (P < .01; Supplementary Table 5 [14]). Girls with higher TBF at V1 were more likely to have menarche at a younger age than those with lower TBF (Fig. 6). That is, for every 1-unit increase in V1 TBF, the chance of achieving menarche at any given time point was 3% higher (HR 1.03, 95% CI, 1.00-1.07, P = .05). Similar results were obtained using V1 percentage gynoid fat (HR 1.05; 95% CI, 1.01-1.09, P = .02), V1 BMI percentile (HR 1.01, 95% CI, 1.01-1.02, P = .003) or BMI percentile as a time-varying exposure across all visits (HR 1.02, 95% CI, 1.01-1.03, P = .004). There was no interaction between race and TBF.
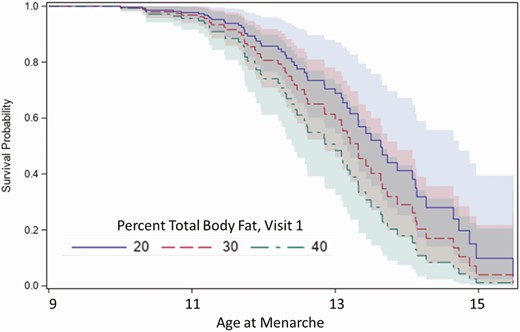
Survival curves of age at menarche in girls with percentage total body fat (TBF) of 20%, 30%, or 40% demonstrating that menarche occurred earlier in girls with higher TBF. Shaded areas indicate the 95% CI.
Clinical implications of relative hyperandrogenemia manifesting before menarche
The 19 participants with an FT greater than the median value at V2 (1.5 pg/mL) and/or V3 (2.4 pg/mL) were recontacted to inquire about clinical signs of HA such as acne, hirsutism, and oligomenorrhea. Eight girls responded and only 2 of them endorsed such symptoms. The first participant was a 15-year-old NW girl of mixed race with a V1 TBF of 32.4%. At a gynecologic age of 3.5 years, she reported moderate acne with scarring, hirsutism, and oligomenorrhea (menses every 2-3 months). Her family history was negative for hirsutism, irregular periods, infertility, polycystic ovarian syndrome, diabetes, or premature balding in male relatives. Of interest, her relative hyperandrogenemia predated menarche: Her FT increased from 4.3 pg/mL at V1 (1 year before menarche) to 5.1 pg/mL at V2 (1.5 years before menarche) to 12.3 pg/mL at V3 (8 months post menarche). The second participant was a 12-year-old OB Hispanic girl with a V1 TBF of 43.5%. At a gynecologic age of 9 months, she reported having acne, hirsutism, and oligomenorrhea (menses during 3 of 9 months). Her FT was only modestly elevated at V1 to V3 (1.5, 1.3, and 2.5 pg/mL, respectively). Her relevant family history was negative.
Discussion
We conducted a longitudinal study of reproductive hormones and clinical indices of hormone action in a cohort of contemporary US girls across a wide range of body weights and TBF. Previous studies raised the possibility of aberrant neuroendocrine control of puberty among OW/OB girls (earlier central activation and slower progression). We found, instead, that the maturation of both the central components of the reproductive axis and the gonad, as judged by the increase in ovarian hormones (determined by mass spectrometry) and peptides and by the growth of the ovary and uterus, appeared to be preserved in girls with higher TBF. It was not until the late stages of puberty/perimenarchal period that a relative hyperandrogenemia as well as delayed BMORPH maturation emerged in girls with greater TBF. In contrast to previous studies, we have complete confidence in our assignment of breast stages in OW/OB girls because we consistently employed breast ultrasound to complement Tanner staging.
In the present studies, all girls demonstrated an increase in serum LH and E2 over time independent of TBF. Increased E2 action was also evident from the increase in mVMI, uterine length and volume, endometrial thickness, BA, and by breast maturation (by ultrasound and Tanner staging). The FSH pattern, however, was unique: initially (~ first year of observation, midpuberty), neither the FSH level itself nor average ovarian volume and maximum follicle size, the 2 markers of FSH action captured at early visits (V1 and V2), were influenced by TBF. By late puberty, however, FSH levels continued to increase among girls with higher TBF, whereas FSH levels modestly declined in girls with lower TBF. The changes in FSH in late puberty were paralleled by changes in INHB, consistent with FSH stimulation of granulosa cell proliferation in early antral follicles, the predominant source of INHB in girls and women (27).
There has been a paucity of longitudinal studies of pubertal development and changes in estrogen levels in girls as a function of body weight/fat with which to compare our results. Biro et al convincingly demonstrated earlier thelarche and menarche in OW/OB girls in a recent longitudinal study of US girls (5, 28). While the changes in E1 and E2 (as well as AD, TT, and dehydroepiandrosterone) were portrayed in great detail in the 30 months leading up to thelarche and in the 6 months thereafter, gonadotropins were not measured and only the E2 levels were compared between body weight groups (split at the median BMI Z score) (9). A striking divergence in E2 levels was observed: There was a steady increase in E2 in the “low BMI” group and a slight decline in E2 in the “high BMI group.” It was not reported whether this pattern was sustained beyond 6 months; we suspect it may have reflected either transient thelarche (29) or misclassification of some prepubertal OW/OB girls as pubertal due to the recognized difficulty in distinguishing glandular tissue from adipose tissue by palpation in such girls (30). A second longitudinal study of affluent, urban Chinese schoolgirls similarly reported earlier thelarche and menarche in OB girls. While E2 levels were found to be higher in OB girls throughout the study, these analyses did not include age as a covariate to control for earlier pubertal timing in the OB group (31). Cross-sectional studies have also failed to demonstrate a correlation between body fat mass, quantified by skinfold measurements (32) or DXA (10, 33), and serum E1 or E2 in pubertal girls, and a decrease in E2 was not observed after OB girls underwent significant weight loss (34). We suspect this is because the amount of E2 synthesized by adipocytes is much lower than that contributed by the ovary during puberty.
Previous cross-sectional studies have not reported differences in FSH in pubertal girls as a function of BMI (11, 35-38) with the exception of one study of 54 US girls, which found significantly lower urinary FSH levels in OB compared with NW girls (9.4 vs 0.2 mIU/mg Cr) (39). Sims et al in 2012 (40) observed a negative correlation between INHB levels and subcutaneous fatness, as determined by skinfold thickness, in a cross-sectional study of 720 girls, aged 6 to 11 years, who comprise the NHANES III cohort. There was no relationship, however, between INHB levels and BMI. The study was largely limited to a prepubertal cohort (as determined by inspection without palpation), and the INHB assay was less sensitive than that used in the present studies. Thus, additional studies are necessary in late pubertal girls to determine how body fat affects FSH and INHB.
We also found, akin to previous studies based on BMI, that girls with higher TBF had higher serum androgens than girls with lower TBF. This hormonal divergence did not occur until late puberty. The difference was also relatively modest but it did result in clinical signs of HA in at least some participants who could be recontacted. For example, at V3, the lowest TBF group had an average FT of 1.5 pg/mL compared with an FT of 3.5 pg/mL in the highest TBF group. This difference is comparable to that reported by Kang et al (36) in NW vs OB Korean girls of Tanner breast stage IV to V (FT 2.5 vs 4.5, P < .05), Bordini et al (35) in NW vs OW/OB US girls with average Tanner breast stage III (FT 4.4 vs 6.6, not significant), and Torchen et al (41) in NW vs OB US girls with Tanner breast stage I to III (1.0 vs 2.2, P < .01). In contrast, McCartney et al (38) found that FT levels were remarkably higher in OB girls vs NW girls across all stages of puberty but particularly so in prepubertal and early-pubertal girls (8.8-fold difference). In a more recent paper, the same group proposed upper FT cutoffs of 3.4, 5.0, and 7.4 pg/mL for OB girls in early, midpuberty, and late puberty, respectively, and again found that most, but not all, girls with OB had HA (37). Regression models identified higher LH and fasting insulin levels as important predictors of HA (37). These FT levels are much higher than those observed in the present studies and may reflect the investigators’ decision to recruit participants from endocrinology clinics and to include individuals with clinical signs of HA.
The exact source of higher TT and AD levels in girls with greater TBF in late puberty is unclear as the ovary and adrenal gland make equal contributions to circulating androgens in girls. In the periphery, including in adipocytes, AD is converted to either the more potent androgen, T, via HSD17B5 (also known as aldo-keto reductase AKR1C3) (42) or to E1 via aromatase; only a small fraction of these so-called “intracrine” steroid products enter the bloodstream (43). The proportion of AD converted to T or E1 depends further on regional differences in enzyme expression. In adult men and women, T is the favored product in subcutaneous and omental fat from the abdomen (waist), whereas androgens and estrogens are produced in comparable amounts in fat of the buttocks and upper thighs (hips) (44, 45). It is not known if the same anatomic differences in steroidogenic enzymes exist in pubertal children, but in the present studies, we saw no association between WHR and AD/TT or AD/E1 (data not shown).
Previous studies by Knudsen et al suggest that insulin resistance among OB girls may mediate HA (37). Indeed, HSD17B5 is the rate-limiting enzyme in androgen biosynthesis, and insulin increases HSD17B5 expression and/or activity in human theca cells (46), adrenal cells (47), and subcutaneous adipocytes (48) in part by upregulating the transcription factor KLF15 (47, 48). We did not measure insulin in the present studies. Because adiposity is the strongest predictor of insulin resistance in children (49), it is quite possible that insulin resistance is responsible for the relative hyperandrogenemia observed in our OW/OB girls. It should be noted, however, that the increase in FT among girls with higher TBF may not simply reflect a lower SHBG in the context of hyperinsulinism. While a lower SHBG level among obese individuals was traditionally thought to reflect hyperinsulinemia and/or insulin resistance, more recent studies suggest a more complicated paradigm whereby inflammatory cytokines, dietary factors, and adiponectin interact to diminish SHBG levels in obese individuals (50).
In addition to a relative hyperandrogenemia, girls with greater TBF demonstrated delayed breast maturation at more advanced BMORPH stages (corresponding to growth and arborization of the breast ductal system) compared with girls with less TBF. Differences in breast maturation may have been driven by differences in reproductive, growth, and/or metabolic hormones or inflammation. The breast undergoes dramatic architectural changes during puberty in response to E2 (the key regulator), progesterone, prolactin, growth hormone, and insulin-like growth factor-1 (51). Resident macrophages of the mammary gland also play critical roles in morphogenesis by phagocytosing apoptotic epithelial cells to create the lumen of growing ducts and by secreting trophic and angiogenic factors (52, 53). The OW/OB girls in the present studies had higher androgens and E1 than their NW peers in late puberty but no difference in E2. While frank androgen excess is associated with breast atrophy in women (eg, adrenal hyperplasia or tumors, anabolic steroid use, or female-to-male transgender individuals) (reviewed in [54]), milder hyperandrogenemia, as occurs in premature or exaggerated adrenarche, is not known to compromise breast development in girls. However, a study of nearly 300 healthy White late-adolescent girls (median age 18 years) (55) found that serum FT was inversely correlated with total breast water (a measure of fibroglandular tissue) on magnetic resonance imaging, and in female mice, treatment with low-dose dihydrotestosterone during puberty (age 5-12 weeks) caused a 40% reduction in mammary ductal growth (56). Adiposity per se (greater TBF or greater breast fat relative to fibroglandular tissue) or the associated proinflammatory state and insulin resistance may also have influenced breast development in OW/OB girls. Studies on the effect of a high-fat diet administered during puberty on mammary epithelial cell proliferation and inflammation in the mouse, however, have produced conflicting results (57-60), and transgenic mice with insulin resistance and prediabetes demonstrate accelerated, not delayed, mammary development (61). In an RNA-sequencing study of breast tissue from 62 adolescents and young adult women (mean age 18 years) who underwent reduction mammoplasty, however, we recently demonstrated that obesity was in fact associated with a transcriptional signature of inflammation (62). It is unclear if our finding of greater inflammation in breast tissue of OB girls may simply be another sign of delayed breast development—that is, the population of immune cells required for early ductal morphogenesis may still be present in OB but not NW breast tissue by late adolescence—or if inflammation compromises breast development in OW/OB girls.
While we believe the present studies represent an ambitious longitudinal investigation, there were several important limitations. The majority of participants completed only 2 study visits, there were racial differences among the body weight groups, and the timing of blood draws was not standardized. We did not measure markers of inflammation, insulin resistance, nor 11-oxyandrogens (eg, 11-keto-testosterone), potent adrenal steroids that are gaining clinical relevance (63). We did not capture the timing of thelarche in these participants; as such, NW girls tended to be older and to have more advanced BMORPH than OW/OB girls at study entry. However, BMORPH at V1 was included as a covariate in statistical models. Previous investigators have reported a blunted nocturnal rise in LH among OB compared with NW pubertal girls (11, 35). Although we did not measure pulsatile LH secretion nor day/night differences in LH, our sex-steroid data are not consistent with a deficit in LH secretion in OW/OB girls.
In conclusion, intensive reproductive phenotyping of girls during the pubertal transition reveals that both the neuroendocrine and ovarian components of the axis appear to be preserved in girls with higher TBF. In late puberty, however, girls with higher TBF demonstrate subtle differences in hormonal (higher serum FSH, INHB, and androgen levels) and clinical (delayed arborization of the growing breast bud) markers of puberty. Investigation of the mechanistic basis for these differences and their potential clinical consequences in girls with higher TBF deserves further study.
Abbreviations
- AD
androstenedione
- BMI
body mass index
- BMORPH
breast morphological stage
- DXA
dual-energy x-ray absorptiometry
- E1
estrone
- E2
estradiol
- FSH
follicle-stimulating hormone
- FT
free testosterone
- INHB
inhibin B
- LGMM
latent growth mixture modeling
- LH
luteinizing hormone
- LOQ
limit of quantification
- msm
multistate Markov model
- mVMI
modified vaginal maturation index
- NW
normal weight
- OB
obese
- OW
overweight
- SHBG
sex hormone–binding globulin
- TBF
total body fat
- TT
total testosterone
- V1
visit 1
- V2
visit 2
- V3
visit 3
Acknowledgments
We thank and acknowledge the staff of the Clinical Research Unit, Wake Radiology, and Social and Scientific Systems, Inc for their support in conducting these studies. We thank the Ligand Assay and Analysis Core at the Center for Research in Reproduction, University of Virginia, for conducting the inhibin B assays, Paul Kim of Batelle for his technical assistance, and Lois Wyrick for assistance with graphic design.
Financial Support: This work was supported by the Intramural Research Program of the National Institutes of Health, National Institute of Environmental Health Sciences (grant No. Z01-ES103315). N.D.S. is also supported as a Lasker Clinical Research Scholar (grant No. 1SI2ES025429-01). The content is solely the responsibility of the authors and does not necessarily represent the official views of the National Center for Research Resources, the National Center for Advancing Translational Science, or the National Institutes of Health.
Clinical Trial Information: Clinicaltrials.gov registration No. NCT02583646 (registered October 21, 2015).
Additional Information
Disclosures: Dr. Shaw is an author for UpToDate. The remaining authors have nothing to disclose.
Data Availability
The data sets generated and/or analyzed during the present study are either included in the published article, included in the Supplementary material, or are available from the corresponding author on reasonable request.
References
Mann GS, Shivaram A, and Healey A.
