


Abstract
Dopamine agonists (DAs) are the first-line therapy for prolactinomas. Although pituitary tumors often do not completely disappear, discontinuing DAs in patients with no visible tumor on magnetic resonance imaging is advised.
To analyze biochemical remission after cabergoline (CAB) withdrawal in patients with visible remnant pituitary tumors.
Retrospective cohort study.
Severance Hospital.
We identified 734 patients with prolactinomas undergoing CAB therapy for at least 12 months from 2005 to 2018. We selected 44 patients with prolactinomas who discontinued CAB with normal prolactin levels; they were receiving a minimal CAB dose but had visible remnant tumors.
Median age at diagnosis was 32 (18-58) years, and most patients were women (95.45%). Median treatment duration was 32 (12-120) months. Of 44 patients, 33 continued to have normoprolactinemia, but 11 patients developed hyperprolactinemia after drug withdrawal within 26 (12-97) months. Age, sex, maximal and remnant tumor size, and treatment duration were similar between the groups. The initial prolactin level and chances of cavernous sinus (CS) invasion were higher in the recurrence group. CS invasion at diagnosis was associated with an increased recurrence rate. Although treatment response did not correlate with the initial and final signal intensity assessments, a significant decrease in T2 intensity ratio after 6 months of CAB therapy was observed in the remission group (P = .043).
In patients with visible tumors, the presence of CS invasion at diagnosis may be an unfavorable predictor for biochemical remission after CAB discontinuation.
Prolactinoma is the most prevalent pathologic cause of hyperprolactinemia (1). These tumors are typically noncancerous but lead to symptoms that are caused by hyperprolactinemia itself and suppressed gonadotropins. Prolactinoma is the most common type of pituitary adenoma and presents most frequently in women, with a peak prevalence in women aged 16 to 48 years (2).
Women with hyperprolactinemia can experience infertility, menstrual irregularities, loss of libido, galactorrhea, pain in breast, and vaginal dryness. In men, headaches, visual change, infertility, erectile dysfunction, loss of sexual desire, and gynecomastia may be symptoms of hypogonadism (3).
Dopamine agonists (DAs) are well recognized as the first-line therapy for prolactinomas because of their effectiveness in tumoral shrinkage and normalization of prolactin (PRL) secretion (4). Overall, DAs present excellent results in achieving 2 main goals in prolactinoma treatment: (1) normalization of PRL level to avoid galactorrhea and hypogonadotropic hypogonadism, and (2) reduction of tumoral size to prevent compressive signs and symptoms. These 2 main goals are attained in 90% of patients treated with cabergoline (CAB) and in 70% to 80% of those treated with bromocriptine (5).
However, prolactinomas require lifelong treatment and are associated with potential concerns about patient compliance, medical cost, and safety. The best time to withdraw DAs and the candidate patients in whom drug withdrawal should be attempted remain unknown. Previous studies on this topic suggest that medical intervention for more than 2 years, normal PRL levels after therapy, invisible tumor remnants on imaging studies after marked tumoral shrinkage (≥50%), and minimal dose of DAs before withdrawal are the most consistently identified predictors of complete remission after DA withdrawal (6, 7). Another study reported that tumor size was the main variable that affected the outcome after withdrawal, and that lower serum PRL levels at diagnosis and longer duration of CAB therapy could be predictors for remission after DA withdrawal (8). Patients with a maximum tumor diameter ≤3.1 mm at withdrawal were shown to have a longer remission period, and the risk of recurrence was calculated to be approximately 20% per millimeter of residual tumoral mass (9-11). Additionally, a recent study revealed that the lack of visible tumors on magnetic resonance imaging (MRI) was the most effective predictor of long-term remission after DA discontinuation, which is also advocated by the Endocrine Society guideline (4). However, factors like age and sex have been reported to be nondeterminants for the outcomes after DA withdrawal (8, 12, 13). Studies have reported that the postpregnancy/breastfeeding period and menopause period were reasonable times to stop DA therapy (14, 15).
A previous study reported that pituitary tumors became invisible in 29% of microadenomas and 17% of macroadenomas after CAB therapy (16). Another study showed no remnant tumor in 38% of patients with macroadenomas for a long-term follow-up period (median: 54 months) (17). Thus, the majority of patients still have remnant adenomas on MRI after CAB therapy. However, in some cases, normoprolactinemia is maintained after discontinuing CAB even if a remnant tumor is visible on MRI. Thus, considering the side effects and medical costs of the long-term use of DAs, it is necessary to evaluate when to discontinue CAB in hyperprolactinemic patients with visible pituitary tumors.
The lack of predictors for successful CAB withdrawal in patients with remnant pituitary tumors on MRI remains an important barrier according to clinicians. In this study, we aimed to analyze biochemical remission or relapse after CAB withdrawal in patients taking a minimal dose of CAB with normoprolactinemia but visible remnant pituitary tumor.
Subjects and Methods
Subjects
For this retrospective cohort study, we identified 734 patients who took CAB for at least 1 year under the diagnosis of prolactinoma at the Severance Hospital during 2005 to 2018. We excluded patients who had taken bromocriptine. In this study, 0.5 to 1 mg/week of CAB was administered for microadenomas and 1 to 3 mg/week was administered for macroadenomas, and the dose was titrated according to the tumor size and PRL levels. Of 734 patients, we excluded 99 because of the following reasons: follow-up loss (n = 74), bromocriptine history (n = 21), poor compliance (n = 2), and self-withdrawal of CAB (n = 2). Of the remaining 635 patients, 62 discontinued CAB medication. Of these, 48 patients withdrew from CAB medication with normal PRL levels under 0.25 to 0.5 mg/week dose of CAB, except for patients who discontinued CAB because of pregnancy (n = 18). Because 4 of 48 patients had invisible pituitary tumors on MRI at the time of CAB withdrawal, a total of 44 patients with minimal remnant tumor size on MRI were included in the final analysis (Fig. 1).
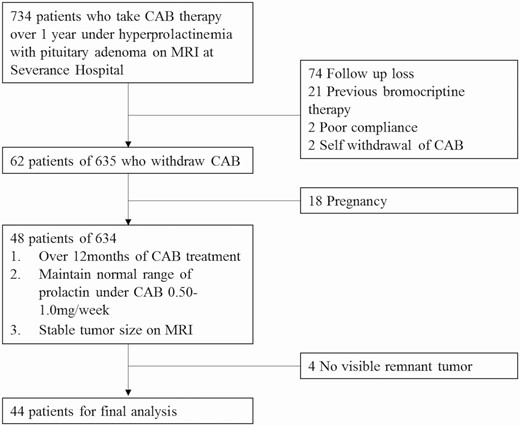
Flow diagram outlining the patient enrollment process. Seven hundred and thirty-four patients taking CAB over 1 year following the diagnosis of prolactinomas were identified. We excluded 120 patients because of the following reasons: previous bromocriptine use (n = 21), follow-up loss (n = 74), poor compliance (n = 2), and self-withdrawal of CAB (n = 2). Out of 635 patients, 48 stopped CAB medication when they maintained normal PRL levels while receiving a 0.25-0.5 mg/week dose of CAB. Finally, 44 patients with visible pituitary tumor remnants were included in the final analysis.
We followed the patients taking CAB medication for 2 to 3 months in the first 6 months and every 6 months thereafter. In this study, 0.5 to 1 mg/week of CAB was administered for microadenomas and 1 to 3 mg/week for macroadenomas, and the dose was titrated according to the tumoral size and PRL levels.
We retrieved clinical data, such as age and gender, from electronic medical records. We also collected information regarding the dose and treatment duration of CAB. We defined the follow-up duration after CAB withdrawal as the time from the cessation of the drug to the last patient visit.
We divided the patients into 2 groups based on the maintenance of normal PRL levels or relapse of hyperprolactinemia after CAB withdrawal.
The study was approved by the ethics committee of our hospital, and the requirement for written informed consent was waived due to the retrospective design of the study (IRB No. 4-2020-0108).
Hormonal assessment
Chemiluminescence immunoassay (Beckman Coulter, Brea, CA, USA) was performed to measure serum PRL levels. The lower limit of detection was 0.25 ng/mL, and the within runs and total coefficients of variation for PRL levels were 3.66% and 3.77%, respectively. Normal PRL levels were determined as 5 to 15 ng/mL and 5 to 25 ng/mL for men and women, respectively. The recurrence of hyperprolactinemia after withdrawing CAB therapy was defined as serum PRL levels higher than the normal range.
MRI evaluation
MRI was performed using 3.0-Tesla (Achieva, Philips Medical Systems, Best, The Netherlands) magnetic resonance (MR) units. Axial T2-weighted, HR coronal T2WI, and delayed gadolinium-enhanced coronal T1-weighted MRI scans were obtained. MRI was performed before and at 3 months, 1 year, 2 years, and biannually after CAB initiation.
All MRI scans were independently reviewed using the Picture Archive Communication System by 2 specialists, and all measurements were taken before analyzing the response to treatment. The maximal diameter of the adenomas was defined on coronal and sagittal planes and measured manually at baseline and drug withdrawal. Pituitary adenomas were classified as microprolactinomas (<10 mm) and macroprolactinomas (≥10 mm) based on the maximal diameter. Tumoral invasions, defined as invasion of 1 or both cavernous sinuses (CSs), were evaluated based on the modified Knosp classification (18, 19). Knosp grade 3 and 4 were classified as having CS invasion, according to a previous meta-analysis (20). The percentile of tumor reduction was calculated as the percentage of (initial maximal diameter–maximal diameter before CAB withdrawal)/initial maximal diameter.
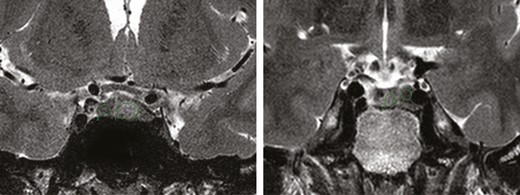
Quantitative measurements were performed by drawing a region of interest (ROI) on the pituitary adenoma and on the adjacent normal pituitary gland on T2-weighted coronal images of each patient. ROIs were oval or circular shaped on 3 contiguous images, and the mean value of three measurements was calculated (Fig. 2). The T2 intensity ratio was defined as the ratio of the mean value of the pituitary adenoma to the normal pituitary gland. Tumors with a T2 intensity ratio of 0.8 or lower were classified as hypointense, 1.2 or higher as hyperintense, and higher than 0.8 to lower than 1.2 as isointense. We compared the T2 intensity ratio on initial and 6-month follow-up MRI between the remission and relapse groups.
Statistical analysis
Values were expressed as medians (range). A Mann–Whitney U test was used for non-normally distributed numeric variables. The Fisher exact test was used to compare categorical data. Interobserver agreement regarding image analysis was evaluated with kappa (κ) statistics and intraclass correlation coefficients (ICCs). Kappa values were indicated as follows: less than 0.20, poor agreement; 0.21 to 0.40, fair agreement; 0.41 to 0.60, moderate agreement; 0.61 to 0.80, good agreement; and greater than 0.81, excellent agreement. ICC results were interpreted according to the following criteria: poor (ICC < 0.50), moderate (ICC = 0.50-0.74), good (ICC = 0.75-0.90), and excellent (ICC > 0.90) (21). We performed a repeated measures analysis of variance to compare the change in T2-weighted signal intensity (WSI) at the initial visit, 3- to 6-month follow-up, and at the time of withdrawal. Differences between groups were analyzed using a nonparametric test. The Wilcoxon signed rank test was used to identify a change in T2-WSI after medication. A binary logistic regression analysis was used to identify independent predictors of biochemical remission after CAB withdrawal. The statistical analyses were performed using SPSS software (version 22; Chicago, IL, USA). P < .05 was considered statistically significant.
Results
Patients characteristics
Table 1 describes the baseline characteristics of the patients included in the study. The median age of 44 patients was 32 (18-58) years at diagnosis. Most patients were women (95.45%). The mean size of the pituitary adenomas was 8.0 (3.00-27.00) mm. Six patients (13.64%) were showed to having CS invasion. In all patients, the median duration of CAB therapy was 32 (12-120) months. The median follow-up duration after CAB withdrawal was 26 (12-97) months, and the last dose before withdrawal was 0.5 (0.18-2.00) mg/week.
Baseline characteristics of the patients in the study.
| Total | Macroadenoma | Microadenoma | P value | |
|---|---|---|---|---|
| N = 44 | N = 11 | N = 33 | ||
| Age at diagnosis (years) | 32.00 (18.00-58.00) | 31.00 (18.00-55.00) | 32.00 (18.00-58.00) | .989 |
| Sex | ||||
| Male (%) | 2 (4.55) | 2 (18.18) | 0 (0.00) | .058 |
| Female (%) | 42 (95.45) | 9 (81.81) | 33 (100.00) | |
| Serum PRL (ng/mL) | ||||
| At diagnosis | 133.79 (52.90-1264.30) | 300.00 (60.50-1264.30) | 115.10 (52.90-460.70) | .000* |
| Before withdrawal | 4.95 (0.25-28.70) | 7.90 (0.30-14.00) | 2.80 (0.30-28.70) | .751 |
| CAB duration (months) | 32.00 (12.00-120.00) | 36.00 (17.00-57.00) | 31.00 (12.00-120.00) | .368 |
| Follow up duration after withdrawal (months) | 26.00 (12.00-97.00) | 27.00 (12.00-97.00) | 23.00 (12.00-75.00) | |
| CAB dose (mg/week) | ||||
| At start | 1.00 (0.50-2.00) | 1.00 (1.00-2.00) | 1.00 (0.50-2.00) | .121 |
| Before withdrawal | 0.50 (0.18-2.00) | 0.50 (0.25-2.00) | 0.50 (0.18-2.00) | .591 |
| Adenoma diameter (mm) | ||||
| Maximal size | 8.00 (3.00-27.00) | 13.50 (10.00-27.00) | 7.50 (3.00-9.60) | .000* |
| Residual size at withdrawal | 5.00 (1.00-12.00) | 7.00 (3.30-12.00) | 5.00 (1.00-9.50) | .006* |
| Percentile change of size (%) | 33.33 (0.00-81.82) | 43.13 (10.00-75.93) | 28.57 (0.00-81.82) | .044* |
| Knosp classification, n (%) | ||||
| 0 | 18 (40.90) | 1 (9.09) | 17 (51.51) | .008* |
| 1 | 16 (36.36) | 4 (36.36) | 12 (36.36) | |
| 2 | 4 (9.09) | 2 (18.18) | 2 (6.06) | |
| 3a | 4 (9.09) | 3 (27.27) | 1 (3.03) | |
| 3b | 1 (2.27) | 0 (00.00) | 1 (3.03) | |
| 4 | 1 (2.27) | 1 (9.09) | 0 (00.00) | |
| T2 intensity ratio at diagnosis, n (%) | ||||
| Hyperintense | 15 (34.10) | 6 (54.5) | 9 (27.27) | |
| Isointense | 23 (52.27) | 5 (45.5) | 18 (54.55) | .158 |
| Hypointense | 6 (13.64) | 0 (0.00) | 6 (18.18) | |
| Remission rate (%) | 33/44 (75) | 7/11 (63.64) | 26/33 (78.79) | .213 |
Statistically significant with P value of .05 or less are indicated with an asterisk and bold.
Ten patients had macroadenomas and 34 had microadenomas at the beginning of CAB treatment. All men in this study had macroadenomas. The mean duration on of CAB treatment was 27 months for macroadenomas and 23 months for microadenomas.
Although the initial PRL level was higher in patients with macroadenomas than in those with microadenomas (300.00 vs 115.10 ng/mL, P < .001), PRL levels just before CAB withdrawal were similar.
Among patients with macroadenoma, the tumor size decreased significantly after CAB treatment. Percentile change in tumoral size was higher (43.13% vs 28.57%, P = .044) and residual tumor size at the time of discontinuing CAB was larger in macroadenomas than in microadenoma (7.00 vs 5.00 mm, P = .005). We performed Fisher’s exact test to compare the distribution of hyper-/iso-/hypointense adenomas depending on the initial tumor size; however, there was no significant difference (P = .158).
The biochemical remission rates were 63.64% and 78.79% for the macroadenoma and microadenoma groups, respectively, during 26 (12-97) months of follow-up. However, overall, there was no difference in the remission rate after CAB withdrawal between the 2 groups.
Comparison of biochemical activity after CAB withdrawal
We compared several parameters between the remission and recurrence groups (Table 2). Only 25% of patients had relapsed hyperprolactinemia at median 6 (3-63) months after CAB withdrawal. Furthermore, 90.9% of the recurrence group had hyperprolactinemia within 12 months after CAB withdrawal. Between patients in the remission and recurrence groups, there was no difference in age (33 vs 30 years), duration of CAB medication (32 vs 37 months), follow-up duration after withdrawal (23 vs 27 months), CAB dose at initiation (1.00 vs 1.00 mg/week) and at the time of withdrawal (0.5 vs 0.35 mg/week), maximal tumor size (7.50 vs 9.50 mm), and residual tumor size at withdrawal of CAB (5.00 vs 7.00 mm).
Comparison of biochemical remission after CAB withdrawal.
| Remission | Recurrence | P value | |
|---|---|---|---|
| N = 33 | N = 11 | ||
| Age at diagnosis (years) | 33.00 (20.00-58.00) | 30.00 (18.00-47.00) | .111 |
| Sex | |||
| Male (%) | 2 (6.06) | 0 (0.00) | 1.000 |
| Female (%) | 31 (93.94) | 11 (100.00) | |
| Serum PRL (ng/mL) | |||
| At diagnosis | 124.80 (52.90-1264.30) | 189.10 (86.50-893.20) | .014* |
| Before withdrawal | 4.60 (0.25-28.70) | 8.80 (0.60-12.40) | .295 |
| CAB duration (months) | 32.00 (12.00-120.00) | 37.00 (19.00-53.00) | 1.000 |
| Follow up duration after withdrawal (months) | 23.00 (12.00-75.00) | 27.00 (17.00-97.00) | .437 |
| CAB dose (mg/week) | |||
| At start | 1.00 (0.50-2.00) | 1.00 (0.50-2.00) | .612 |
| Before withdrawal | 0.50 (0.18-2.00) | 0.35 (0.25-1.00) | .453 |
| Adenoma diameter (mm) | |||
| Maximal size | 7.50 (3.00-27.00) | 9.50 (4.00-20.00) | .259 |
| Residual size at withdrawal | 5.00 (1.00-10.00) | 7.00 (3.00-12.00) | .130 |
| Percentile change of size (%) | 33.33 (0.00-81.82) | 20.00 (00.00-60.00) | .321 |
| Knosp classification, n (%) | |||
| 0 | 15 (45.45) | 3 (27.27) | .019* |
| 1 | 13 (39.39) | 3 (27.27) | |
| 2 | 3 (9.09) | 1 (9.09) | |
| 3a | 0 (00.00) | 4 (36.36) | |
| 3b | 1 (3.03) | 0 (00.00) | |
| 4 | 1 (3.03) | 0 (00.00) | |
| T2 intensity ratio at diagnosis, n (%) | |||
| Hyperintense | 12 (36.40) | 3 (27.27) | .892 |
| Isointense | 17 (51.52) | 6 (54.55) | |
| Hypointense | 4 (12.12) | 2 (18.18) |
Statistically significant with P value of .05 or less are indicated with an asterisk and bold.
Distribution of Knosp classification was different between the remission and recurrence groups. There were more patients with CS invasion at diagnosis in the recurrence group than in the remission group (36.36% vs 6.06%; P = .027). PRL levels at diagnosis were significantly higher in the recurrence group than in the remission group: 189.10 (86.50–893.20) vs 124.80 (52.90–1264.30) ng/mL (P = .014). However, there was no difference in tumor size at CAB initiation and withdrawal. The T2 intensity ratio at diagnosis on MRI was not significantly different between the 2 groups.
Change in the T2 intensity ratio and biochemical activity after CAB withdrawal
We performed a repeated measures analysis of variance to identify if CAB affected the T2 intensity ratio for 6 months in all the patients and if there was a difference in the T2 intensity ratio between the recurrence and remission groups.
CAB administration did not significantly change the T2 intensity ratio for 6 months in all the patients (F(1, 33) = 2.491, P = .124). However, there was a significant difference in the T2 intensity ratio with respect to treatment interaction, implying that the treatment effect was different between the recurrence and the remission groups (F(1, 33) = 4.783, P = .036).
The T2 intensity ratio was significantly decreased after 6 months of CAB therapy in the remission group (Z = 2.03, signed rank = 292, P = .043) but not in the recurrence group (signed rank = 9, P = .469) (Fig. 3).
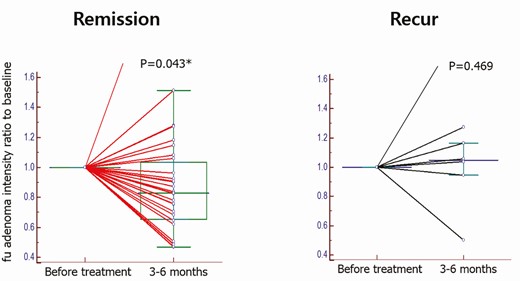
Change in T2-WSI after a 6-month follow-up for the recurrence and remission groups. The T2 intensity ratio in the remission group significantly decreased after 6 months of treatment (Z = 2.03, signed rank = 292, P = .043), but not in the recurrence group (signed rank = 9, P = .469).
Predictors for biochemical recurrence after CAB withdrawal
We used a binary logistic regression model for predicting biochemical recurrence after CAB withdrawal (Table 3). The presence of CS invasion at diagnosis increased the recurrence rate with adjustment for the age at diagnosis and sex (model2, P = .016) and additional adjustment for percentile shrinkage of the pituitary tumor (Model 3, P = .012). In model 1, initial CS invasion augmented biochemical recurrence rate by 11.3% (P = .023).
CS invasion at diagnosis for predicting biochemical recurrence after CAB withdrawal.
| Odds ratio (95% CI) | P value | |
|---|---|---|
| Model 1 (CS invasion) | 0.113 (0.017-0.744) | .023* |
| Model 2 (CS invasion, age, sex) | 0.041 (0.003-0.555) | .016* |
| Model 3 (Model 2 + Shrinkage(%)) | 0.020 (0.001-0.423) | .012* |
| Odds ratio (95% CI) | P value | |
|---|---|---|
| Model 1 (CS invasion) | 0.113 (0.017-0.744) | .023* |
| Model 2 (CS invasion, age, sex) | 0.041 (0.003-0.555) | .016* |
| Model 3 (Model 2 + Shrinkage(%)) | 0.020 (0.001-0.423) | .012* |
Statistically significant with P value of .05 or less are indicated with an asterisk and bold.
Discussion
In this study, we found that the remission rate for 44 patients with a remnant pituitary tumor on MRI before CAB withdrawal was 75% over 26 (12-97) months. The biochemical remission rate was similar between patients with macroadenomas and those with microadenomas. The T2 intensity ratio significantly decreased 6 months after CAB therapy only in the remission group. Moreover, CS invasion at diagnosis was the only unfavorable predictor of long-term remission.
The recent Endocrine Society Clinical Practice Guideline recommends that for patients who after 2 years of therapy have achieved normal PRL levels and no visible tumor remnant and for whom DAs have been tapered or stopped. This guideline was based on the meta-analysis by Dekkers et al. that showed that longer treatment duration was associated with withdrawal success (6). Another meta-analysis suggested that tapering the lowest CAB dose before withdrawal is critical for successful drug withdrawal (22). One recent systematic review that included 24 studies and more than 1100 patients treated with either bromocriptine or CAB reported that the probability of success was higher in patients who received low-dose CAB maintenance treatment and those who achieved a significant reduction in tumor size before withdrawal (23). In a previous study, although patients with no visible tumor had a lower rate of recurrent hyperprolactinemia than those with visible tumors, 59% of patients with small remnant microadenomas and 23% of those with small remnant macroadenomas maintained normoprolactinemia after discontinuing CAB (9). In another study, although the larger size of the remnant tumor showed higher recurrence, there was no difference in the aspects of recurrence rate between patients with and without visible tumor remnants (50% vs 53.8%) (10). Our data showed that the remission rates were 63.64% for macroadenomas and 78.79% for microadenomas. These suggested that the remnant lesions on MRI could be nonfunctioning tumors or fibrotic scars. Therefore, guidelines for CAB discontinuation are needed for patients with remnant pituitary tumors.
The remission rate was 37% after DA withdrawal among all patients and 7.2% to 74.1% for those who underwent CAB withdrawal only (23). The biochemical remission rate after CAB withdrawal was 75% over 26 (12-97) months in our study, which is superior to those in previous studies. Only patients who underwent CAB treatment for more than 12 months were included. Overall, oral CAB was started at a low dose (1-1.5 mg/week), and the dose was gradually increased to 1.5 to 4 mg/week within 2 to 4 weeks. The latter dosage was maintained for 3 months after treatment initiation to ensure a sufficient period of exposure to CAB. Evaluations of treatment response were performed after 3 months, and the dose of CAB and follow-up interval were continuously adjusted in consideration of response, tolerance, and other clinical indicators (24, 25). Previous studies have reported that a significant reduction in the size of a pituitary adenoma on MRI in the first 3 months after treatment was significantly correlated with long-term tumoral response in patients with prolactinomas (24). Therefore, we performed surgical resection if the tumor size did not decrease in the first 3 months after CAB therapy. As patients who underwent surgery were excluded from our study, the response rate was considered to be higher than those in other studies.
CS invasion at diagnosis was the only effective unfavorable predictor of long-term remission after drug withdrawal. Statistically this is meaningful, but in the case of CS invasion the recurrence rate increased minimally; therefore, it is difficult to claim that there was clinical significance. CS invasion is strongly associated with hormonal resistance to DAs (26). A residual tumor within the CS can continue to cause endocrinological symptoms that necessitate further treatment such as pharmacological therapy or radiotherapy (27, 28). In many studies regarding DA discontinuation, analyses were not conducted according to the presence of CS invasion or patients with CS invasion were excluded from the studies. We believe that additional studies are needed on this aspect.
Previous studies support the use of T2-weighted intensity on MRI as a tool for treatment stratification in acromegaly (29). T2 hypointense somatotroph tumors are smaller, more secreting, and less invasive than hyperintense somatotroph tumors, and they present as a densely granulated pattern on electron microscopy and show a favorable response to somatostatin analogs (30). In this context, several studies have progressed to reveal the association between clinical and MRI characteristics in patients with prolactinomas; however, the results have been inconclusive. In a study, T2 signal at diagnosis could be used as a negative predictor of response to DAs in heterogeneous prolactinomas but not in homogeneous prolactinomas (31).
It is difficult to accurately confirm CS invasion only with image findings without surgical confirm. Therefore there is a limitation to inferring CS invasion based on MRI findings because this study targeted patients who only took medical treatment. We used Knosp classification based on MRI findings to identify CS invasion. A pooled meta-analysis demonstrated that the radiographic inferolateral venous compartment obliteration and Knosp grade 3 to 4 tumors have the highest correlation with intraoperative cavernous sinus invasion (CSI) and the lowest correlation with gross-total resection (20). According to this meta-analysis, Knosp grade 3 and 4 were classified as having CS invasion in this study.
In our study, although the CAB response was not correlated with the status of T2 hypo/iso/hyperintensity on MRI, the T2 intensity ratio tended to show a decrease at the 6-month follow-up MRI after CAB therapy only in the remission group. Previous studies found that low signal intensity areas appearing 1 to 4 months after treatment can predict pronounced tumor shrinkage after CAB therapy, and marked reduction of tumoral size reflects favorable response to DAs (24, 32). Our data and previous studies support the conclusion that change in T2 intensity in the early phase of CAB therapy is valuable for assessing CAB treatment.
In this study, the change in T2 intensity on MRI of prolactinomas was correlated with biochemical remission after drug discontinuation only when the change occurred at the beginning of the treatment, but there was no correlation for changes that occurred at the end of drug therapy. While using CAB, the tumors do not simply become small, but they continuously undergo cystic or hemorrhagic changes. Therefore, at the end of the treatment, the properties of the tumor become heterogeneous, thereby affecting the significance of T2 intensity. There have been attempts to analyze the heterogeneity of pituitary tumors after DA therapy; however, the correlation between heterogeneity and remission after DA withdrawal has not been confirmed (31).
This study had some limitations. The patients were not homogeneous in terms of CAB dose, treatment duration, and radiological assessment, and the follow-up duration varied from 12 to 97 months, which could result in attrition bias. However, we deemed this observational period to be sufficiently long considering that over 90% of patients in the recurrence group had a confirmed relapse within 12 months. The number of participants in the study was not considered small because of the prevalence of prolactinomas and the recent clinical guideline that recommends that patients with no visible tumors discontinue medication.
Even though many studies have analyzed the T2 signal intensities of pituitary adenomas, the definitions for signal intensity varied across studies without a uniform standard.
Firstly, different landmarks were used in previous studies. The T2 signal intensity of the solid portion was visually compared with those of both the cerebral gray and white matter in the adjacent temporal lobe in some studies (33, 34). Some studies compared the intensities of adenomas with those of only white matter, while others made only a comparison with the intensity of the gray matter (31, 35, 36). Other studies used the T2 signal intensity of the normal pituitary gland, and not the temporal lobe, as a landmark (37, 38). In this study, we compared the T2 signal intensity of the adenoma with the T2 signal intensity of the adjacent normal pituitary tissue. Secondly, the criteria for classifying adenomas according to T2 signal intensity–adjusted landmarks were also defined differently by researchers. We tried to find a statistical cutoff value for classification; however, we were unable to do this because of our small sample size. Therefore, we defined “hypointense” as relative T2 intensity ratio less than or equal to 0.8 and “hyperintense” as a relative T2 intensity ration greater or equal to 1.2. Otherwise, the tumor was classified as “isointense.” We believed these differences of 0.2 in intensity could be discriminated by the radiologists. We believe that a uniform landmark and classification are necessary for analyzing T2 signal intensity.
In conclusion, initial CS invasion events may be the unfavorable predictor for remission after discontinuing CAB therapy in patients with remnant pituitary tumors identified on MRI. Assessing the change in the T2 signal intensity ratio is useful to predict which patients can achieve biochemical remission. We await further studies in large and diverse populations to clarify the predictors for remission of hyperprolactinemia following CAB discontinuation with visible remnant prolactinomas.
Abbreviations
- CAB
cabergoline
- CS
cavernous sinus
- DA
dopamine agonist
- ICC
intraclass correlation coefficient
- MRI
magnetic resonance imaging
- PRL
prolactin
- ROI
region of interest
Acknowledgments
We would like to thank Editage (www.editage.co.kr) for English language editing.
Financial Support: This study was supported by the Bio and Medical Technology Development Program of the National Research Foundation (NRF) and received funding from the Korean Government (MSIP and MOHW; No. NRF-2017M3A9E8029720).
Additional Information
Disclosure Statement: The author declares that there is no conflict of interest.
Data Availability
All datasets generated during and/or analyzed during the current study are not publicly available but are available from the corresponding author on reasonable request.
References
