


Abstract
Background. During the 2012–2013 influenza season, there was cocirculation of influenza A(H3N2) and 2 influenza B lineage viruses in the United States.
Methods. Patients with acute cough illness for ≤7 days were prospectively enrolled and had swab samples obtained at outpatient clinics in 5 states. Influenza vaccination dates were confirmed by medical records. The vaccine effectiveness (VE) was estimated as [100% × (1 − adjusted odds ratio)] for vaccination in cases versus test-negative controls.
Results. Influenza was detected in 2307 of 6452 patients (36%); 1292 (56%) had influenza A(H3N2), 582 (25%) had influenza B/Yamagata, and 303 (13%) had influenza B/Victoria. VE was 49% (95% confidence interval [CI], 43%–55%) overall, 39% (95% CI, 29%–47%) against influenza A(H3N2), 66% (95% CI, 58%–73%) against influenza B/Yamagata (vaccine lineage), and 51% (95% CI, 36%–63%) against influenza B/Victoria. VE against influenza A(H3N2) was highest among persons aged 50–64 years (52%; 95% CI, 33%–65%) and persons aged 6 months–8 years (51%; 95% CI, 32%–64%) and lowest among persons aged ≥65 years (11%; 95% CI, −41% to 43%). In younger age groups, there was evidence of residual protection from receipt of the 2011–2012 vaccine 1 year earlier.
Conclusions. The 2012–2013 vaccines were moderately effective in most age groups. Cross-lineage protection and residual effects from prior vaccination were observed and warrant further investigation.
Seasonal influenza vaccine effectiveness (VE) has been estimated every season since 2004–2005 in the United States [1–4]. Interim VE estimates from the US Flu VE Network during the first 4 weeks of the 2012–2013 influenza season suggested that vaccination was moderately effective against influenza-related outpatient visits in children and working-age adults [5, 6]. The 2012–2013 influenza season was notable for higher morbidity and mortality than previous seasons, with simultaneous cocirculation of influenza A(H3N2), influenza B/Yamagata, and influenza B/Victoria in the United States. The precision of type- and subtype-specific VE estimates in the interim report was limited because of the short enrollment period. The greater number of patients with influenza during the entire season allowed us to examine VE by type and subtype in different age groups and to perform stratified analyses for inactivated vaccines and live attenuated vaccine. For this full-season report, we estimated VE against influenza A(H3N2), influenza B/Yamagata (vaccine lineage), and influenza B/Victoria (nonvaccine lineage) by vaccine type and age group. We also assessed the impact of prior vaccination history on vaccine protection, because recent reports have suggested that VE may be affected by prior season vaccination [4, 7–12].
METHODS
Details of the US Flu VE Network design, sites, and enrollment procedures have been described previously [4]. Briefly, during the 2012–2013 influenza season, patients aged ≥6 months seeking outpatient medical care for an acute respiratory illness (ARI) with cough were recruited at outpatient clinics in Marshfield, Wisconsin; southeastern Michigan (Ann Arbor and Detroit); Temple-Belton, Texas; Seattle, Washington; and Pittsburgh, Pennsylvania. Patients meeting the symptom criteria were eligible if the duration of illness was ≤7 days and they had not received antiviral medication before enrollment. Recruitment and sample collection were performed by study personnel at each site. Recruitment was not influenced by the diagnosis of the treating physician.
Consenting patients or their parents/guardians completed an enrollment interview to ascertain patient demographic characteristics, symptoms, onset date, and subjective assessments of general health and current health status. History of chronic medical conditions was determined on the basis of International Classification of Diseases, Ninth Revision (ICD-9), diagnosis codes from the electronic medical record. Patients were considered high risk if they had a healthcare encounter resulting in an ICD-9 code corresponding to a high-risk condition during the year before enrollment [13].
Nasal and throat specimens (for children age <2 years, only nasal specimens were obtained) were collected by swabbing and combined for influenza testing at network laboratories, using real-time reverse transcription polymerase chain reaction (RT-PCR) as previously described [4]. Viruses isolated from a sample of specimens positive for influenza A(H3N2) by RT-PCR were antigenically characterized by hemagglutination inhibition with a set of reference postinfection ferret antisera. Antigenic similarity was assessed relative to the cell-grown reference vaccine virus A/Victoria/361/2011. In addition, genotyping was performed by sequencing the HA, neuraminidase, and matrix genes on a subset of influenza A(H3N2) viruses as previously described [14].
Estimation of VE
Influenza VE was assessed using a test-negative case-control design [15–17]. Cases were defined as persons with a medically attended ARI confirmed as influenza by RT-PCR. Controls were persons with a medically attended ARI who tested negative for influenza virus. The analysis was limited to patients who were enrolled during periods of influenza virus circulation at each site. We excluded controls with symptom onset before the first date or after the last date of symptom onset among influenza cases at each network site.
The primary exposure of interest was medical record/registry documented receipt of current-season influenza vaccine. Persons aged ≥9 years were considered vaccinated, given documented receipt of at least 1 dose of current-season (2012–2013) vaccine ≥14 days before illness onset. Children aged 6 months through 8 years were considered vaccinated if they received the number of doses recommended by the Advisory Committee on Immunization Practices (ACIP) for 2012–2013, based on their documented vaccination history [18]. Those who were vaccinated within 14 days of illness onset or vaccinated but did not receive all of the ACIP-recommended doses were excluded from the main analysis. Those without documented evidence of vaccine receipt and those vaccinated after illness onset were considered unvaccinated. For the 2012–2013 season, the northern hemisphere vaccine included the influenza A(H3N2) component A/Victoria/361/(2011), the influenza A(H1N1) component A/California/07/(2009), and the influenza B component B/Wisconsin/01/(2010)/Yamagata; the influenza A(H3N2) and influenza B components were different from those in the vaccine from the prior influenza season [19].
We also estimated VE for all combinations of vaccine exposure in the current and prior season (2012–2013 and 2011–2012, respectively) among patients aged ≥9 years who have been in their current health system for at least the past year. We excluded children aged <9 years from this analysis because the criteria for being considered appropriately vaccinated in this age group were based on influenza vaccination history in prior seasons. The 4 vaccine exposure groups were (1) vaccinated in both the current and prior season, (2) vaccinated in the current season only, (3) vaccinated in the prior season only, and (4) not vaccinated in either the current or prior season (reference group). Patients vaccinated with unknown vaccine types or vaccine types other than trivalent inactivated influenza vaccine (IIV3) in the current season were excluded from analyses that included prior season vaccination.
Logistic regression models were used to estimate odds ratios (ORs) comparing vaccinated (including joint current and prior vaccine exposure) and unvaccinated subjects; VE was calculated as 100% × [1 − OR]. We generated separate VE estimates for influenza overall, influenza A(H3N2), influenza B/Yamagata, and influenza B/Victoria outcomes. VE estimates were generated for all licensed vaccines, IIV3, and trivalent live attenuated influenza vaccine (LAIV3). VE was not calculated for 2009 pandemic influenza A(H1N1) strain (A[H1N1]pdm09) because of the low number of cases (n = 52). Estimates for LAIV3 VE were restricted to children aged 2–17 years because LAIV3 use was low in adults.
Age, network site, high-risk health status, and calendar time (modeled as a series of dichotomous variables representing 2-week intervals) were included in all adjusted VE models a priori. Age in years was modeled using linear tail-restricted cubic spline functions with 5 knots based on percentiles. Other potential confounders (eg, sex, race/ethnicity, reported general health, and number of children in the household) were assessed but were not included in the adjusted (simple) model because the covariate did not change the VE estimate by >5% [20]. A difference in VE of ≤5% was not considered meaningful. For age group–specific estimates, we used stratified models with data in only the range of the age group of interest (age 6 months–8 years, 9–17 years, 18–49 years, 50–64 years, and ≥65 years). Age was modeled as a linear term in the age-specific models. For comparison with prior season estimates, we also generated a fully adjusted VE model that included additional covariates (including those that did not change the VE estimate by >5%). These included age, sex, race/ethnicity, high-risk health status, reported general health, interval (in days) between illness onset and specimen collection, and calendar time [4].
To better understand the relationship between age and VE, we calculated VE by single year of age. In these models, we used data from ages 1 through 75 years and included an interaction term between the age and current-season vaccination status. Ages of <1 and >75 years were not included in this analysis because of the sparse data. Age was represented as a restricted cubic spline function with 5 knots based on percentiles.
VE was also estimated using 2 alternative means of representing vaccination status: by incorporating self-reported status with medical record/registry documentation and by using self-report only.
Statistical analyses were conducted using SAS statistical software (version 9.3; SAS Institute, Cary, North Carolina). P values of < .05 or a 95% confidence interval (CI) excluding 0% for VE was considered statistically significant. Adjusted estimates were not reported if the validity of the model fit was questionable.
RESULTS
Participant Characteristics
From December 2012 through early April 2013, we enrolled 6766 patients with medically attended ARI; the peak enrollment of cases occurred in January. Among those enrolled, 314 (5%) were excluded from analysis of VE because of inconclusive RT-PCR test results (n = 16), negative results with illness onset outside the period when cases were identified at each site (n = 43), receipt of vaccine <14 days from onset (n = 68), receipt of an invalid vaccine dose (n = 1), and incomplete vaccination status, based on ACIP recommendations for children <9 years old (n = 186).
Of the 6452 patients included in the analysis, 2307 (36%) were influenza virus positive, including 1381 (60%) infected with influenza A virus and 933 (40%) infected with influenza B virus. Among cases where influenza virus subtype/lineage could be determined, 1292 were influenza A(H3N2), 52 were A/H1N1pdm09, 582 were influenza B/Yamagata, and 303 were influenza B/Victoria. Ten patients had virus coinfections: 7 were positive for both influenza A and B virus, and 3 were positive for both B virus lineages.
Median age was 28 years (interquartile range [IQR], 9–50 years) for case patients and 30 years (IQR, 10–51 years) for control patients (P = .2, by the Wilcoxon rank sum test). Among case patients, the median age was 34 years, 14 years, and 12 years among those infected with influenza A(H3N2), influenza B/Yamagata, and influenza B/Victoria, respectively. Compared with control patients, case patients were less likely to have a high-risk condition and more likely to report their general health as excellent; however, reported current health (at the time of enrollment) was rated lower by case patients (Table 1). There was a higher proportion of females among individuals with influenza, and those with influenza were more likely to live in the same household with ≥2 children (age <12 years), compared with controls. Patients with influenza and control patients did not differ significantly by race/ethnicity, obesity status, or household exposure to smoke. The median time from onset to enrollment was 3 days for both groups.
Descriptive Characteristics of Enrolled Patients With Medically Attended Acute Respiratory Illness, by Case Status
| Characteristic | Any Influenza Virus Detecteda,b,c,d,e (n = 2307) | Influenza A(H3N2) Detectedb,c (n = 1292) | Influenza B/Yamagata Detectedc,d,e (n = 582) | Influenza B/Victoria Detectede (n = 303) | No Influenza Virus Detected (n = 4145) |
|---|---|---|---|---|---|
| Site | |||||
| Michigan | 527 (23) | 255 (20) | 232 (40) | 19 (6) | 781 (19) |
| Pennsylvania | 371 (16) | 267 (21) | 48 (8) | 28 (9) | 752 (18) |
| Texas | 432 (19) | 220 (17) | 154 (26) | 43 (14) | 930 (22) |
| Washington | 219 (9) | 174 (13) | 6 (1) | 6 (2) | 913 (22) |
| Wisconsin | 758 (33) | 376 (29) | 142 (24) | 207 (68) | 769 (19) |
| Age | |||||
| 6 mo–8 y | 555 (24) | 242 (19) | 177 (30) | 118 (39) | 954 (23) |
| 9–17 y | 420 (18) | 178 (14) | 146 (25) | 72 (24) | 561 (14) |
| 18–49 y | 739 (32) | 478 (37) | 143 (25) | 73 (24) | 1528 (37) |
| 50–64 y | 370 (16) | 228 (18) | 91 (16) | 20 (7) | 670 (16) |
| ≥65 y | 223 (10) | 166 (13) | 25 (4) | 20 (7) | 432 (10) |
| Sex | |||||
| Female | 1290 (56) | 752 (58) | 293 (50) | 161 (53) | 2508 (61) |
| Male | 1017 (44) | 540 (42) | 289 (50) | 142 (47) | 1637 (39) |
| Race/ethnicity | |||||
| White, non-Hispanic | 1754 (76) | 1006 (78) | 387 (66) | 256 (84) | 3112 (75) |
| Black, non-Hispanic | 189 (8) | 94 (7) | 80 (14) | 5 (2) | 323 (8) |
| Hispanic | 175 (8) | 83 (6) | 58 (10) | 28 (9) | 366 (9) |
| Other, non-Hispanic | 185 (8) | 106 (8) | 56 (10) | 14 (5) | 335 (8) |
| Unknown | 4 (0.1) | 3 (0.2) | 1 (0.2) | 0 | 9 (0.2) |
| High-risk conditionf | |||||
| Any | 737 (32) | 467 (36) | 163 (28) | 76 (25) | 1452 (35) |
| Asthma/pulmonary | 387 (17) | 243 (19) | 79 (14) | 48 (16) | 872 (21) |
| Cardiovascular | 202 (9) | 146 (11) | 32 (6) | 13 (4) | 409 (10) |
| Diabetes | 168 (7) | 113 (9) | 33 (6) | 16 (5) | 310 (7) |
| Other | 232 (10) | 150 (12) | 51 (9) | 18 (6) | 469 (11) |
| None | 1570 (68) | 825 (64) | 419 (72) | 227 (75) | 2693 (65) |
| Morbid obesity, BMI ≥40 | |||||
| Yes | 153 (7) | 102 (8) | 31 (5) | 12 (4) | 281 (7) |
| No | 2077 (90) | 1147 (89) | 527 (91) | 288 (95) | 3678 (89) |
| Missing | 77 (3) | 43 (3) | 24 (4) | 3 (1) | 186 (4) |
| Influenza vaccination status | |||||
| 2012–2013g | |||||
| Received IIV3 | 667 (29) | 444 (34) | 111 (19) | 83 (27) | 1735 (42) |
| Received LAIV | 65 (3) | 29 (2) | 19 (3) | 10 (3) | 157 (4) |
| Received other/unknown type | 63 (3) | 45 (3) | 8 (1) | 5 (2) | 190 (5) |
| None | 1512 (66) | 774 (60) | 444 (76) | 205 (68) | 2063 (50) |
| 2011–2012h | |||||
| Received any | 808 (35) | 500 (39) | 164 (28) | 104 (34) | 1860 (45) |
| Received none | 1499 (65) | 792 (61) | 418 (72) | 199 (66) | 2285 (55) |
| Interval from onset to enrollment | |||||
| <3 d | 977 (42) | 565 (44) | 245 (42) | 119 (39) | 1354 (33) |
| 3–4 d | 912 (40) | 498 (39) | 232 (40) | 126 (42) | 1728 (42) |
| 5–7 d | 418 (18) | 229 (18) | 105 (18) | 58 (19) | 1063 (26) |
| Reported general health status | |||||
| Excellent | 903 (39) | 455 (35) | 256 (44) | 143 (47) | 1336 (32) |
| Very good | 801 (35) | 458 (35) | 202 (35) | 100 (33) | 1510 (36) |
| Good | 479 (21) | 301 (23) | 100 (17) | 45 (15) | 986 (24) |
| Fair/poor | 124 (5) | 78 (6) | 24 (4) | 15 (5) | 309 (7) |
| Missing | 0 | 0 | 0 | 0 | 4 (0.1) |
| Household exposure to smoke | |||||
| Yes | 250 (11) | 142 (11) | 62 (11) | 37 (12) | 464 (11) |
| No | 2042 (89) | 1141 (88) | 516 (89) | 264 (87) | 3665 (88) |
| Missing | 15 (0.7) | 9 (0.7) | 4 (0.7) | 2 (0.7) | 16 (0.4) |
| Household members, no. | 4 (2–5) | 3 (2–4) | 4 (3–5) | 4 (3–5) | 3 (2–4) |
| Children aged <12 y in household, no. | |||||
| 0 | 1075 (47) | 709 (55) | 199 (34) | 95 (31) | 2146 (52) |
| 1 | 499 (22) | 243 (19) | 166 (29) | 67 (22) | 877 (21) |
| ≥2 | 733 (32) | 340 (26) | 217 (37) | 141 (47) | 1122 (27) |
| Reported current health assessmenti | 50 (40–70) | 50 (40–70) | 50 (40–70) | 50 (40–70) | 60 (45–75) |
Data are no. (%) of patients or median value (interquartile range).
Abbreviations: ACIP, Advisory Committee on Immunization Practices; BMI, body mass index; IIV3, trivalent inactivated influenza vaccine; LAIV, trivalent live attenuated influenza vaccine.
a Includes 52 cases infected with 2009 pandemic influenza A(H1N1), 36 infected with influenza A for which subtype data were not available, and 50 infected with influenza B for which lineage data were not available.
b Includes 5 cases coinfected with influenza A(H3N2) and influenza B/Yamagata.
c Includes 1 case coinfected with influenza A(H3N2) and influenza B (lineage not available).
d Includes 1 case coinfected with influenza A (subtype not available) and influenza B/Yamagata.
e Includes 3 cases coinfected with influenza B/Yamagata and influenza B/Victoria.
f Presence of ≥1 medical-record-documented high-risk codes in prior year, as defined by the ACIP guidance for conditions that increase the risk for complications from influenza.
g Medical record and/or immunization registry documentation of receipt of ≥1 dose of 2012–2013 influenza vaccine (for persons aged ≥9 years) or receipt of the number of doses of 2012–13 influenza vaccine recommended by the ACIP (for persons aged 6 months through 8 years) ≥14 days before illness onset.
h Medical record and/or immunization registry documentation of receipt of ≥1 dose of 2011–2012 influenza vaccine.
i The validated EQ-5D health ruler [21] was used to assess patient health on the day of enrollment. Data are presented on a scale of 1 (worst) to 100 (best).
There were 2877 patients (45%) with documented current-season influenza vaccine receipt ≥14 days before symptom onset. Of these, 83% received IIV3, 8% received LAIV3, <1% received intradermal or intramuscular high-dose vaccine, and 8% had an unknown vaccine type. LAIV3 accounted for 126 vaccines (19%) administered to enrolled children aged <9 years. Vaccine coverage was lowest among adolescents and among adults aged <50 years old and highest among adults aged ≥65 years (Table 2). Compared with unvaccinated participants, vaccinated individuals were more likely to be female; to be white, non-Hispanic; to have a high-risk condition; to have no children aged <12 years in the household; and to have household exposure to cigarette smoke. Vaccinated individuals were less likely to report their general health status as excellent. The median time to enrollment was 3 days from onset for both vaccinated and unvaccinated patients.
Descriptive Characteristics of Enrolled Patients With Medically Attended Acute Respiratory Illness, by Vaccination Status for the Current (2012–2013) and Previous (2011–2012) Influenza Seasons
| Characteristic | Patients, No. | Current Season | Current and Previous Seasonsa,b | ||||
|---|---|---|---|---|---|---|---|
| Vaccinateda | Not Vaccinated | Vaccinated Both Seasonsa,b | Vaccinateda Current Season Only | Vaccinatedb Previous Season Only | Not Vaccinated Either Season | ||
| Site | |||||||
| Michigan | 1308 | 514 (39) | 794 (61) | 364 (28) | 150 (11) | 152 (12) | 642 (49) |
| Pennsylvania | 1123 | 542 (48) | 581 (52) | 300 (27) | 242 (22) | 111 (10) | 470 (42) |
| Texas | 1362 | 484 (36) | 878 (64) | 296 (22) | 188 (14) | 118 (9) | 760 (56) |
| Washington | 1132 | 618 (55) | 514 (45) | 465 (41) | 153 (14) | 115 (10) | 399 (35) |
| Wisconsin | 1527 | 719 (47) | 808 (53) | 578 (38) | 141 (9) | 169 (11) | 639 (42) |
| Age | |||||||
| 6 mo–8 y | 1509 | 674 (45) | 835 (55) | 529 (35) | 145 (10) | 228 (15) | 607 (40) |
| 9–17 y | 981 | 328 (33) | 653 (67) | 213 (22) | 115 (12) | 117 (12) | 536 (55) |
| 18–49 y | 2267 | 844 (37) | 1423 (63) | 482 (21) | 362 (16) | 195 (9) | 1228 (54) |
| 50–64 y | 1040 | 552 (53) | 488 (47) | 378 (36) | 174 (17) | 80 (8) | 408 (39) |
| ≥65 y | 655 | 479 (73) | 176 (27) | 401 (61) | 78 (12) | 45 (7) | 131 (20) |
| Sex | |||||||
| Female | 3798 | 1786 (47) | 2012 (53) | 1220 (32) | 566 (15) | 393 (10) | 1619 (43) |
| Male | 2654 | 1091 (41) | 1563 (59) | 783 (30) | 308 (12) | 272 (10) | 1291 (49) |
| Race/ethnicity | |||||||
| White, non-Hispanic | 4866 | 2284 (47) | 2582 (53) | 1604 (33) | 680 (14) | 458 (9) | 2124 (44) |
| Black, non-Hispanic | 512 | 160 (31) | 352 (69) | 101 (20) | 59 (12) | 61 (12) | 291 (57) |
| Hispanic | 541 | 202 (37) | 339 (63) | 130 (24) | 72 (13) | 73 (13) | 266 (49) |
| Other, non-Hispanic | 520 | 229 (44) | 291 (56) | 167 (32) | 62 (12) | 72 (14) | 219 (42) |
| Unknown | 13 | 2 (15) | 11 (85) | 1 (8) | 1 (8) | 1 (8) | 10 (77) |
| High-risk conditionc | |||||||
| Any | 2189 | 1284 (59) | 905 (41) | 970 (44) | 314 (14) | 200 (9) | 705 (32) |
| Asthma/pulmonary | 1259 | 732 (58) | 527 (42) | 539 (43) | 193 (15) | 119 (9) | 408 (32) |
| Cardiovascular | 611 | 415 (68) | 196 (32) | 328 (54) | 87 (14) | 44 (7) | 152 (25) |
| Diabetes | 478 | 309 (65) | 169 (35) | 247 (52) | 62 (13) | 43 (9) | 126 (26) |
| Other | 701 | 467 (67) | 234 (33) | 369 (53) | 98 (14) | 56 (8) | 178 (25) |
| None | 4263 | 1593 (37) | 2670 (63) | 1033 (24) | 560 (13) | 465 (11) | 2205 (52) |
| Morbid obesity, BMI ≥40 | |||||||
| Yes | 434 | 201 (46) | 233 (54) | 141 (32) | 60 (14) | 39 (9) | 194 (45) |
| No | 5755 | 2577 (45) | 3178 (55) | 1793 (31) | 784 (14) | 602 (10) | 2576 (45) |
| Missing | 263 | 99 (38) | 164 (62) | 69 (26) | 30 (11) | 24 (9) | 140 (53) |
| Interval from onset to enrollment | |||||||
| <3 d | 2331 | 1013 (43) | 1318 (57) | 674 (29) | 339 (15) | 224 (10) | 1094 (47) |
| 3–4 d | 2640 | 1165 (44) | 1475 (56) | 823 (31) | 342 (13) | 291 (11) | 1184 (45) |
| 5–7 d | 1481 | 699 (47) | 782 (53) | 506 (34) | 193 (13) | 150 (10) | 632 (43) |
| Reported general health status | |||||||
| Excellent | 2239 | 906 (40) | 1333 (60) | 649 (29) | 257 (11) | 264 (12) | 1069 (48) |
| Very good | 2311 | 1033 (45) | 1278 (55) | 698 (30) | 335 (15) | 208 (9) | 1070 (46) |
| Good | 1465 | 714 (49) | 751 (51) | 495 (34) | 219 (15) | 147 (10) | 604 (41) |
| Fair/poor | 433 | 222 (51) | 211 (49) | 160 (37) | 62 (14) | 45 (10) | 166 (38) |
| Missing | 4 | 2 (50) | 2 (50) | 1 (25) | 1 (25) | 1 (25) | 1 (25) |
| Household exposure to smoke | |||||||
| Yes | 714 | 263 (37) | 451 (63) | 179 (25) | 84 (12) | 67 (9) | 384 (54) |
| No | 5707 | 2599 (46) | 3108 (54) | 1814 (32) | 785 (14) | 596 (10) | 2512 (44) |
| Missing | 31 | 15 (48) | 16 (52) | 10 (32) | 5 (16) | 2 (6) | 14 (45) |
| Children aged <12 y in household, no. | |||||||
| 0 | 3221 | 1547 (48) | 1674 (52) | 1083 (34) | 464 (14) | 261 (8) | 1413 (44) |
| 1 | 1376 | 542 (39) | 834 (61) | 358 (26) | 184 (13) | 158 (11) | 676 (49) |
| ≥2 | 1855 | 788 (42) | 1067 (58) | 562 (30) | 226 (12) | 246 (13) | 821 (44) |
| Reported current health assessmentd | 6445 | 60 (45–75) | 60 (40–70) | 60 (45–75) | 60 (45–75) | 60 (45–75) | 55 (40–70) |
Data are no. (%) of patients or median value (interquartile range), unless otherwise indicated.
Abbreviations: ACIP, Advisory Committee on Immunization Practices; BMI, body mass index.
a Medical record and/or immunization registry documentation of receipt of ≥1 dose of 2012–2013 influenza vaccine (for persons aged ≥9 years) or receipt of the number of doses of 2012–13 influenza vaccine recommended by the ACIP (for persons aged 6 months through 8 years) ≥14 days before illness onset.
b Medical record and/or immunization registry documentation of receipt of ≥1 dose of 2011–2012 influenza vaccine.
c Presence of ≥1 medical record-documented high-risk codes in prior year, as defined by the ACIP guidance for conditions that increase risk for complications from influenza.
d The validated EQ-5D health ruler [21] was used to assess patient health on the day of enrollment. Data are presented on a scale of 1 (worst) to 100 (best).
Current and prior season vaccination statuses were highly correlated. Among patients who received current-season vaccination, 70% were also vaccinated during the prior season. Among patients who did not receive current-season vaccination, 81% were not vaccinated during the prior season. Approximately 60% of adults aged ≥65 years were vaccinated during both the current and prior seasons. In contrast, 22% of patients aged 9–17 years and 21% aged 18–49 years were vaccinated during both seasons.
Current-Season VE
Overall adjusted VE was 49% (95% CI, 43%–55%) against all outpatient influenza illness. VE was 39% against influenza A(H3N2) (95% CI, 29%–47%), 66% against the vaccine lineage influenza B/Yamagata (95% CI, 58%–73%), and 51% against the nonvaccine lineage influenza B/Victoria (95% CI, 36%–63%; Tables 3 and 4). There was significant protection against influenza A(H3N2) among patients aged 6 months–8 years, 18–49 years, and 50–64 years (Table 3); VE CIs among children aged 9–17 years and adults aged ≥65 years included 0. VE estimates from the simple and fully adjusted models were similar overall and within age strata (Supplementary Table 1). Examination of VE as a function of continuous age (Figure 1A and 1B) demonstrated a gradual decline in children and adolescents, and a relatively stable VE among working-age adults. These results were generally consistent with the age-stratified measures, but the CIs were wide when VE was assessed by year of age. The effectiveness of IIV3 and LAIV3 did not differ significantly among children aged 2–17 years. VE against influenza A(H3N2) was 36% (95% CI, 15%–51%) for children who received IIV3 and 46% (95% CI, 13%–66%) for those who received LAIV3. VE against the B vaccine lineage (Yamagata) was 68% (95% CI, 54%–77%) for children who received IIV3 and 53% (95% CI, 20%–73%) for those who received LAIV3. Data were too sparse to estimate VE against influenza B/Victoria (nonvaccine lineage) by vaccine type.
Overall and Influenza A(H3N2)–Specific Unadjusted and Adjusted Vaccine Effectiveness (VE), by Age Group and Vaccination Status
| Age, Vaccination Status | Any Influenza Virus Detected | Influenza A(H3N2) Detected | ||||
|---|---|---|---|---|---|---|
| Cases/Total (%) | Unadjusted VE (95% CI) | Adjusteda VE (95% CI) | Cases/Total (%) | Unadjusted VE (95% CI) | Adjusteda VE (95% CI) | |
| All ages | ||||||
| Vaccinated | 795/2877 (28) | 48 (42–53) | 49 (43–55) | 518/2600 (20) | 34 (25–42) | 39 (29–47) |
| Unvaccinated | 1512/3575 (42) | Reference | Reference | 774/2837 (27) | Reference | Reference |
| 6 mo–8 y | ||||||
| Vaccinated | 170/674 (25) | 61 (51–68) | 57 (45–67) | 84/588 (14) | 53 (36–65) | 51 (32–64) |
| Unvaccinated | 385/835 (46) | Reference | Reference | 158/608 (26) | Reference | Reference |
| 9–17 y | ||||||
| Vaccinated | 114/328 (35) | 40 (21–54) | 39 (18–54) | 55/269 (20) | 27 (−4 to 49) | 24 (−12 to 49) |
| Unvaccinated | 306/653 (47) | Reference | Reference | 123/470 (26) | Reference | Reference |
| 18–49 y | ||||||
| Vaccinated | 219/844 (26) | 39 (27–50) | 39 (26–50) | 150/775 (19) | 34 (18–47) | 34 (16–48) |
| Unvaccinated | 520/1423 (37) | Reference | Reference | 328/1231 (27) | Reference | Reference |
| 50–64 y | ||||||
| Vaccinated | 139/552 (25) | 63 (51–71) | 65 (54–74) | 106/519 (20) | 46 (27–60) | 52 (33–65) |
| Unvaccinated | 231/488 (47) | Reference | Reference | 122/379 (32) | Reference | Reference |
| ≥65 y | ||||||
| Vaccinated | 153/479 (32) | 29 (−2 to 50) | 26 (−10 to 50) | 123/449 (27) | 7 (−40 to 38) | 11 (−41 to 43) |
| Unvaccinated | 70/176 (40) | Reference | Reference | 43/149 (29) | Reference | Reference |
Data are for all vaccine types.
Abbreviation: CI, confidence interval.
a Adjusted for network site, subject age, presence of high-risk health conditions, and calendar time (2-week intervals).
Influenza B Lineage–Specific Unadjusted and Adjusted Vaccine Effectiveness (VE), by Age Group and Vaccination Status
| Age, Vaccination Status | Influenza B/Yamagata Detected | Influenza B/Victoria Detected | ||||
|---|---|---|---|---|---|---|
| Cases/ Total (%) | Unadjusted VE (95% CI) | Adjusteda VE (95% CI) | Cases/ Total (%) | Unadjusted VE (95% CI) | Adjusteda VE (95% CI) | |
| All ages | ||||||
| Vaccinated | 138/2220 (6) | 69 (62–75) | 66 (58–73) | 98/2180 (5) | 53 (39–63) | 51 (36–63) |
| Unvaccinated | 444/2507 (18) | Reference | Reference | 205/2268 (9) | Reference | Reference |
| 6 mo–17 y | ||||||
| Vaccinated | 69/787 (9) | 70 (60–77) | 68 (57–76) | 63/781 (8) | 45 (24–60) | NR |
| Unvaccinated | 254/1051 (24) | Reference | Reference | 127/924 (14) | Reference | Reference |
| ≥18 y | ||||||
| Vaccinated | 69/1433 (5) | 66 (55–75) | 65 (53–75) | 35/1399 (3) | 58 (37–72) | 58 (35–73) |
| Unvaccinated | 190/1456 (13) | Reference | Reference | 78/1344 (6) | Reference | Reference |
Data are for all vaccine types. Influenza B/Yamagata was the vaccine strain.
Abbreviations: CI, confidence interval; NR, not reported because estimates were unstable in adjusted models.
a Adjusted for network site, subject age in months, presence of high-risk health conditions, and calendar time (2-week intervals).
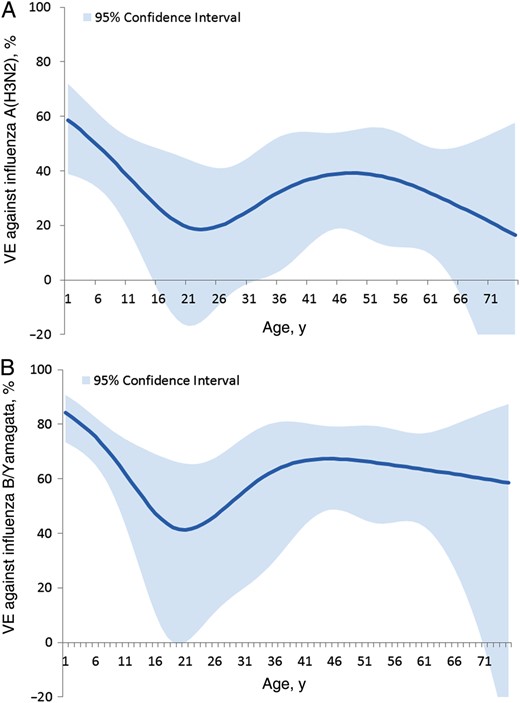
Trivalent inactivated influenza vaccine effectiveness (VE) against influenza A(H3N2) (A) and influenza B/Yamagata (B), by year of age among persons aged 1–75 years. VE estimates were derived by including an interaction term between age and current-season vaccination status in the logistic model, in which age was represented as a restricted cubic spline function with 5 knots based on percentiles. The confidence intervals represent the uncertainty around the point estimate at each age. VE data are adjusted for network site, subject age, presence of high-risk health conditions, and calendar time (2-week intervals).
In analyses incorporating self-reported vaccination status, VE estimates were similar to estimates determined using medical record/registry data only (Supplementary Table 2).
Current- and Prior-Season VE
The effectiveness of IIV3 was calculated with persons who were unvaccinated in both the current (2012–2013) season and the prior (2011–2012) season as the reference group. Protection against influenza A(H3N2) in the current season was similar for participants aged ≥9 years old who received vaccine in both the current and previous seasons, the current season only, and the previous season only (Figure 2). The adjusted VE against influenza A(H3N2) was 35% (95% CI, 21%–47%), 37% (95% CI, 19%–51%), and 33% (95% CI, 12%–49%), respectively, for these 3 groups. The pattern of current- and prior-season VE against influenza A(H3N2) varied by age, but CIs were wide. Among children aged 9–17 years, significant protection against influenza A(H3N2) was conferred by receipt of current-season vaccine alone, and residual protection was evident among those vaccinated with prior-season vaccine alone. However, children aged 9–17 years who were vaccinated in both seasons had significantly lower VE point estimates against influenza A(H3N2), compared with those who were vaccinated in the current season only (P = .01). Among those aged 18–49 years, all 3 vaccination histories provided significant protection against influenza A(H3N2). Adults aged 50–64 years had significant protection if they received both current- and prior-season vaccine, while VE was lower and CIs overlapped with 0 for receipt of prior- or current-season vaccine alone. VE was close to 0 for all vaccine combinations among adults aged ≥65 years.
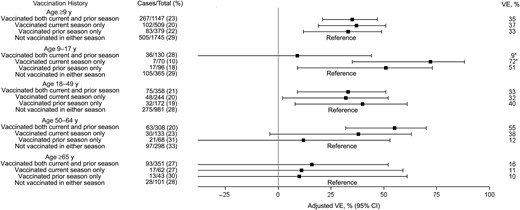
Age-specific trivalent inactivated influenza vaccine effectiveness (VE) of current and prior vaccination against influenza A(H3N2) among persons age ≥9 years, in which persons not vaccinated in either the current or prior season served as the reference group. VE data are adjusted for network site, subject age, presence of high-risk health conditions, and calendar time (2-week intervals). *P = .01 for comparison between the 2 vaccine groups. Abbreviation: CI, confidence interval.
Overall VE against influenza B was similar across all combinations of current- and prior-season vaccination and for all age categories (Figure 3). The adjusted VE against influenza B/Yamagata among those aged ≥9 years was 62% (95% CI, 48%–73%) for both-season vaccination, 69% (95% CI, 52%–80%) for current-season vaccination only, and 50% (95% CI, 24%–67%) for prior-season vaccination only. For the nonvaccine lineage (Victoria), the adjusted VE was 59% (95% CI, 36%–74%) for both-season vaccination, 64% (95% CI, 33%–81%) for current-season vaccination only, and 69% (95% CI, 35%–85%) for prior-season vaccination only (data not shown).
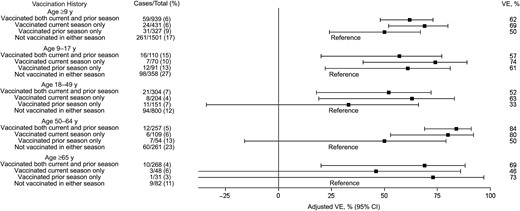
Age-specific trivalent inactivated influenza vaccine effectiveness (VE) of current and prior vaccination against influenza B/Yamagata among persons age ≥9 years, in which persons not vaccinated in either the current or prior season served as the reference group. VE data are adjusted for network site, subject age, presence of high-risk health conditions, and calendar time (2-week intervals). Abbreviation: CI, confidence interval.
Virus Characterization
Antigenic characterization demonstrated that influenza A(H3N2) viruses from 226 participants were antigenically similar to the cell-propagated A/Victoria/361/2011 reference virus (data not shown). Among the 44 viruses sequenced, 42 (95%) belonged to HA clade 3C and were similar to the majority of circulating influenza A(H3N2) viruses in the United States (Supplementary Figure 1).
DISCUSSION
The widespread circulation of influenza A(H3N2) and both influenza B-lineage viruses in 2012–2013 in the United States provided an opportunity to compare the age-specific VE of (IIV3) by influenza virus subtype. Influenza vaccination provided significant protection against medically attended influenza A(H3N2) and influenza B illness; significant protection was also observed in all age groups except individuals ≥65 years old. Cocirculation of both influenza B lineages during this season provided a unique opportunity to directly compare the VE for the vaccine lineage and the nonvaccine lineage.
We found that vaccination with a trivalent vaccine containing influenza B/Yamagata was effective against infection caused by influenza B/Victoria, indicating significant cross-lineage protection. Cross-lineage protection was also observed in Canada during 2012–2013 [12] and in the United States during 2011–2012 [4]. In contrast, data from Canada during 2011–2012 showed little or no cross-lineage protection [11], and previous studies have assumed little or no cross-lineage protection when estimating the value of quadrivalent influenza vaccines [22]. However, our 2012–2013 season results, taken together with similar findings in 2011–2012 [4], suggest that licensed quadrivalent vaccines may provide little or no additional protection than that offered by trivalent vaccines. Further research is needed to assess whether the benefits of a quadrivalent vaccine may be greater in children who have had few natural influenza B infections, compared with older individuals.
The VE estimate for influenza A(H3N2) in the United States was consistent with other reports estimating the VE against influenza A(H3N2) during 2012–2013 [12, 23–25] and with laboratory findings from US national virological surveillance [14]. Although virus surveillance indicated no antigenic drift between the circulating influenza A(H3N2) viruses and the cell-grown reference vaccine virus, the egg-propagated A/Victoria/361/2011 reassortant virus used in vaccine production acquired 3 amino acid changes in the antigenic region of HA (at positions H156Q, G186V and S219Y [mature H3 HA numbering]), which altered its antigenicity significantly. It is known that propagation of influenza viruses in eggs creates selection pressure for avian-adapted viruses that may differ antigenically and genetically from viruses grown in mammalian cell culture [14]. The impact of these minor antigenic and genetic changes on vaccine protection is uncertain. The 2013–2014 influenza A(H3N2) vaccine virus component was updated from A/Victoria/361/2011 virus to A/Texas/50/2012, which is a similar virus with fewer egg-induced changes and is considered more antigenically representative of the majority of circulating viruses [26].
Although we identified >2300 cases of influenza during this season, comparison of VE by vaccine type, virus subtype, and age was challenging because of sparse numbers in some strata. The low VE estimate against influenza A(H3N2) among adults aged ≥65 years has also been noted by others [6, 27]. This low VE against influenza A(H3N2) and relatively high VE against influenza B viruses suggest that other factors (eg, prior exposures to infections and vaccination), in addition to immunosenescence [28], may be important modifiers of VE in this age group. Although low VE in elderly adults has been previously reported, little is known about VE in older children and adolescents. Few observational studies have had adequate sample size to measure VE in adolescents, and randomized clinical trials have focused on younger children [29]. The lower VE against influenza A(H3N2) among older children, compared with other age groups, was an unexpected finding, as influenza vaccine performance in this age group was similar to that in other age groups during the 2011–2012 season [4]. Whether the observed low VE in older children this season is consistently present in other influenza A(H3N2) seasons is uncertain, but further work is needed to investigate factors that might contribute to lower protection in older children.
Our large sample size allowed age-specific analysis of the effects of current and prior season vaccination, the first time this was possible for an observational study. Overall, we found minimal differences in effectiveness against influenza A(H3N2) and influenza B for each of the 3 current and prior season vaccination exposure groups, suggesting some residual effect of prior vaccination on current-season VE. This was generally consistent when data were stratified by age. Residual protection of prior season vaccination may have also affected overall estimates. Estimates were lower among those aged 9–17 years and 18–49 years, in whom residual protection from prior-season vaccination only was observed, compared with adults aged 50–64 years, in whom protection from prior-season vaccination only was not observed. These results may give some insight into the lower VE in certain age groups this season. The immunologic effects of repeated vaccination are not well understood, and additional studies are needed to understand the impact of past infections, past vaccinations, and antigenic variability on the risk of illness [30, 31].
The absolute difference in the interim VE estimate (based on early season data) [6] and the final, end-of-season VE estimate reported here was 7% for all influenza types and 8% for influenza A(H3N2). The final VE was lower than the interim VE in both cases, but the CIs overlapped. Interim and final VE estimates were nearly identical for influenza B. Overall, this comparison and comparisons of interim and final VE estimates from Canada and Europe suggest that interim VE estimates derived from early season data provide useful and timely information on vaccine protection that can inform vaccine strain selection [12, 23–25]. However, interim VE estimates are necessarily based on a limited number of participants, and it is not possible to assess differential vaccine effects by product type, age group, or past vaccine exposures. Full-season data remain essential to provide more-precise VE estimates and examine differences in protection by host and virus characteristics.
In the United States, the ACIP recommends that all persons aged ≥6 months receive routine annual influenza vaccination, and vaccine antigens are changed on a regular basis [26]. It is therefore important to monitor vaccine performance against circulating strains annually. The distribution of influenza virus types and subtypes can vary substantially over time and in different geographic areas. Seasonal VE estimates should be reported by virus type, subtype, and lineage and by vaccine type, to facilitate valid comparisons, including specific estimates within standard age strata. Separate estimates, by vaccine type, should be generated whenever possible. In addition, cost-effectiveness research could be used to estimate the direct and indirect benefits of repeated annual vaccination on the burden of influenza in different age strata.
Supplementary Data
Supplementary materials are available at The Journal of Infectious Diseases online (http://jid.oxfordjournals.org). Supplementary materials consist of data provided by the author that are published to benefit the reader. The posted materials are not copyedited. The contents of all supplementary data are the sole responsibility of the authors. Questions or messages regarding errors should be addressed to the author.
Notes
Acknowledgments. Additional members of the US Flu-VE Network include Deanna Cole, Donna David, Sarah Kopitzke, Tamara Kronenwetter Koepel, Carla Rottscheit, Sandra Strey, and Laurel Verhagen (Marshfield Clinic Research Foundation); Juhee Song, PhD, Lydia Clipper, Dean Kjar, MS, Anne Robertson, Melinda Dunnahoo, Stephanie Oliver, MS, Monica Weir, Hope Gonzales, Martha Zayed, Teresa Ponder, JoAnn Nichols, Michael Reis, MD, Cathleen Rivera, MD, David Morgan, MD, and Vasanthi Avadhanula, PhD (Baylor Scott and White Health); Alan Aspinall, MD, G. K. Balasubramani, PhD, Arlene Bullotta, Heather Eng, Edward Garofolo, MD, Philip Lozzi, MD, Rhett H. Lieberman, MD, Donald B. Middleton, MD, Krissy K. Moehling, MPH, Christopher Olbrich, MD, Evelyn Reis, MD, Charles R. Rinaldo Jr, MD, Sandra Sauereisen, MD, Michael Susick, MPH, Joe Suyama, MD, Leonard Urbanski, MD, and Stephen R. Wisniewski, PhD (University of Pittsburgh); Joyce Benoit and C. Hallie Phillips (Group Health Cooperative); Emileigh Johnson, Rachel T. Cross, MPH, Casey Martens, Marcus Zervos, MD, Lois Lamerato, PhD, and Mary Ann Aubuchon (University of Michigan, Ann Arbor and Henry Ford Health System); and Xu Xiyan and Rebecca Garten (Centers for Disease Control and Prevention).
Disclaimer. The findings and conclusions in this article are those of the authors and do not necessarily represent the views of the Centers for Disease Control and Prevention (CDC).
Financial support. This work was supported by the CDC, through cooperative agreements with the University of Michigan (U01 IP000474), Group Health Research Institute (U01 IP000466), Marshfield Clinic Research Foundation (U01 IP000471), University of Pittsburgh (U01 IP000467), and Baylor Scott and White Health (U01 IP000473); and by the National Institutes of Health (grants UL1 RR024153 and UL1TR000005 to the University of Pittsburgh).
Potential conflict of interest. H. Q. M., M. E. S., J. K. M., and E. A. B. report receiving research grant support from Medimmune. M. G. reports receiving research support from Medimmune and Novartis. P. A. P. reports service on speakers bureau for MedImmune. R. K. Z. and M. P. N. reports research grant support from Medimmune, Sanofi Pasteur, Pfizer, and Merck and consulting fees from Medimmune. J. M. R. reports research grant support from Pfizer. S. E. O. reports research grant support from Sanofi Pasteur. A. S. M. reports receiving research grant support from Sanofi Pasteur and consulting fees from Novartis, Novavax, and GlaxoSmithKline. All other authors report no potential conflicts.
All authors have submitted the ICMJE Form for Disclosure of Potential Conflicts of Interest. Conflicts that are considered relevant to the content of the manuscript have been disclosed.
References
Author notes
Presented in part: MMWR Morb Mortal Wkly Rep 2013; 62:32–5; Options for the Control of Influenza VIII, Cape Town, South Africa, 5–10 September 2013.

