


Background: Therapies cotargeting insulin-like growth factor receptor 1 (IGF-1R) and mammalian target of rapamycin (mTOR) have demonstrated remarkable, albeit short-lived, clinical responses in a subset of Ewing sarcoma (ES) patients. However, the mechanisms of resistance and applicable strategies for overcoming drug resistance to the IGF-1R/mTOR blockade are still undefined.
Methods: To elucidate predominant mechanism(s) of acquired drug resistance while identifying synergistic drug combinations that improve clinical efficacy, we generated more than 18 ES cell lines resistant to IGF-1R- or mTOR-targeted therapy. Two small-molecule inhibitors of IGF-1R were chosen, NVP-ADW-742 (IGF-1R-selective) and OSI-906 (a dual IGF-1R/insulin receptor alpha [IR-α] inhibitor). Reverse-phase protein lysate arrays (RPPAs) revealed proteomic changes linked to IGF-1R/mTOR resistance, and selected proteins were validated in cell-based assays, xenografts, and within human clinical samples. All statistical tests were two-sided.
Results: Novel mechanisms of resistance (MOR) emerged after dalotuzumab-, NVP-ADW-742-, and OSI-906-based targeting of IGF-1R. MOR to dalotuzumab included upregulation of IRS1, PI3K, and STAT3, as well as p38 MAPK, which was also induced by OSI-906. pEIF4E(Ser209), a key regulator of Cap-dependent translation, was induced in ridaforolimus-resistant ES cell lines. Unique drug combinations targeting IGF-1R and PI3K-alpha or Mnk and mTOR were synergistic in vivo and vitro (P < .001) as assessed respectively by Mantel-Cox and isobologram testing.
Conclusions: We discovered new druggable targets expressed by chemoresistant ES cells, xenografts, and relapsed human tumors. Joint suppression of these newfound targets, in concert with IGF-1R or mTOR blockade, should improve clinical outcomes.
Ewing sarcoma (ES), the second most common pediatric bone cancer, occurs when the N-terminal EWSR1 gene joins one of several E26 transformation–specific (ETS) genes (typically FLI1) to form a pathognomonic fusion protein capable of inducing widespread genomic dysregulation and tumorigenesis (1–3). Among the affected pathways, the insulin-like growth factor receptor 1 (IGF-1R)/PI3K/Akt/mammalian target of rapamycin (mTOR) axis has received attention given its central role in sustaining cell survival and, likely, susceptibility to drug targeting (4–7).
The clinical results targeting IGF-1R through antibodies were mixed, and only 10% to 14% of ES tumors exhibited responses (8,9). To improve upon these tepid results, two IGF-1R-specific trials are enrolling patients with metastatic ES: 1) Children’s Oncology Group’s (COG) AEWS1221, which combines ganitumab with cytotoxic chemotherapy under the pretense of synergy with vincristine (NCT02306161), and 2) EORTC’s single-agent OSI-906 (linsitinib; NCT02546544) trial, which cotargets IGF-1R and insulin receptor–alpha (IR-α), an IR isoform expressed by ES that promotes somatic growth and mediates an active crosstalk with the proximal portion of the IGF/PI3K/Akt/mTOR pathway (10–17).
A third clinical trial, currently in development, would combine AZD2014 (AstraZeneca’s dual TORC1/2 mTOR inhibitor [mTORi]) with Medi-573, a dual IGF-1R/IR-α inhibitor that acts by sequestering the IGF1 and IGF2 ligands from their cognate IGF-1R and IR-α receptors (18,19). Though mTORi and IGF-1R inhibitors (IGF-1Ri) by themselves are ineffective in most sarcoma subtypes (20), because of direct counter-regulatory effects (21–23), they provoke striking synergy in xenografts (and occasionally in patients) when used together (24–26). The trial by Naing et al., for example, demonstrated compelling clinical activity in adult ES patients (27). Two subsequent studies conducted by COG and Memorial Sloan Kettering Cancer Center (MSKCC) reported a high prevalence of mTORi-related toxicities that required dose reductions and led to subtherapeutic levels and marginal clinical results (28,29). As presented within this work, we sought to explain these clinical findings by modeling drug combinations within preclinical animal studies.
Though IGF-1R antibodies are well tolerated, the narrow therapeutic index of mTORi suggests the need for less toxic drugs that maintain synergy with IGF-1Ri. Herein, a proteomic analysis was used to identify altered protein expression in ES cells (TC32 and TC71), xenografts (TC71 and EW5), and primary human tumors that had acquired resistance to IGF-1Ri- and/or mTOR-targeted therapies, including NVP-ADW-742, linsitinib (OSI-906), dalotuzumab (MK0646), ridaforolimus (MK8669), or a joint IGF-1Ri/mTORi combination. We hypothesized that network fragility downstream of IGF-1R (eg, IRS1, PI3K-α, pPKCα-S657, pSrc-Y416, and pStat3-Y705) or mTOR (pEIF4E-S209) could be exploited therapeutically to overcome acquired mechanisms of resistance (MOR) to today’s most promising biologically targeted therapies demonstrating promise in the treatment of ES. Taken together, this research approach may help prioritize the most promising drug combinations for additional scrutiny in human clinical trials.
Methods
ES Cell Lines and Generation of Acquired Drug-Resistant Clones
ES cell lines A4573, TC32, and TC71 were maintained in in vitro culture and tested for cellular identity according to our institutional protocols (30). The preparation of drugs for in vitro applications, generation of ES-acquired, drug-resistant clones and the assessment of in vitro cell viability and drug resistance are described in the Supplementary Methods (available online).
Proteomic Studies (Immunoblots and Reverse-Phase Protein Lysate Array)
The extracted proteins from cells or tumors for immunoblotting and reverse-phase protein lysate array (RPPA) analyses were prepared as described previously (31). All the RPPA data for in vivo EW5 xenografts (GSE78123) and in vitro acquired-resistant ES cell lines to IGF-1R (GSE78121) and to mTOR (GSE78122) blockades are available from the Gene Expression Omnibus repository under GSE78124 series. Additional details are provided in the Supplementary Methods (available online).
Generation of EW5 and TC71 ES Xenografts and Drug Evaluation
All experiments were conducted in accordance with protocols and conditions approved by the University of Texas MD Anderson Cancer Center (MDACC; Houston, TX) Institutional Animal Care and Use Committee (eACUF Protocols [#03-11-02531, #03-11-02532, and #00000928-RN00]), and Institutional Biosafety Committee (eIBC#HA0411-346-1). Male NOD (SCID)-IL-2Rgnull mice (The Jackson Laboratory; Bar Harbor, ME) were subcutaneously injected with TC71 cells (106 cells/mouse) or received EW5 explants (2 mm) to generate xenografts. Drug treatment and additional details are provided in the Supplementary Methods (available online).
Gene Expression Profiling and Analysis
Total RNA preparation from EW5 xenograft–bearing mice treated with dalotuzumab or normotonic saline solution (control) and their gene expression profiling and analyses are described in detail in the Supplementary Methods (available online). Array data for dalotuzumab-treated and control EW5 xenografts (GSE67529) are available from the Gene Expression Omnibus repository.
Combination Experiments and Determination of Synergy
To assess synergistic effects on ES cell growth, individual drugs alone and in combination were analyzed using CalcuSyn software 2.1 (Biosoft; Cambridge, UK). Additional details about isobologram analyses are provided in the Supplementary Methods (available online).
Human Clinical Samples and Immunohistochemical Staining
All patient data presented in this work were collected under MDACC institutional review board (IRB)–approved lab protocol LAB08-0151. Further details for immunohistochemical procedures are described in the Supplementary Methods (available online).
Statistical Analyses
RPPA and gene expression profiling data were median-centered. Principal component analysis was used to check for a batch effect, and feature-by-feature two-sample t tests or all-groups one-way analysis of variance followed by the Turey's test were used to assess differences between treatment(s) and control groups. Additional statistical methods are described in the Supplementary Methods (available online). All statistical tests were two-sided, and a P value of less than .05 was considered statistically significant.
Results
In Vivo Effects of IGF-1R/mTOR Blockade in ES Xenografts
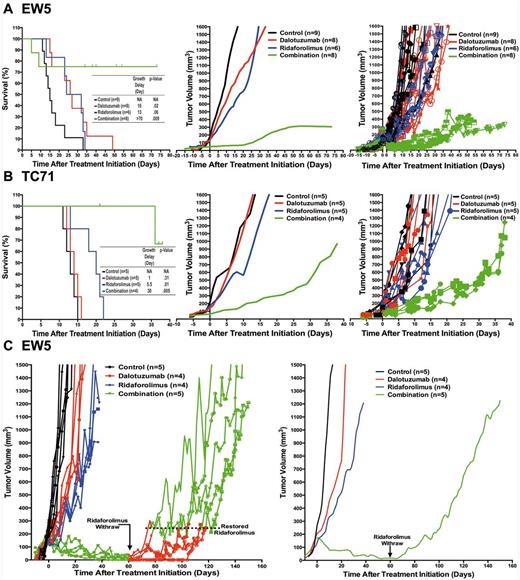
Therapeutic effect of insulin-like growth factor receptor 1 (IGF-1R)/mammalian target of rapamycin (mTOR) blockade in Ewing sarcoma (ES) xenografts. Tumor-bearing mice volumes were reported after been treated with the IGF-1R mAb dalotuzumab (MK-0646, red), the mTORi ridaforolimus (MK-8669, blue), or both (Combination, green). The left panels show Kaplan-Meier curves and tumor growth delay times, and P values for differences between the treated and control mice were performed with the log-rank (Mantel-Cox) test; the middle panels show the smoothed grouped median relative tumor volumes; and the right panels show individual tumor volumes for selected EW5 (A) and TC71 (B) ES tumors. C) Temporary mTORi withdraw from EW5 xenografts treated with the IGF-1R inhibitor (IGF-1Ri)/mTOR inhibitor (mTORi) combination accelerated tumor growth. After 60 days post-treatment initiation, mTORi was temporarily withdrawn from treated mice with the IGF-1Ri/mTORi combination and restored when their tumor volume reached 200 to 250 mm3. The left panel shows individual tumor volumes, and the right panel shows the smoothed, grouped median relative tumor volumes.
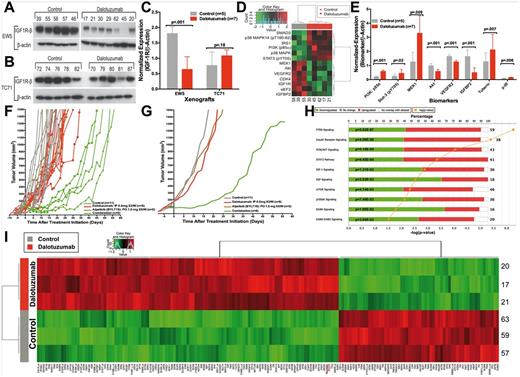
Mechanisms of resistance and cell signaling pathway analyses following insulin-like growth factor receptor 1 inhibitors (IGF-1Ri) in Ewing sarcoma (ES) xenografts. MK-0646-induced downregulation of IGF-1R was validated in EW5 tumors (A) but not TC71 tumors (B). C) Normalized IGF-1R expression relative to β-actin in IGF-1Ri-treated and control xenografts with their respective unpaired two-tailed Student’s t test statistical analyses; bars show mean ± SD. D) Reverse-phase protein lysate array (RPPA) profiling of control (gray) and MK-0646-treated (red) EW5 tumors at the time when their volume reaches 1500 mm3 (GSE78123) identifies statistically significantly 13 proteins at a false discovery rate (FDR) of 0.2. Abbreviated gene of the indicated protein is provided in the Supplementary Table (available online) of proteins analyzed in RPPA. E) Immunoblot validation of proteins differentially identified by RPPA (Figure 2D) after β-actin normalization. The P values were derived from statistical analyses using the unpaired, two-tailed Student’s t test; bars show mean ± SD. F and G) In vivo combination of dalotuzumab and alpelisib synergistically repress ES cell growth. EW5 tumor–bearing mice volumes were reported after being treated with the IGF-1R mAb dalotuzumab (MK-0646, red), the PI3Kα inhibitor alpelisib (NVP-BYL719, brown), or both (Combination; green). The curves show individual tumor volumes (F) and smoothed, grouped median relative tumor volumes (G). H) Ingenuity pathway analysis following dalotuzumab of EW5 tumors using a Fisher’s exact test with a fold-change greater than 1.5 and a P value of less than .05 showed the top 10 selected pathways. The bar chart displays the percentages of biomarkers. I) Microarray gene expression analysis between control- and dalotuzumab-treated EW5 xenografts (GSE67529) identifies statistically significantly 173 genes and expressed sequence tags (EST) at an FDR of 0.17 and a P value cutoff of .002. IGF-1R = insulin-like growth factor 1 receptor.
In Vivo MOR Induced by IGF-1R mAb
Continuing the advancement of IGF pathway–targeted agents as experimental treatment options for patients with metastatic ES, our current focus is to identify predictive biomarker(s) of response and to assess pharmacodynamic response. Our prior research demonstrates that ES, cultured on monolayers devoid of extracellular matrix (ECM) cues and mechanical stress, is relatively insensitive to IGF-1R mAbs as compared with xenografts or tridimensional-tissue engineered ES constructs (31,35,36). Therefore, acquired resistance to dalotuzumab was evaluated in the EW5 xenograft model, whereas OSI-906 and NVP-ADW-742 were assessed in parental and in vitro–generated resistant ES cell lines. Dalotuzumab- or placebo-treated EW5 tumors were collected once they reached 1500 mm3 and were analyzed using RPPA, which included 183 enriched proteins/phosphoproteins linked to human malignancies. Statistical analysis comprising a supervised analysis and t test with a Benjamini-Hochberg correction of false discovery rate (FDR; 0.2) revealed that 13 proteins were differentially expressed between the dalotuzumab- and placebo-treated tumors (GSE78124 series and GSE78123 subseries) (Figure 2, D and E; Supplementary Figure 1, available online). Expectedly, dalotuzumab treatment downregulated IGF-1R and vascular endothelial growth factor receptor (VEGFR2), a protein often indirectly suppressed by IGF-1R modulation (26). Notably, IGF-1R blockade upregulated key proteins in ES, including IRS1, PI3K(p85α), total/phosphorylated p38 (37), and phosphorylated STAT3-Y705 (38,39).
To determine whether acquired protein upregulation by drug-resistant xenografts would, in fact, predict synergistic drug combinations, inhibitors of PI3K-alpha (alpelisib; NVP-BYL-719) and Stat3 (WP1722) were each tested in combination with IGF-1R blockade. After one month of treatment with alpelisib and dalotuzumab, EW5 xenografts showed statistically significant tumor growth inhibition in comparison with single treatment (P < .001) (Figure 2, F and G). The OSI-906 and WP1722 combination also exhibited an in vitro synergy in TC71 (95% confidence interval [CI] = 0.7 to 0.9) and EW5 cells (95% CI = 0.7 to 0.9), and xenograft validation of these promising results has been initiated (Supplementary Figure 2, available online). Collectively, these results demonstrate that pronounced upregulation of PI3Kα and Stat3 were linked to IGF-1Ri-acquired MOR.
To expand our analysis beyond the subset of proteins included in the RPPA, we assessed the transcriptional activity of 22,700 genes in placebo- and dalotuzumab-treated xenografts using the Affymetrix GeneChip system (Figure 2, H and I). Pathway and network analysis of the genomic data using ingenuity pathway analysis revealed major changes in the IGF-1R, IR, PI3K/AKT, STAT3, and IGF-1 signaling pathways (Figure 2H). A supervised analysis comprising a t test with a Benjamini-Hochberg correction of FDR (0.17) and P value (∼ .002) identified 173 differentially expressed genes, which included the IR (GSE-67529). The discussion of the observed genomic changes is beyond the scope of this work. While reinforcing the role of IGF-1R/mTOR activities in ES survival, these results indicate that other proteins and/or genes within the IGF-1R/mTOR regulatory network could also be targeted.
In Vitro MOR to Small-Molecule IGF-1R Inhibitors
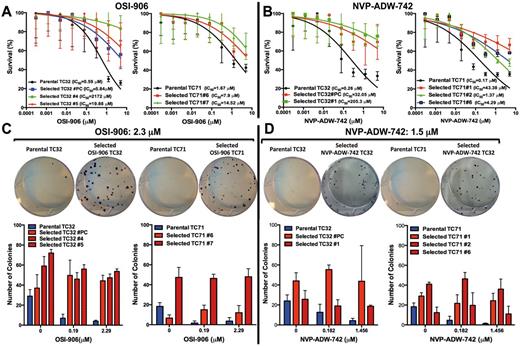
Ewing sarcoma (ES) in vitro resistance to OSI-906 and NVP-ADW-742. Stable, drug-resistant clones (colored lines) were derived from parental cell lines that were exposed to high concentrations of OSI-906 (A) or NVP-ADW-742 (B). Cell proliferation assay after 72 hours of exposure to insulin-like growth factor receptor 1 inhibitor (IGF-1Ri). The IC50 values of each drug-sensitive parental and selected IGF-1R-resistant cell lines are also shown. C and D) Validation of ES cell drug resistance to OSI-906 (C) or NVP-ADW-742 (D) after two weeks’ exposure using colony formation assay. Curves and columns represent the mean values of three independent experiments, and bars represent standard deviations. IC50 = half maximal inhibitory concentration.
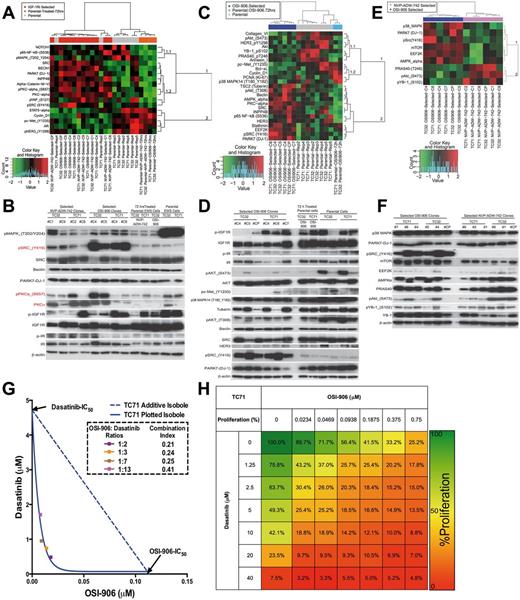
Synergistic effects of OSI-906 and dasatinib in Ewing sarcoma (ES) cell lines. A) Reverse-phase protein lysate array (RPPA) analysis of ES cell lines sensitive (parental) or resistant to OSI-906 and NVP-ADW-742 separated the 25 samples into three groups (columns) and identified 17 proteins statistically significantly associated with the treatment at a false discovery rate (FDR) of 0.05 (GSE78121). B) Immunoblotting validation of the differentially expressed proteins identified by RPPA in (A). C) RPPA analysis of OSI-906-sensitive and -resistant ES cell lines separated the 16 samples into three groups (columns) and identified 25 proteins statistically significantly associated with the treatment at an FDR of 0.1 (GSE78121). D) Immunoblotting validation of the differentially expressed proteins identified by RPPA in (C). E) RPPA analysis of OSI-906- and NVP-ADW-742-resistant ES cell lines identified nine proteins statistically significantly associated with the treatment at an FDR of 0.3 (GSE78121). F) Immunoblotting validation of the differentially expressed proteins identified by RPPA in (E). All the RPPA analysis of ES cell lines sensitive or resistant to insulin-like growth factor receptor 1 inhibitors were performed with an unsupervised hierarchical clustering using the Euclidian distance between proteins (rows) and Ward’s linkage clustering method. Abbreviated gene of the indicated protein is provided in the Supplementary Table (available online) of proteins analyzed in RPPA. G) Isobologram analysis showed a synergistic inhibition of parental sensitive TC71 ES cell proliferation after in vitro combination of OSI-906 and dasatinib. Combination index (CI) values are given for each ratio, with synergism < 1, additivity = 1, and antagonism > 1. H) Heat map summarizing the in vitro dose response effect of OSI-906 and/or dasatinib in the TC71 ES cell proliferation. The data are the mean of nine replicates from three different experiments.
As p-IR was absent from the RPPA, immunoblots were used to identify upregulation in NVP-ADW-742-resistant clones, consistent with previous reports that ES can rely upon IGF2/IR-α signaling to survive when the IGF1 pathway is inhibited. Testing our hypotheses that dual IGF-1R/IR-α inhibitors are superior to more selective agents, we investigated OSI-906 more thoroughly (GSE78121) (Figure 4, C and D) and compared its effect to that of NVP-ADW-742 (Figure 4, E and F). In contrast to NVP-ADW-742-resistant cells, all OSI-906-resistant clones had high p-Src. The contribution of Src to OSI-906 resistance was tested using dasatinib, which impairs pSrc-Y416 phosphorylation in a dose- and time-dependent manner (Supplementary Figure 4, A and B, available online). Isobologram testing indicated prominent synergy in TC71 cells (95% CI = 0.2 to 0.4) (Figure 4, G and H, available online), and two additional cell lines: A4573 and TC32 (Supplementary Figure 4, C-F, available online). The distinct protein expression patterns observed in OSI-906- and NVP-ADW-742-treated clones hints that optimal pairing of either agent with non-IGF-1R-targeted drugs will depend on the degree of IGF-1R/IR-α selectivity.
In Vitro MOR to mTORi and Novel Synergistic Drug Combination
Given the narrow therapeutic index of mTOR inhibitors when they are used alone, we sought to identify other targetable proteins and strategies to overcome MOR within the mTOR pathway. Cotargeting these proteins is expected to enhance the effect of mTORi and possibly reduce the dose required to achieve clinical benefit.

Efficacy of mammalian target of rapamycin inhibitor (mTORi) and mitogen-activated protein kinase–interacting protein kinase inhibitor (Mnki) in Ewing sarcoma (ES) cells and xenografts. A) Proteomic analysis of sensitive and resistant ES cell lines to ridaforolimus (MK-8669). Reverse-phase protein lysate array (RPPA) analysis of ES cell lines sensitive and resistant to ridaforolimus. Unsupervised hierarchical clustering separated the 13 samples into three groups of cell lines (columns) and identified 34 proteins (rows) statistically significantly associated with the treatment at a false discovery rate of 0.002 (GSE78122). B) Immunoblotting validation of the differentially expressed proteins identified by RPPA in (A). Abbreviated gene of the indicated protein is provided in the Supplementary Table (available online) of proteins analyzed in RPPA. C) Signal integration between Mnk and insulin-like growth factor receptor 1/mTOR pathways describing the identified mechanism of resistance to mTORi and possible targeted therapies to overcome this resistance. D) Isobologram analysis showed that mTORi and Mnki are synergistic in inhibiting parental sensitive TC71 ES cell proliferation. Combination index (CI) values are given for each ratio, with synergism < 1, additivity = 1, and antagonism > 1. E) Heat map summarizing the in vitro dose response effect of ridaforolimus and/or CGP57380 in the TC71 ES cell proliferation. The data are the mean of nine replicates from three different experiments. F) EW5 tumor-bearing mice volumes were reported after being treated with the mTORi ridaforolimus (MK-8669, blue), the Mnk inhibitor (CGP57380, brown), or both (Combination, green). The curves show smoothed, grouped median relative tumor volumes. EIF4E-S209 = eukaryotic translation initiation factor 4E; ERK = extracellular signal-regulated kinase; IGF-1Ri = insulin-like growth factor 1 receptor inhibitor; MAPK = mitogen-activated protein kinase; MEK inhibitor = MAPK/ERK kinase inhibitor; Mnki = MAPK-interacting protein kinase inhibitor; mTORi = mammalian target of rapamycin inhibitor.
Putative targetable oncoproteins were upregulated in cluster 2. Of three proteins that were induced by short- and long-term ridaforolimus exposure (cluster 2.2), p-EIF4E-S209 expression tested by immunoblot (Figure 5B) was selected for additional inquiry given its nexus within the mTOR and MAPK pathways, its role in sustained malignancy, and vulnerability to Mnk1/2 inhibitors (Mnki)(41) (Figure 5C). Testing this hypothesis, the selective Mnk1/2 inhibitor CGP57380 reduced phospho- and total EIF4E expression (Supplementary Figure 6, A and B, available online) and, in combination with ridaforolimus, yielded combination indexes of 0.4 to 0.8 in the TC71 (Figure 5, D and E), A4573 (Supplementary Figure 6, C and D, available online), and TC32 (Supplementary Figure 6, E and F, available online) ES cell lines. Subsequent in vivo validation was performed using CGP57380 to determine if p-EIF4E-S209 inactivation would enhance the antitumor effects of the mTOR blockade. After one month of treatment with CGP57380 and ridaforolimus, EW5 xenografts showed statistically significant tumor growth inhibition in comparison with single-treatment drugs (P < .001) (Figure 5F). This Mnk-induced interference of p-EIF4E-S209 and its partner EIF4F complex is a newly discovered MOR for mTOR blockade in ES.
In Vivo Pharmacodynamic Effects of Dual IGF-1Ri/mTORi and Emergent MOR

Unique in vivo mechanisms of resistance to insulin-like growth factor receptor 1 (IGF-1R)/mammalian target of rapamycin (mTOR) blockade. A) Reverse-phase protein lysate array (RPPA)–based proteomic analysis of EW5 Ewing sarcoma (ES)–sensitive xenograft tumors after three days of IGF-R inhibitor (IGF-1Ri), mTOR inhibitor (mTORi), or combination treatments. B) RPPA analysis of EW5 tumors after 75 days of treatment (or sooner if they reached 1500 mm3) with unsupervised double hierarchical clustering that separated the 17 samples into four treatment groups (columns) and identified 25 proteins that are differentially expressed among the four treatment conditions at a false discovery rate (FDR) of 0.05 (GSE78123). Abbreviated gene of the indicated protein is provided in the Supplementary Table (available online) of proteins analyzed in RPPA. C-F) Immunoblotting validation of the proteins after β-actin normalization that are: (C) unaffected by treatment with IGF-1Ri or mTORi alone but statistically significantly downregulated by IGF-1Ri plus mTORi (cluster A in panel B) and inhibited by IGF-1Ri alone or combination but not by mTORi (cluster B in panel B), (D) inhibited by mTORi alone but not by IGF-1Ri (cluster C in panel B), (E) markedly upregulated following treatment with IGF-1Ri/mTORi and that might be potential biomarkers of resistance to this combined treatment (cluster D in panel B), and (F) differentially expressed among all groups of treated xenografts according to the unsupervised double hierarchical clustering analysis illustrated in (B) but with a lower FDR of 0.07 and a P value cutoff of .039; bars show mean ± SD.
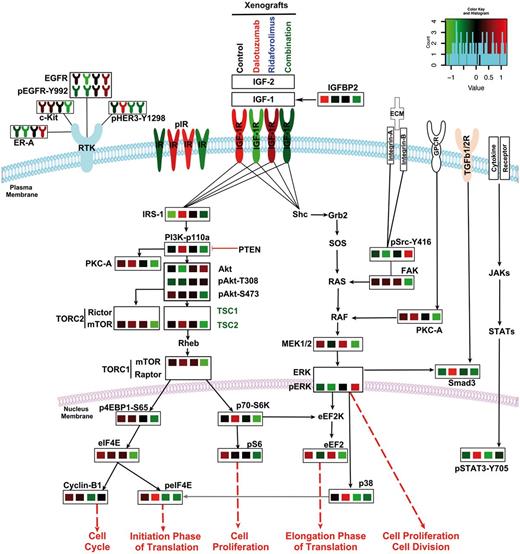
Insulin-like growth factor receptor 1 (IGF-1R)– and mammalian target of rapamycin (mTOR)–induced alterations upon the canonical IGF-1R signaling cascade, mitogen-activated protein kinase (MAPK) and receptor tyrosine kinase RTKs in Ewing sarcoma (ES). Average expression of teverse-phase protein lysate array (RPPA) data extracted from EW5 xenograft tumors treated with IGF-1R/mTOR blockade (Figure 6B) have been mapped onto manually curated canonical signaling cascades. The IGF-1R/PI3K/AKT/mTORC1 pathway, which is constitutively active in ES, is highly active in xenograft-control states. Blockade of IGF-1R (second column) or mTOR (third column), respectively, induced cross-resistance by either upregulating pIR-α or maintaining the enhanced activation of downstream oncogenic proteins such as PI3K, AKT, or eIF4E. The IGF-1R/mTOR blockade (Combination, fourth column) statistically significantly inhibited the IGF-1R/mTOR pathway, with prominent effects on IRS1, pPI3K, pAkt, p4EBP1, pS6, and others. The blockade of either IGF-1R or mTOR maintained MAPK pathway signaling levels, which were similar to those of the control group; the blockade of both IGF-1R and mTOR led to greater MEK1/2 inhibition, with the exception of pSRC-Y416. The IGF-1Ri–mTORi combination inhibited several RTKs that are frequently activated in other cancer types, including c-Kit, HER3, and epidermal growth factor receptor (EGFR); however, this treatment upregulated estrogen receptor (ER)-α. Key proteins that were not present in the RPPA or immunoblot panels are given in bold text only. pIR proteins were present in the immunoblot analyses (Figure 6F; Supplementary Figure 7, available online) and are represented here accordantly. Abbreviated gene of the indicated protein is provided in the Supplementary Table (available online) of proteins analyzed in RPPA.
Clinical Validation of IGF-1Ri/mTORi Resistance in Relapsed ES Tumor Patients
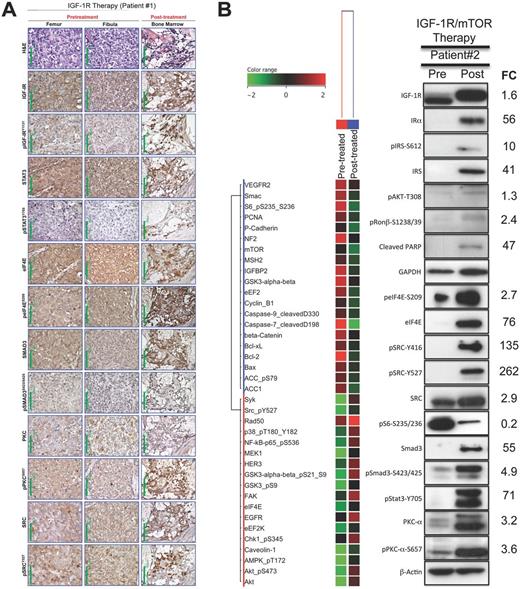
Clinical validation for biomarker of resistance to insulin-like growth factor receptor 1 inhibitor (IGF-1Ri)/mammalian target of rapamycin inhibitor (mTORi) in relapsed Ewing sarcoma (ES) tumor patients. A) Histological and immunohistochemical evaluations of relapsed ES patient tumor before and after IGF-1R therapy. Hematoxylin and eosin (H&E)–stained tumor sections from the first (left femur) and second (left fibula) pretreated specimens. The H&E stain of the bone marrow post-treated specimen showed almost complete lack of normal hematopoietic cellular elements and, instead, interstitial infiltration by small ES cells with a high N:C ratio. Immunohistochemical staining showed that after treatment there was remarkable upregulation of pIGF-IR, pSTAT3, and peIF4E and a moderate increase in the expression of pSMAD3 as compared with the pretreated specimens. Original magnification is × 400; 100 μm scale bars are shown. B) Reverse-phase protein lysate array (RPPA) and immunoblotting evaluations of relapsed ES patient tumor before (lung) and after (lung) IGF-1R/mTOR therapies obtained less than one week after the IGF-1Ri/mTORi drug combination was discontinued secondary to tumor progression. IGF-1R, Stat3, eIF4E, and Smad3, putative biomarkers of resistance to IGF-1R or/and mTOR blockades were highly expressed within post-treated ES patient tumor that had a near-complete response to combined IGF-1Ri and mTORi. Abbreviated gene of the indicated protein is provided in the Supplementary Table (available online) of proteins analyzed in RPPA. FC = fold-change; IGF-1R = insulin-like growth factor 1 receptor; mTOR = mammalian target of rapamycin.
Directly comparing the MOR observed in ES xenografts and human data (Figure 8; Supplementary Figure 8, available online), the post-treatment elevation of pSrc-Y416/Y527 in the second patient’s tumor was predicted from the EW5 explant model. Further, mTOR-treated ES tumors relying upon Mnk-activated pEIF4E signaling were observed in this patient as evidenced by low pS6-S235-S236, elevated phospho-eIF4E, 76-fold higher total eIF4E, and increased p38 MAPK. For upcoming IGF-1R-related clinical trials, our research team strongly advocates for mandated tumor biopsies, which are important to validate pharmacodynamic response and MOR.
Discussion
With compelling evidence that IGF-1R Abs (+/- mTORi) benefits a subset of chemorefractory ES patients, the current challenge is to identify better drug combinations that boost response rates and durations (8,11,27,28). Toward that end, we believe IGF-1Ri must be partnered with other therapies that are reliant upon EWS-FLI fusion. This, in turn, actuates IRS1 and begins preferential signaling through the PI3K, Akt, and ultimately mTORC1 pathways. For unexplained reasons, IGF-1R antibodies do not uniformly downregulate IGF-1R levels in post-treatment patient samples or xenografts, as observed in our TC71 xenograft (33).
Though one might think that terminal activation of the IGF-1R/Akt/mTOR cascade is irrelevant in ES because mTORi are rarely effective in sarcomas, the true therapeutic potential of mTORi is masked by two counter-regulatory effects:1) autocrine release of IGF-1 and 2) loss of p70S6K function, which blocks IRS1 phosphorylation/degradation (12–14,42). Dalotuzumab breaks this feedback loop by impairing IGF-1R and IRS1, which presumably explains why dalotuzumab was highly synergistic with ridaforolimus in the present study. Others have observed similar effects both preclinically and clinically (18,34). Naing et al., for example, demonstrated an impressive 29% response rate using the IMC-A12/temsirolimus combination and a seven-fold-longer response duration when compared with patients historically treated with single-agent IGF-1R Abs (8,11,27,28). Two subsequent studies failed to reproduce those results, and in each study the mTORi dose was reduced to attenuate mucositis or hepatic toxicity (28,29). In retrospect, our data in Figures 2, F and G, validate our hypothesis for the need to continue suppression of mTOR or other proteins that synergize with IGF-1R, such as PI3Kα or Stat3.
In addition to mTOR, the network data presented in Figure 7 suggest other proteins are likely to be synergistic with IGF-1Ri. Others have linked SRC to IGF-1R mAb resistance in lung cancer (43), demonstrated that PKC-α is elevated in drug-resistant ES (44–46), and proposed that both IR-α and STAT3 are mechanisms of IGF-1R mAb resistance in ES (17,34). Because there are too few ES patients to advance all rational drug combinations to phase 1b/2 clinical trials, further preclinical investigation of the following combinations is warranted: IGF-1R mAb with inhibitors of IRS1, PI3K, or STAT3; PKC or SRC inhibitors plus IGF-1R-targeted small molecules; or the combination of imatinib or PKC inhibitors plus a rapalog. Additionally, IGFBP2 has been linked to IGF-1R resistance in rhabdomyosarcomas via suppressed autocrine release by the tumor cells (47), and this appears to occur in our EW5 model as well.
Our data suggest that ES cells respond differently to IGF-1R-targeted antibodies and to small-molecule IGF-1Ri. Treatment with an IGF-1R mAb can reduce ES cells’ autocrine secretion of IGFBP2 and enhance secretion of the IGF-1 ligand, guaranteeing continued ligand-receptor affinity. They may also upregulate IRS1, a phenomenon that does not appear to occur in ES cells treated with small-molecule tyrosine kinase inhibitors. Though not discussed in this investigation, in remains to be determined whether the next generation of dual TORC1/2 inhibitors, by suppressing pAkt-S473, will be more effective than the TORC1-selective mTOR inhibitor chosen for our studies. Our discovery that ridaforolimus-resistant ES preserves p-EIF4E-S209 signaling via Mnk upregulation has not been reported for any sarcoma subtype, and we have confirmed its validation in vitro and in vivo.
Although our current investigations provide an exciting opportunity for clinical validation, we acknowledge several limitations in our approach. The data relied primarily upon cell lines and xenografts and included sparse human specimens from trials that did not mandate research biopsies. Second, cells grown in monolayer cultures devoid of stroma and 3D architecture reduced their resemblance to human tumors (31). Prospective validation of current findings in 3D cultures and patient-derived xenografts that maintain higher fidelity to human tumors will help clinicians to prioritize the limited number of drug combinations that can be reasonably tested in early-phase clinical trials for patients battling ES.
Funding
Intramural funding provided by The University of Texas MD Anderson Cancer Center supported the research presented herein. This work was supported in part by the National Cancer Institute through grants R01-CA180279-01A1 and R01-CA151533, the National Institutes of Health through MD Anderson’s Cancer Center Support Grant (CA16672), and with the generous philanthropic support of the Wells Alliance.
Notes
The study funders had no role in the design of the study; the collection, analysis, or interpretation of the data; the writing of the manuscript; or the decision to submit the manuscript for publication.
Author contributions: SELC and JAL designed research; SELC, BAM, VR, DV, RLM, and ASB performed research; SELC, BAM, YW, JW, AN, NCD, HMA, and JAL analyzed data; WP, IF, and SS designed and synthesized the stat3 inhibitor, respectively; and SELC and JAL wrote the paper with input from all authors.
We thank Joe Munch in MD Anderson’s Department of Scientific Publications for editing the manuscript and Beth Simpson in MD Anderson’s Veterinary Medicine and Surgery Department for her technical animal dosing support. We are grateful to Merck for providing the ridaforolimus and dalotuzumab, as well as to Novatis for delivering alpelisib.
References

