


ABSTRACT
Our knowledge of the populations and occurrence rates of planets orbiting evolved intermediate-mass stars lags behind that for solar-type stars by at least a decade. Some radial velocity surveys have targeted these low-luminosity giant stars, providing some insights into the properties of their planetary systems. Here, we present the final data release of the Pan-Pacific Planet Search (PPPS), a 5 yr radial velocity survey using the 3.9 m Anglo-Australian Telescope. We present 1293 precise radial velocity measurements for 129 stars, and highlight 6 potential substellar-mass companions, which require additional observations to confirm. Correcting for the substantial incompleteness in the sample, we estimate the occurrence rate of giant planets orbiting low-luminosity giant stars to be approximately 7.8|$^{+9.1}_{-3.3}$| per cent. This result is consistent with the frequency of such planets found to orbit main-sequence A-type stars, from which the PPPS stars have evolved.
1 INTRODUCTION
With the discovery of the first planets orbiting other stars (e.g. Campbell, Walker & Yang 1988; Latham et al. 1989; Mayor & Queloz 1995), astronomers gained first insight into the degree to which the Solar system is unique.In the three decades since, the global search for exoplanets has led to the discovery of more than 4000 planets orbiting nearby stars. Those discoveries have revealed the diversity and ubiquity of planetary systems – with the great majority of systems discovered proving to be remarkably different from the Solar system (e.g. Petigura et al. 2013; Winn & Fabrycky 2015; Bryan et al. 2019).
The last decade has seen the dawn of the golden age of space-based transit discoveries, which has led to the number of known exoplanets climbing by more than an order of magnitude. As a result, more than 80 per cent of all currently confirmed exoplanets were first identified by the Kepler and Transiting Exoplanet Survey Satellite (TESS) space telescopes (Borucki et al. 2010; Ricker et al. 2015). Those missions have been wildly successful in expanding our understanding of planetary system properties and architectures (e.g. Lissauer et al. 2011, 2014; Raymond et al. 2018; Zhu 2019) and, together with long-running radial velocity survey programs, have allowed us to study the occurrence rate of planets around solar-type and late-type stars (e.g. Endl et al. 2006; O’Toole et al. 2009; Fressin et al. 2013; Hardegree-Ullman et al. 2019). This has, in turn, opened a window on the planet formation history of the Galaxy, and has allowed conclusions to be drawn on the occurrence rate of true Solar system analogues ( |$\sim 24{{\,\rm per\,cent}}$| of planetary systems contain Earth-like planets, e.g. Barbato et al. 2018, and ∼3–6 per cent contain Jupiter analogues, e.g. Zechmeister et al. 2013; Wittenmyer et al. 2016c; Agnew, Maddison & Horner 2018; Borgniet et al. 2019).
While the situation for solar-type stars is now relatively understood, our knowledge of the occurrence and nature of planets around evolved stars remains relatively stunted. The main reason for this is that transit surveys intentionally bias against targeting stars that may be evolved. Such stars have larger radii, and hence the signal that results from planetary transits will be correspondingly diluted. The Kepler and TESS prime target lists selected against giant stars (e.g. Brown et al. 2011; Stassun et al. 2018), though the TESS full frame images are a valuable bias-free source of transit photometry for all types of stars. The confirmation of planet candidates transiting evolved stars, however, is frustrated not only by the smaller size of the signal, but also by intrinsic stellar variability, resulting in a high rate of false positives (e.g. Carter & Winn 2009; Mathur et al. 2012; Barclay et al. 2015). In recent years, some progress has been made by applying asteroseismic techniques to suitable evolved stars with transiting planet candidates (e.g. Quinn et al. 2015; Grunblatt et al. 2017; Chontos et al. 2019; Huber et al. 2019), but it seems likely that the problems inherent to detecting transiting planets orbiting evolved stars will continue to confound observers through the coming years.
To study the occurrence rates of planets orbiting evolved stars, other methods are needed. A number of radial velocity surveys have been targeting evolved stars for almost 20 yr, with the main scientific goal being to understand the properties of planetary systems orbiting stars more massive than our Sun. Those surveys began in an attempt to circumvent the challenges inherent to the radial velocity detection of planets orbiting massive stars.
The technical requirements imposed by Doppler exoplanetary detection mean that the most favourable main-sequence target stars lie in a narrow range of masses centred on 1 M⊙. Stars in this Sun-like mass range are cool enough and rotate slowly enough to present an abundance of narrow spectral absorption lines for accurate velocity determination. In contrast, however, more massive stars on the main sequence are too hot and rotate too rapidly for this technique to work. Main-sequence stars of higher mass have few usable absorption lines (due to their high temperatures), and also tend to be fast rotators (vsin i > 50 km s−1; Galland et al. 2005) – which causes what spectral lines they do have to be sufficiently broad as to render them useless for the detection of planet-mass objects. In addition, the shorter main-sequence lifetimes of higher mass stars mean that they will preferentially be observed at younger ages. Furthermore, stars earlier than a spectral class of around F7 also have much shallower convection zones than late-type stars, and so do not experience the magnetic braking that slows the rotation of those late-type (lower mass) stars.
While massive main-sequence stars are poor choices for radial velocity observations, their evolved siblings present a far better target. In particular, subgiants and low-luminosity giants are ideal radial velocity targets because their surface gravities remain high enough (log g ≳ 3) to avoid the large-amplitude pulsations common in red giants (Hekker et al. 2008), while still rotating slowly, and being cool enough to have the abundant, narrow spectral lines that facilitate radial velocity observations.
To learn more about the occurrence and properties of planets around more massive stars, several teams have been surveying so-called ‘retired A stars’, with a combined total of ∼1000 targets and 10–15 yr of observations (e.g. Sato et al. 2005; Johnson et al. 2006; Jones et al. 2011; Reffert et al. 2015). These surveys have borne fruit, with more than 100 planets being found to date (e.g. Johnson et al. 2007a, 2011; Jones et al. 2011; Sato et al. 2012; Niedzielski et al. 2015; Wittenmyer et al. 2015a; Luhn et al. 2019). As a result, we are now beginning to understand the relationship between stellar mass and the abundance of giant planets, with strong indications that giant planets are more efficiently formed around more massive stars (e.g. Bowler et al. 2010; Maldonado, Villaver & Eiroa 2013; Jones et al. 2016; Wittenmyer et al. 2017a).
The Pan-Pacific Planet Search (PPPS; Wittenmyer et al. 2011c) is an international collaboration between Australia, China, and the US, with the aim of attacking this critical problem by obtaining precision radial velocity measurements of bright Southern hemisphere, evolved intermediate-mass stars. The mean properties of the PPPS sample, as fully detailed in Wittenmyer et al. (2016d), are 1.31|$^{+0.28}_{-0.25}$| M⊙, log g = 3.09 ± 0.26 dex, [Fe/H] =−0.03 ± 0.16 dex, and Teff = 4812 ± 166 K. The PPPS operated on the Anglo-Australian Telescope (AAT) from 2009 to 2014, contributing to the discovery of 15 planets orbiting evolved stars (Wittenmyer et al. 2011c, 2015a; Sato et al. 2013; Wittenmyer et al. 2016a,b). Unfortunately, due to shifting priorities in the Australian telescope time assignment process, this program and the 18 yr Anglo-Australian Planet Search (Tinney et al. 2001) were prematurely terminated in 2014, and many PPPS targets were left with inadequate sampling to confirm or refute emerging candidate signals. The PPPS had 37 targets in common with the EXPRESS survey of southern evolved stars (Jones et al. 2011, 2014), and in recent years, we have jointly published several planet discoveries where our combined data sets confirmed the signals seen in the data from one or other of those surveys (Jones et al. 2016, 2017; Wittenmyer et al. 2017a), and results that have included the most eccentric planet known to orbit an evolved star (Wittenmyer et al. 2017b).
This paper is the final instalment of the PPPS series. We release all the final radial velocity measurements in Section 2, and in Section 3, we describe a handful of potential candidates that require further observations to confirm. In Section 4, we perform an analysis of the detection limits from this survey and derive an estimate of the occurrence rate of giant planets orbiting evolved stars, before drawing our conclusions in Section 5.
2 OBSERVATIONAL DATA
We observed the PPPS target stars using the UCLES spectrograph (Diego et al. 1990) on the 3.9 m Anglo-Australian Telescope from 2009 February until 2015 January. UCLES achieved a resolution of 45 000 with a 1 arcsec slit, and we aimed to achieve a signal-to-noise ratio (S/N) of 100 at 5500 Å per spectral pixel at each epoch, resulting in exposure times ranging from 100 to 1200 s. An iodine absorption cell provided wavelength calibration from 5000 to 6200 Å. The spectrograph point spread function (PSF) and wavelength calibration are derived from the iodine absorption lines embedded on every pixel of the spectrum by the cell (Valenti, Butler & Marcy 1995; Butler et al. 1996). The result is a precision Doppler velocity estimate for each epoch, along with an internal uncertainty estimate, which includes the effects of photon counting uncertainties, residual errors in the spectrograph PSF model, and variation in the underlying spectrum between the iodine-free template and epoch spectra observed through the iodine cell. The photon-weighted mid-time of each exposure is determined by an exposure metre. All velocities are measured relative to the zero-point defined by the template observation. The iodine-free template spectrum for each star was obtained with the 0.75 arcsec slit for a resolution of 60 000 with S/N ∼150–300 per pixel. Table A1 gives the complete set of final radial velocities from 105 PPPS targets. Table A2 summarizes the final dispositions of all PPPS targets, e.g. published companion, candidate, or double-lined binary.
3 CANDIDATE SIGNALS
While all of the secure planet detections from this survey have been published, the truncated temporal nature of our data set makes it inevitable that some stars will exhibit radial-velocity (RV) variations suggestive of substellar companions that still require the acquisition of additional data to either confirm or refute. Since the main PPPS survey has been concluded, in the interest of completeness, we now describe 12 potential candidates that may warrant further follow-up. These candidates fall into two broad categories: those for which a tentative orbital period can be obtained, and unconstrained long-period signals. They were identified by examining those stars which had (1) at least 8 RV epochs (to enable a non-trivial Keplerian fit attempt), and (2) root mean square (RMS) exceeding 15 m s−1 (about three times the typical jitter for these stars). We performed initial searches on those targets using a genetic algorithm to fit a single Keplerian orbit. If this resulted in a mass detection of at least 3σ with no large phase gaps, then we performed more detailed fits including a full MCMC parameter determination. Table 1, divided into substellar and stellar-mass candidates, gives the best-fitting parameters as derived from RadVel (Fulton et al. 2018). We emphasize that at this time we cannot claim these objects to be confirmed companions, and we show these example fits merely to guide future follow-up efforts. Figs 1–3 show the data and the best fits for those where a plausible unique orbital solution could be obtained. Candidate minimum masses (m sin i) were derived from the host-star masses as presented in Wittenmyer et al. (2016d), which presented complete spectroscopic stellar parameters for the PPPS sample.
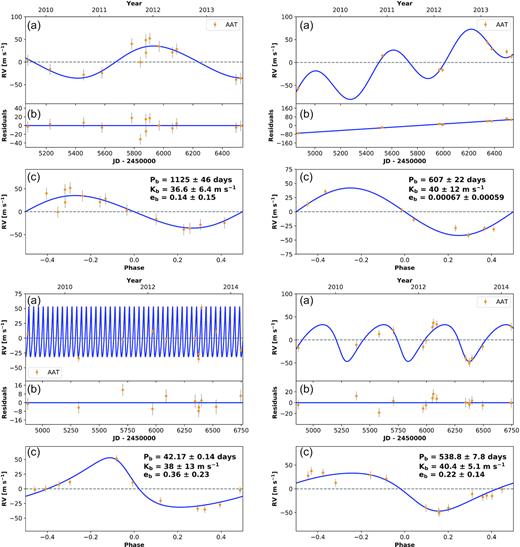
Data and model fits for candidates from the PPPS. The fits shown are tentative and require further observations to be confirmed. Clockwise from top left: HD 6037, HD 13652 (RV trend included), HD 114899, and HD 126105. For each candidate, we show the time series and phase-folded fits.
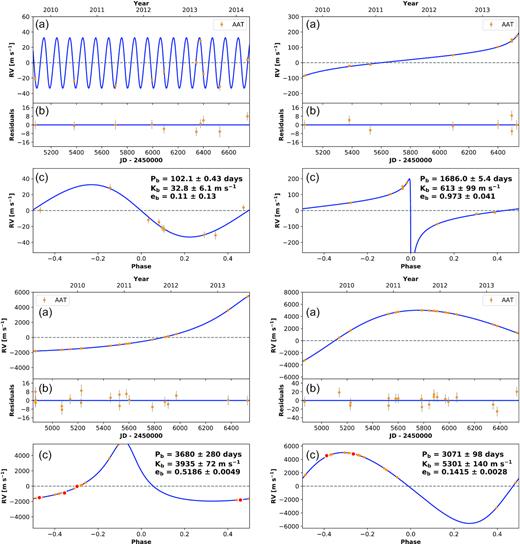
Data and model fits for candidates from the PPPS. The fits shown are tentative and require further observations to be confirmed. Clockwise from top left: HD 159743, HD 205577, HD 37763, and HD 43429. For each candidate, we show the time series and phase-folded fits.
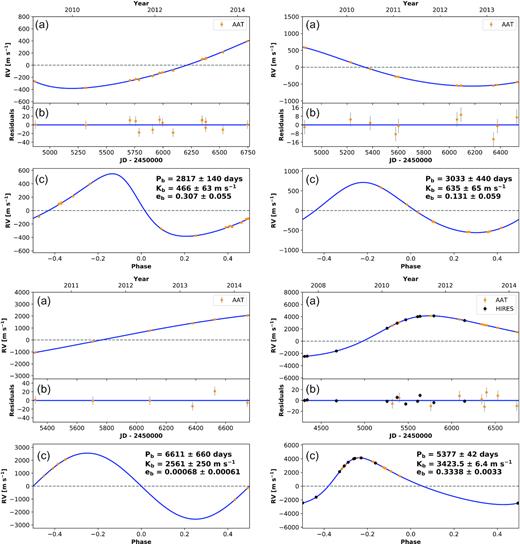
Data and model fits for candidates from the PPPS. The fits shown are tentative and require further observations to be confirmed. Clockwise from top left: HD 115066, HD 121156, HD 142132, and HD 145428. For each candidate, we show the time series and phase-folded fits.
Orbital solutions for candidate companions.
| Period | Eccentricity | ω | Tc | K | m sin i | a | |
|---|---|---|---|---|---|---|---|
| Host | days | degrees | BJD-2400000 | m s−1 | MJup | au | |
| HD 6037 | 1125|$^{+47}_{-44}$| | 0.1|$^{+0.2}_{-0.1}$| | 354|$^{+229}_{-206}$| | 55112|$^{+71}_{-66}$| | 36.6|$^{+6.8}_{-6.1}$| | 2.4 ± 0.5 | 2.39 ± 0.07 |
| HD 13652 | 607 ± 22 | 0.0 (fixed) | 0.0 (fixed) | 54533|$^{+62}_{-63}$| | 40|$^{+11}_{-12}$| | 1.9 ± 0.7 | 1.51 ± 0.05 |
| HD 114899 | 42.17 ± 0.14 | 0.36|$^{+0.25}_{-0.2}$| | 52|$^{+74}_{-57}$| | 55097.7|$^{+5.6}_{-4.4}$| | 38|$^{+10}_{-15}$| | 0.8 ± 0.2 | 0.272 ± 0.003 |
| HD 126105 | 538.8|$^{+7.6}_{-7.9}$| | 0.22|$^{+0.15}_{-0.13}$| | 129|$^{+37}_{-44}$| | 55204|$^{+26}_{-24}$| | 40.4|$^{+5.4}_{-4.9}$| | 1.55 ± 0.35 | 1.33 ± 0.02 |
| HD 159743 | 102.1|$^{+0.47}_{-0.40}$| | 0.12|$^{+0.18}_{-0.08}$| | 29|$^{+178}_{-281}$| | 55063.7|$^{+5.0}_{-6.7}$| | 32.8|$^{+5.8}_{-6.4}$| | 0.96 ± 0.19 | 0.484 ± 0.007 |
| HD 205577 | 1685.98|$^{+11.0}_{-0.09}$| | 0.972|$^{+0.08}_{-0.002}$| | 127|$^{+16}_{-80}$| | 48155|$^{+57}_{-51}$| | 613|$^{+47}_{-150}$| | 9.3 ± 2.3 | 2.87 ± 0.05 |
| HD 37763 | 3680|$^{+330}_{-240}$| | 0.52 ± 0.01 | 13 ± 3 | 53241|$^{+200}_{-270}$| | 3935|$^{+82}_{-62}$| | 262 ± 20 | 5.1 ± 0.3 |
| HD 43429 | 3071|$^{+96}_{-100}$| | 0.142 ± 0.003 | 248 ± 5 | 53651|$^{+81}_{-77}$| | 5301|$^{+140}_{-150}$| | 456 ± 29 | 5.0 ± 0.1 |
| HD 115066 | 2817 ± 140 | 0.31|$^{+0.06}_{-0.05}$| | 53|$^{+5}_{-6}$| | 54610|$^{+45}_{-53}$| | 466|$^{+78}_{-47}$| | 35 ± 7 | 4.2 ± 0.2 |
| HD 121156 | 3033|$^{+470}_{-420}$| | 0.13|$^{+0.07}_{-0.05}$| | 345|$^{+28}_{-14}$| | 55280|$^{+37}_{-67}$| | 635|$^{+82}_{-48}$| | 54 ± 11 | 4.6 ± 0.4 |
| HD 142132 | 6611|$^{+720}_{-600}$| | 0.0 (fixed) | 0.0 (fixed) | 59063|$^{+300}_{-250}$| | 2561|$^{+270}_{-220}$| | 277 ± 47 | 8.0 ± 0.5 |
| HD 145428 | 5377 ± 42 | 0.334 ± 0.003 | 309.3 ± 0.4 | 46270 ± 80 | 3423.5|$^{+6.6}_{-6.3}$| | 336 ± 3 | 7.10 ± 0.11 |
For those stars with potential stellar-mass companions, we checked the Gaia DR2 results for astrometric or RV signatures of hidden massive bodies. The results of that search are summarized in Table 2. The lower section of Table 2 gives the Gaia DR2 notes for the 12 stars in the PPPS sample, which show large (km s−1) RV variations indicative of stellar-mass companions, but for which we have too few observations to attempt an orbital solution. For nearby stars, high-contrast imaging can resolve the influencing body, yielding better constraints on the system parameters (e.g. Crepp et al. 2012; Rodigas et al. 2016; Kane et al. 2019b), even when the object is not seen (e.g.Hirsch et al. 2019; Kane et al. 2019a). However, with our targets generally falling at distances of 150–300 pc, we do not expect that any stellar companions could typically be resolved in Gaia imaging, though we note that HD 110238 has a Gaia detected companion with common proper motion, which is the likely cause of the observed large-amplitude radial velocity variation in our PPPS data. For the very bright stars considered here (G < 8), the expected Gaia RV precision is typically better than about 0.4 km s−1 (Katz et al. 2019). Stars exhibiting significantly higher uncertainties in their measured absolute radial velocity may indicate binarity. We flag here those stars with RV errors more than 3σ too large. We have begun additional monitoring of the candidates in Table 1 as a ‘PPPS Legacy’ program with the minerva-Australis dedicated telescope array (Wittenmyer et al. 2018; Addison et al. 2019). For these bright stars and large candidate signals, minerva-Australis is easily able to obtain new precise RV measurements (e.g. Nielsen et al. 2019; Vanderburg et al. 2019) over the coming years to clarify the nature of these objects.
Gaia DR2 notes on potential stellar-mass companions.
| Star | m sin i | Notes |
|---|---|---|
| M⊙ | ||
| HD 37763 | 0.29 | No excess astrometric noise |
| HD 43429 | 0.62 | 54.7σ excess astrometric noise |
| HD 142132 | 0.30 | No excess astrometric noise |
| HD 145428 | 0.38 | No excess astrometric noise |
| HD 5676 | – | No excess astrometric noise |
| HD 11653 | – | No excess astrometric noise |
| HD 14791 | – | 55.5σ excess astrometric noise |
| HD 51268 | – | No excess astrometric noise |
| HD 84070 | – | 349.6σ excess astrometric noise |
| HD 104819 | – | Gaia RV error 5σ too large. 46.7σ excess astrometric noise |
| HD 110238 | – | Gaia RV error 8.3σ too large. CPM companion at |$\Delta \, G=8.9$| |
| HD 124087 | – | No excess astrometric noise |
| HD 166309 | – | No excess astrometric noise |
| HD 181809 | – | Gaia RV error 7.9σ too large. |
| HD 204057 | – | Gaia RV error 11σ too large. |
| HD 222768 | – | Gaia RV error 4.1σ too large. |
4 DETECTION LIMITS
Often overshadowed by discoveries, the use of observational data to determine what was not found is of at least equal importance to the advancement of our understanding of exoplanetary populations. Previous work in this area has had the luxury of large amounts of data, derived from legacy RV surveys where it was eminently reasonable to impose minimum thresholds for the number of observations. Traditional injection-recovery tests have usually set a minimum of N ∼30 RV data points to derive reliable detection limits (e.g. Wittenmyer et al. 2006; Cumming et al. 2008; Wittenmyer et al. 2011a). Similar efforts to derive detectabilities and occurrence rates from space-based photometry, such as that obtained by the Kepler mission, can make use of many thousands of observations to compute a sensitivity function (e.g. Christiansen et al. 2012, 2016; Coughlin et al. 2016; Zink, Christiansen & Hansen 2019). However, the field of radial velocity exoplanet detection is littered with the desiccated husks of surveys cut short before large quantities of data were obtained. In this section, we describe our efforts to glean useful constraints on the planets that can be excluded by our PPPS data. The median number of RV epochs in the PPPS data considered here is 8. Traditional periodogram approaches used to recover injected signals simply fail in this sparse regime.
4.1 Techniques
Meunier, Lagrange & De Bondt (2012) compared the performance of several detection limit methods on RV data sets from 10 stars with a variety of properties. Of interest for the present work are two methods which do not rely on the use of periodograms. First is the RMS method, based on the principles outlined in Galland et al. (2005) and reprised briefly in Meunier et al. (2012). For 1000 trial phases of a simulated planetary RV signal with a given period and mass (i.e. an RV amplitude, K), we ask whether the RMS of the simulated RV data (that of a planetary orbit sampled at the timestamps of the real data) is greater than the RMS of the original data. If all 1000 such realizations give an RMS higher than the real data, then we say that planetary signal is excluded by the data at 99.9 per cent confidence. Second is the F-test method, which is at its core an injection-recovery approach, except that the criterion for determining whether a signal is detectable is the F-test rather than a periodogram. We add a simulated planetary RV signal to the data, then perform an F-test to ask whether the two data sets (original and with added planetary signal) are significantly different at a 99.9 per cent confidence level. For both of these tests, we use injected signals on circular orbits with 100 trial periods from 2 to 3000 d, 100 values of orbital phase, and with RV amplitudes, K, from 1 to 200 m s−1. The artificial signals are added to the existing RV data to capture the noise properties of each individual star. For all stars, we fitted and removed any Keplerian signals from confirmed or suspected objects (Table 1). The amplitude is increased until the required fraction of signals are deemed detected by the criteria described above. We test six recovery rates: 99, 90, 70, 50, 30, and 10 per cent. This is identical to the approach in our previous work (e.g. Wittenmyer et al. 2010; Wittenmyer & Marshall 2015; Wittenmyer et al. 2016c), which used the generalized Lomb–Scargle periodogram (Zechmeister & Kürster 2009) as a detection criterion.
Recognizing that these two techniques are quite different from the well-tested periodogram approach of our previous work, we wish to check for any systematic differences between the RMS test and F-test against the ‘standard’ detection criterion. We seek to determine which of these two methods delivers results consistent with the periodogram method. To do so, we bring both techniques to bear on the Anglo-Australian Planet Search data set that was used in Wittenmyer et al. (2016c) to assess the occurrence rate of Jupiter analogues. We use the full RV data set for the 203 stars examined in that work, and apply both the RMS test and F-test to derive detection limits for 100 trial periods between 2 and 3000 d as described above. Each trial period produces an RV amplitude that is recovered at the 99 per cent level. For each star, we then compute the mean of these 100 RV amplitudes over all periods as the 99 per cent detection limit |$\bar{K}$|. To compare the consistency of the various techniques, we then examine the ratio of |$\bar{K}$| as derived from the periodogram test (Wittenmyer et al. 2016c) to the values of |$\bar{K}$| obtained for that same RV data set using the RMS and F-tests. Fig. 4 shows the distribution of those ratios. As shown in the left-hand panel of Fig. 4, the F-test method delivers results that are more consistent, i.e. the distribution is more normal, with a mean ratio of approximately 1. We therefore adopt the F-test method for all analysis of detection limits in this work.
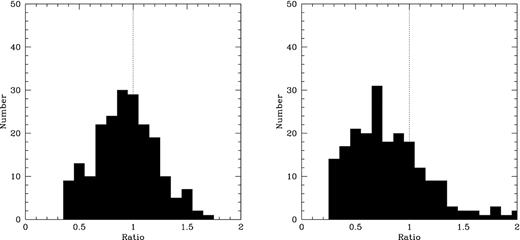
Left: Ratio of mean K detectable from the F-test method versus the periodogram method from our prior work. Right: Same, but for the RMS method. The F-test method delivers more consistent results and is adopted for our further analysis.
4.2 Occurrence rate of planets around evolved stars
To determine the underlying occurrence rate of planets around the low-luminosity giants in our sample, we follow the procedure established in our previous work on occurrence rates (e.g. Wittenmyer et al. 2011a, b, 2016c). That is, we correct the number of secure detections for the survey incompleteness, to account for planets that may have been missed. One key difference in this work is that our PPPS sample has some overlap with the EXPRESS survey of Jones et al. (2011), and in recent years, we have combined efforts to detect planets that our individual data sets could not. In this section, we consider only those 85 PPPS stars that do not overlap with the EXPRESS targets; the common stars will be considered in a separate analysis (Wolthoff et al., in preparation) combined with data from the Lick programme (Reffert et al. 2015).
We note in passing that before performing the injection-recovery tests, we removed the tentative Keplerian signals presented in Table 1 from the RV data for those 12 stars. If we do not remove those candidate signals, it is clear that the resulting detection limit will be inflated. Particularly, for the six stellar-mass candidates, the result becomes essentially useless as the scatter of the original data is of the order of hundreds of m s−1. As per the techniques presented here (equation 1), those stars then contribute virtually zero detectability information to the sample, and hence the occurrence rates derived from the overall sample will be inflated to reflect the increased number of ‘missed planets’. The result, in turn, is a higher (but consistent) occurrence rate with larger uncertainties: 9.2|$^{+10.8}_{-3.9}$| per cent.
5 SUMMARY AND CONCLUSION
Early estimates of the overall planet occurrence rate for evolved intermediate-mass stars suggested that ∼9 per cent of such stars should host a Jupiter-mass planet (Johnson et al. 2007b). The data examined here are not of sufficient quantity or quality to consider the detection of lower mass planets, and so we restrict our discussion to giant planets (m sin i ≳0.5 MJup) with orbital periods less than 5 yr. Despite this restriction, our result is in broad agreement with that of Johnson et al. (2007b), and with the 8.5 ± 1.3 per cent giant-planet occurrence rate for such planets orbiting main-sequence stars, as derived by Cumming et al. (2008).
For some time, an observed paucity of giant planets with a ≲0.5 au orbiting evolved stars has been a subject of interest (e.g. Bowler et al. 2010; Johnson et al. 2010a; Wittenmyer et al. 2015b). The main question has been whether the populations of such close-in planets are different between main-sequence A stars and those ‘retired’ A stars as we have examined in the PPPS and other surveys (e.g. Villaver & Livio 2009; Villaver et al. 2014; Veras 2016). Zhou et al. (2019) examined the occurrence rates of hot Jupiters orbiting main-sequence AFG-type stars (spanning the host-star mass range of the PPPS sample: Wittenmyer et al. 2016d), and derived a rate of 0.41 ± 0.10 per cent, consistent with the occurrence rate for solar-type hosts (Deleuil et al. 2018; Petigura et al. 2018). Though our PPPS sample is limited, we do achieve relatively high completeness for hot Jupiters (P < 10 d); with zero detections, the binomial theorem yields an upper limit of 2.7 per cent, which is in agreement with the result of Zhou et al. (2019) for main-sequence AFG stars (from which the PPPS population is presumed to have evolved).
The sample considered here, of the 85 PPPS stars that are not in common with other surveys, contained only three confirmed exoplanet detections. When the PPPS is considered as a whole, the survey yielded a further 11 planet hosts amongst the 37 stars in common with the EXPRESS survey. If we were to include those stars in the analysis described in this work, we would instead derive an overall planet occurrence rate of 31.5|$^{+12.2}_{-8.2}$| per cent, which would be consistent with the Bowler et al. (2010) result of 26|$^{+9}_{-8}$| per cent resulting from seven detections among 28 subgiant stars. We also note that the next Gaia data release, which is expected to include full astrometric orbital solutions, may serve to clarify the nature of the seven large-amplitude signals presented in Table 1, and may also resolve the mysteries of the sparsely observed objects in Table 2.
Taken in concert with other works, our results highlight once again the critical importance of exoplanet surveys with long temporal baselines in driving our understanding of the occurrence of planets moving on long-period orbits. As current and future radial velocity surveys (such as minerva-Australis) begin to take up the reins from the previous generation (such as the Anglo-Australian Planet Search and the PPPS), and as the astrometric results from Gaia become available, we should finally begin to uncover the true diversity of planets moving on longer period orbits. Those results will help us to place our own planetary system in context – revealing the presence of Jupiter and Saturn analogues, and eventually the abundance of ice giants, like Uranus and Neptune. By studying evolved stars, and stars both more massive and smaller than our Sun, we will learn the degree to which the Solar system is an unusual product of its environment, or is instead typical of the myriad planetary systems in our galaxy.
SUPPORTING INFORMATION
Table A1. Complete AAT radial velocity results.
Please note: Oxford University Press is not responsible for the content or functionality of any supporting materials supplied by the authors. Any queries (other than missing material) should be directed to the corresponding author for the article.
ACKNOWLEDGEMENTS
We acknowledge the traditional owners of the land on which the AAT stands, the Gamilaraay people, and pay our respects to elders past and present. This material is based upon work supported by the National Science Foundation under Grant Nos. 1559487 and 1559505. This research has made use of NASA’s Astrophysics Data System (ADS), and the SIMBAD data base, operated at CDS, Strasbourg, France.
REFERENCES
APPENDIX A: SOME EXTRA MATERIAL
Complete AAT radial velocity results. The full version of this table is available online.
| Star | BJD | RV (m s−1) | Uncertainty (m s−1) |
|---|---|---|---|
| HD100939 | 2454868.10568 | −97.90 | 2.46 |
| HD100939 | 2455969.15781 | −8.99 | 2.14 |
| HD100939 | 2456376.00168 | 12.65 | 2.32 |
| HD100939 | 2456399.99654 | 14.99 | 2.24 |
| HD100939 | 2456745.08010 | 0.00 | 2.29 |
| HD103047 | 2454869.23069 | −209.69 | 2.24 |
| HD103047 | 2455971.08663 | −9.80 | 1.96 |
| HD103047 | 2456059.99580 | 11.14 | 4.41 |
| HD103047 | 2456345.08543 | 108.65 | 2.52 |
| HD103047 | 2456377.03895 | 115.52 | 2.38 |
Summary of dispositions for PPPS targets. Double-lined binary stars (SB2) cannot be used for radial velocity determination, and are reported as having zero observations.
| Star | Nobs | Comments |
|---|---|---|
| 224910 | 8 | – |
| 749 | 0 | SB2 |
| 1817 | 14 | – |
| 4145 | 9 | Linear trend, +15.7 ± 0.4 m s−1 yr−1 |
| 5676 | 6 | Stellar-mass candidate (Table 2) |
| 5873 | 0 | SB2 |
| 5877 | 0 | SB2 |
| 6037 | 14 | Substellar candidate (Table 1) |
| 7931 | 5 | – |
| 9218 | 24 | – |
| 9925 | 5 | – |
| 10731 | 6 | – |
| 11343 | 6 | Planet, Jones et al. (2016) |
| 11653 | 3 | Stellar-mass candidate (Table 2) |
| 12974 | 3 | – |
| 13471 | 7 | – |
| 13652 | 8 | Substellar candidate (Table 1) |
| 14805 | 6 | – |
| 14791 | 4 | Stellar-mass candidate (Table 2) |
| 15414 | 5 | – |
| 19810 | 3 | – |
| 20035 | 0 | SB2 |
| 20924 | 13 | – |
| 24316 | 7 | – |
| 25069 | 15 | – |
| 28901 | 15 | – |
| 29399 | 22 | Strong activity cycle, Wittenmyer et al. (2017a) |
| 31860 | 0 | SB2 |
| 34851 | 9 | Binary, Wittenmyer et al. (2016a) |
| 33844 | 20 | Planets, Wittenmyer et al. (2016b) |
| 37763 | 20 | Stellar-mass candidate (Table 1) |
| 39281 | 13 | – |
| 40409 | 27 | Linear trend, −23.0 ± 0.2 m s−1 yr−1 |
| 43429 | 20 | Stellar-mass candidate (Table 1) |
| 46122 | 0 | SB2 |
| 46262 | 16 | – |
| 47141 | 14 | – |
| 47205 | 27 | Planet, Wittenmyer et al. (2011c) |
| 51268 | 16 | Stellar-mass candidate (Table 2) |
| 58540 | 0 | SB2 |
| 59663 | 11 | – |
| 67644 | 12 | – |
| 72467 | 12 | – |
| 76321 | 0 | SB2 |
| 76437 | 15 | Linear trend, +6.5 ± 0.3 m s−1 yr−1 |
| 76920 | 17 | Planet, Wittenmyer et al. (2017b) |
| 80275 | 8 | Linear trend, +14.6 ± 0.4 m s−1 yr−1 |
| 81410 | 0 | SB2 |
| 84070 | 7 | Stellar-mass candidate (Table 2) |
| 85128 | 8 | – |
| 85035 | 24 | – |
| 86359 | 6 | – |
| 87089 | 9 | Quadratic trend |
| 86950 | 20 | Planet, Wittenmyer et al. (2017a) |
| HIP50638 | 9 | – |
| 94386 | 14 | Binary, Wittenmyer et al. (2016a) |
| 95900 | 10 | – |
| 98516 | 16 | – |
| 98579 | 0 | SB2 |
| 100939 | 5 | Planet, Jones et al. (in preparation) |
| 103047 | 5 | – |
| 104358 | 12 | Binary, Wittenmyer et al. (2016a) |
| 104704 | 6 | Linear trend, +9.2 ± 0.4 m s−1 yr−1 |
| 104819 | 3 | Stellar-mass candidate (Table 2) |
| 105096 | 9 | Quadratic trend |
| 105811 | 9 | Binary, (Bluhm et al. 2016) |
| 106314 | 11 | – |
| 108991 | 16 | – |
| 109866 | 9 | – |
| 110238 | 5 | Stellar-mass candidate (Table 2) |
| 114899 | 11 | Substellar candidate (Table 1) |
| 115066 | 15 | Stellar-mass candidate (Table 1) |
| 115202 | 20 | – |
| 117434 | 3 | – |
| 121056 | 19 | Planets, Wittenmyer et al. (2015a) |
| 121156 | 10 | Stellar-mass candidate (Table 1) |
| 121930 | 10 | – |
| 124087 | 7 | Stellar-mass candidate (Table 2) |
| 125774 | 7 | – |
| 126105 | 15 | Substellar candidate (Table 1) |
| 130048 | 13 | – |
| 131182 | 5 | – |
| 132396 | 16 | – |
| 133166 | 0 | SB2 |
| 133670 | 16 | – |
| 134443 | 7 | – |
| 134692 | 7 | – |
| 135760 | 13 | Planet, Jones et al. (2016) |
| 135872 | 3 | Linear trend, +40.5 ± 1.4 m s−1 yr−1 |
| 136295 | 15 | Planet, Jones et al. (in preparation) |
| 137115 | 3 | – |
| 137164 | 0 | SB2 |
| 136135 | 5 | Quadratic trend |
| 138061 | 4 | – |
| 138716 | 18 | – |
| 138973 | 4 | Quadratic trend |
| 142132 | 6 | Stellar-mass candidate (Table 1) |
| 142384 | 0 | SB2 |
| 143561 | 5 | – |
| 144073 | 7 | – |
| 145428 | 9 | Stellar-mass candidate, Luhn et al. (2019) and Table 1 |
| 148760 | 13 | Quadratic trend |
| 153438 | 0 | SB2 |
| 154250 | 7 | – |
| 155233 | 21 | Planet, Wittenmyer et al. (2016a) |
| 154556 | 12 | – |
| 159743 | 10 | Substellar candidate (Table 1) |
| 162030 | 20 | – |
| 166309 | 5 | Stellar-mass candidate (Table 2) |
| 166476 | 4 | Linear trend, +15.1 ± 0.5 m s−1 yr−1 |
| 170707 | 4 | Planet, Jones et al. (in preparation) |
| 170286 | 8 | – |
| 173902 | 16 | Quadratic trend |
| 176002 | 10 | – |
| 175304 | 4 | – |
| 177897 | 7 | – |
| 176794 | 0 | SB2 |
| 181342 | 5 | Planet, Jones et al. (2016) |
| 181809 | 7 | Stellar-mass candidate (Table 2) |
| 188981 | 16 | Binary, Wittenmyer et al. (2016a) |
| 191067 | 6 | – |
| 196676 | 6 | Quadratic trend |
| 199809 | 4 | Linear trend, +23.0 ± 0.4 m s−1 yr−1 |
| 200073 | 14 | Linear trend, +74.1 ± 0.3 m s−1 yr−1 |
| 201931 | 11 | – |
| 204073 | 11 | – |
| 204057 | 3 | Stellar-mass candidate (Table 2) |
| 204203 | 0 | SB2 |
| 205577 | 8 | Substellar candidate (Table 1) |
| 205972 | 7 | – |
| 208431 | 6 | – |
| 208791 | 4 | – |
| 208897 | 3 | – |
| 214573 | 12 | – |
| 216640 | 21 | – |
| 218266 | 6 | – |
| 219553 | 9 | Planet, Jones et al. (in preparation) |
| 222076 | 11 | Planet, Wittenmyer et al. (2017a) |
| 222768 | 3 | Stellar-mass candidate (Table 2) |
| 223301 | 5 | – |
| 223860 | 4 | – |
