


ABSTRACT
We present observations from X-ray to mid-infrared wavelengths of the most energetic non-quasar transient ever observed, AT2021lwx. Our data show a single optical brightening by a factor >100 to a luminosity of 7 × 1045 erg s−1 and a total radiated energy of 1.5 × 1053 erg, both greater than any known optical transient. The decline is smooth and exponential and the ultraviolet–optical spectral energy distribution resembles a blackbody with a temperature of 1.2 × 10⁴ K. Tentative X-ray detections indicate a secondary mode of emission, while a delayed mid-infrared flare points to the presence of dust surrounding the transient. The spectra are similar to recently discovered optical flares in known active galactic nuclei but lack some characteristic features. The lack of emission for the previous 7 yr is inconsistent with the short-term, stochastic variability observed in quasars, while the extreme luminosity and long time-scale of the transient disfavour the disruption of a single solar-mass star. The luminosity could be generated by the disruption of a much more massive star, but the likelihood of such an event occurring is small. A plausible scenario is the accretion of a giant molecular cloud by a dormant black hole of 108–109 solar masses. AT2021lwx thus represents an extreme extension of the known scenarios of black hole accretion.
1 INTRODUCTION
The accretion of matter on to supermassive black holes (SMBHs) is the most efficient known process of extracting energy in the Universe, with general relativistic effects combined with complex magnetohydrodynamics and highly non-thermal radiative processes causing spectacular electromagnetic phenomena. This accretion can happen at a widely varying range of rates: steadily accreting SMBHs, called active galactic nuclei (AGNs), are the central engines of galaxies, which accrete gas for Myr at a time with a rate that typically varies on time-scales of seconds to years (e.g. McHardy et al. 2006; Scaringi et al. 2015).
As opposed to typical variability of AGNs caused by stochastic accretion, tidal disruption events (TDEs; Hills 1975; Rees & Ostriker 1977) represent a much shorter, yet far more violent accretion episode. These phenomena are caused by the destruction of a star in the vicinity of an SMBH (or intermediate-mass black hole; Angus et al. 2022; Yao et al. 2023) due to tidal forces. TDEs usually reveal themselves through a single flare observed in optical/ultraviolet (UV)/X-rays with a smooth rise and decaying light curve. Not all SMBHs are equally likely to produce a TDE: for SMBHs with masses |$M_\mathrm{BH}\gtrsim 10^{8}\, \mathrm{M_\odot }$|, the tidal radius of a solar-mass star lies within the innermost stable circular orbit (ISCO) of the black hole, which suppresses or completely prohibits TDEs (the exact limit depends on stellar type and SMBH spin). Indeed, observed or model-inferred masses of TDEs suggest |$M_\mathrm{BH} \sim 5\times 10^{5}\text{ to }10^{7}\, \mathrm{M_\odot }$| and |$M_* \sim 0.6\!-\!13\, \mathrm{M_\odot }$| (Mockler, Guillochon & Ramirez-Ruiz 2019; Ryu, Krolik & Piran 2020), though the high end of this stellar mass range is highly uncertain. TDEs display broad emission lines, often of hydrogen and/or helium, and many show ionized iron and Bowen fluorescence lines of nitrogen and oxygen (e.g. Arcavi et al. 2014; Leloudas et al. 2019; van Velzen et al. 2021), indicative of the presence of a UV-bright accretion disc.
The clear differences between regular AGN variability and TDEs are muddied by the addition of recently discovered changing-look AGNs (CLAGNs; LaMassa et al. 2015) and SMBH ‘reignitions’ (Trakhtenbrot et al. 2019). CLAGNs tend to exhibit changes in their spectral properties such as line widths and continuum slopes (Komossa et al. 2022), sometimes accompanied by X-ray outbursts and a change in optical brightness but critically while maintaining their usual variable optical light curve. On the other hand, reignitions and flares appear as a single highly luminous optical transient (Kankare et al. 2017; Gromadzki et al. 2019; Trakhtenbrot et al. 2019; Frederick et al. 2021). The spectra of these flares, which are often found in narrow-line Seyfert 1 (NLSy1) host galaxies, show ubiquitous hydrogen Balmer emission lines as well as many of the same helium and Bowen features of TDEs (Frederick et al. 2021), although the line profiles (particularly of hydrogen) tend to be narrower. While the high luminosity of the flares necessitates a large amount of material being accreted, the exact nature remains a mystery, with various sources labelled as possible abnormal TDEs or sudden changes in the accretion flow of already-accreting SMBHs.
Here, we present multiwavelength observations of AT2021lwx, the most luminous of such flares ever detected. AT2021lwx, at z = 0.9945, displays properties spanning TDEs, SMBH flares, and AGNs, while unlike all of those classes there is no host galaxy visible to deep limits in pre-outburst survey data. Our observations (Section 2) span nearly 3 yr and from mid-infrared (MIR) to X-ray wavelengths. We present details of our photometric (Section 3) and spectroscopic (Section 4) modelling, motivating our discussion of the potential scenarios of the event (Section 5), after which we conclude by interpreting AT2021lwx as an accretion of a non-stellar, gaseous object on to a large SMBH.
Throughout the paper, we use ‘days’ to refer to the observer frame and ‘d’ for the rest frame at z = 0.9945. All photometry is corrected for Galactic foreground extinction according to Schlafly & Finkbeiner (2011) assuming a Fitzpatrick (1999) extinction curve. Magnitudes are presented in the AB system (Oke & Gunn 1983). Upper limits are reported at the 3σ level, while uncertainties are 1σ. Where necessary, we assume a spatially flat Lambda cold dark matter cosmological model with H0 = 70 km s−1 Mpc−1 and ΩM = 0.3.
2 OBSERVATIONS
AT2021lwx was discovered as a transient in Zwicky Transient Facility (ZTF; Bellm et al. 2019; Graham et al. 2019) imaging on 2021 April 13. Forced photometry revealed it to have been brightening since at least 2020 June 16 as ZTF20abrbeie. It was independently detected by the Asteroid Terrestrial-impact Last Alert System (ATLAS; Tonry et al. 2018; Smith et al. 2020) as ATLAS20bkdj and by the Panoramic Survey Telescope and Rapid Response System (Pan-STARRS; Chambers et al. 2016; Wainscoat et al. 2016) as PS22iin. AT2021lwx was twice observed by the extended Public ESO Spectroscopic Survey for Transient Objects ‘plus’ (ePESSTO+; Smartt et al. 2015) and was classified as an AGN at z = 0.995 (Grayling et al. 2022). In this section, we describe photometric observations of AT2021lwx at X-ray, UV, optical, and near- and mid-infrared wavelengths, which are summarized in Table 1 and Fig. 1. Times t are given in the rest frame at z = 0.9945 with respect to maximum light, which we take as the date of the brightest r-band observation: MJD 59291.
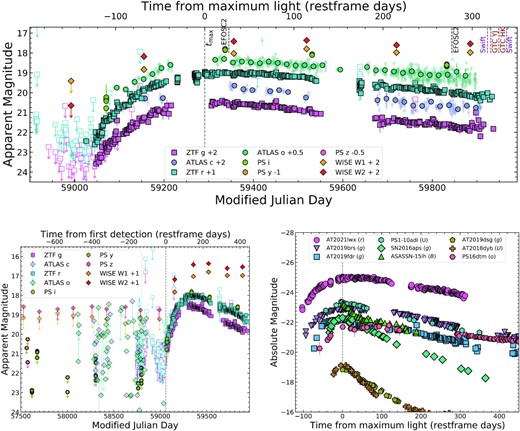
(Upper) Light curve of AT2021lwx. Epochs of our multiwavelength follow-up observations are marked with dashed lines. (Lower left) Pan-STARRS upper limits up to 750 d (rest frame) before the first detection of AT2021lwx. (Lower right) Comparison to similar transients: NLSy1 accretion events AT2019fdr and AT20219brs (Frederick et al. 2021) and the prototype nuclear flare PS1-10adi (Kankare et al. 2017); the most luminous known likely TDE ASASSN-15lh (Leloudas et al. 2016); the most luminous known supernova SN2016aps (Nicholl et al. 2020); a (possibly jetted) TDE AT2019dsg (van Velzen et al. 2021); a typical TDE AT2018dyb (Leloudas et al. 2019); and the MIR-brightening TDE PS16dtm (Petrushevska et al. 2023).
Summary of the multiwavelength observations of AT2021lwx.
| MJD | Epoch | Instrument | Bands |
|---|---|---|---|
| (rest frame d) | |||
| Photometry | |||
| 58750–59937 | −271 to +323 | ZTF | g, r |
| 58113–59908 | −590 to +309 | ATLAS | c, o |
| 56803–59885, | −1247 to +298, | WISE | W1, W2 |
| 59923, 59966 | +317, +338 | Swift UVOT | uvw2, uvm2, |
| uvw1, u, b, v | |||
| X-ray | |||
| 59923, 59966 | +317, +338 | Swift XRT | 0.3–10 keV |
| Spectroscopy | |||
| 59345, 59844 | +27, +277 | NTT EFOSC2 | 3685–9315 Å |
| 59931 | +320 | GTC EMIR | 0.85–1.35 |$\mu$|m |
| 59949 | +329 | GTC EMIR | 1.45–2.42 |$\mu$|m |
2.1 Optical photometry
The optical light curve is compiled using photometry from publicly available ZTF g- and r-band photometry,1 which we obtained via the ZTF forced photometry service (Masci et al. 2019). In addition, we obtained ATLAS c (‘cyan’, 4200–6500 Å) and o (‘orange’, 5600–8200 Å) imaging over the course of the light curve. The region was also covered infrequently as part of the ongoing Pan-STARRS Near Earth Object search that provides grizy coverage. Data from both ATLAS and Pan-STARRS were obtained as forced photometry2 (Smith et al. 2020).
To search for a host galaxy, we use the stacked grizy images from the Pan-STARRS 3π survey (Waters et al. 2020). We use the photutils package and perform photometry in a circular aperture with a 1 arcsec radius centred on the location of AT2021lwx, and use the PS1 weight image to estimate the photometric uncertainties.
2.2 Mid-infrared photometry
The location of AT2021lwx was observed by the Wide-field Infrared Survey Explorer (WISE) spacecraft as part of the NEOWISE reactivation mission (Mainzer et al. 2011). We obtained NEOWISE photometry in the W1 and W2 bands from the NASA/IPAC infrared science archive (IRSA).3Observations of the location exist with a 6 month cadence from several years before the flare until November 2021, during its decline. In particular, we highlight MJDs 58993 (pre-flare), 59156 (on the rise), 59357 (around peak), and 59520, 59720, and 59880 (during the decline). For each epoch, we use the IRSA WISE/NEOWISE coadder (Masci & Fowler 2009) to combine individual frames. We use a sigma-clipped median to estimate the background, which we subtract and perform aperture photometry in a 4 arcsec radius around the transient location, corresponding roughly to the point spread function of WISE. Before the optical transient, we find no significant detection; after the optical flare begins, there is a clear point source in both W1 and W2.
2.3 X-ray and ultraviolet observations
We obtained two epochs of observations with the Neil Gehrels Swift Observatory (Swift; Gehrels et al. 2004). The first observation took place at MJD 59923.554 (tmax + 317 d) and lasted 2670 s. The second took place at MJD 59966.483 (tmax + 338 d) and lasted 2605 s. Data were observed in photon-counting mode with the X-ray Telescope (XRT; Burrows et al. 2005), and in the uvw2 (central wavelength, 1928 Å), uvm2 (2246 Å), uvw1 (2600 Å), u (3465 Å), b (4392 Å), and v (5468 Å) filters with the Ultraviolet-Optical Telescope (UVOT; Roming et al. 2005), respectively.
The XRT data were reduced with the tasks xrtpipeline and xselect. The source and background events were extracted using a circular region of 40 arcsec and an annular ring with inner and outer radii of 60 and 110 arcsec, respectively, both centred at the position of the source. The Ancillary Response Files were created with the task xrtmkarf and the Response Matrix File (RMF), swxpc0to12s6_20130101v014.rmf, was taken from the Calibration Data base.4 Due to the low count rates, the XRT spectra were grouped to have a minimum of three counts per bin using the FTOOL grppha.
In terms of the UVOT data, we used the task UVOTIMSUM to sum all the exposures when more than one snapshot was included in each individual filter data and the task UVOTSOURCE to extract magnitudes from aperture photometry. A circular region of 5 arcsec centred at the target position was chosen for the source event and another region of 40 arcsec located at a nearby position was used to estimate the background emission.
2.4 Optical spectroscopy
Optical spectra were obtained on MJD 59345 and MJD 59844 (tmax + 27 d and tmax + 277 d, respectively) via the European Southern Observatory (ESO) as part of ePESSTO+ using the ESO Faint Object Spectrograph and Camera (EFOSC2; Buzzoni et al. 1984) on the New Technology Telescope (NTT) at ESO La Silla observatory, Chile. The first epoch consisted of a single 600 s exposure, while the second epoch consisted of two 2700 s exposures. All three spectra made use of grism13 (|$3685\!-\!9315\,$|Å, resolution |${\sim} 17\,$|Å). These spectra were reduced using the PESSTO pipeline (Smartt et al. 2015) v3.0.1.
2.5 Near-infrared spectroscopy
We observed AT2021lwx on MJD 59931 and MJD 59949 (tmax + 320 d and tmax + 329 d, respectively) with the Espectrógrafo Multiobjeto Infra-Rojo (EMIR; Balcells et al. 2000) on the 10.8 m Gran Telescopio Canarias (GTC) at Observatorio del Roque de los Muchachos, La Palma, Spain. Spectra were obtained under Director’s Discretionary Time proposal GTC05-22BDDT (PI: Müller Bravo) in long-slit mode. The first epoch made use of the YJ grism (|$0.85 \!-\! 1.35\, \mu \mathrm{m}$|, resolution |${\sim} 10\,$|Å); the second epoch used the HK grism (|$1.45 \!-\! 2.42\, \mu \mathrm{m}$|, resolution ∼20 Å).
Both epochs used a 1.0 arcsec slit. Image rectification, dark and flat fielding, sky subtraction, dither combination, and wavelength calibration were performed using PyEMIR (Pascual et al. 2010; Cardiel et al. 2019) v0.17. Cosmic rays were detected and removed using the lacosmic algorithm (van Dokkum 2001). Trace extraction was performed manually using python. Telluric features were removed by observing and subtracting the spectrum of the telluric standard star HIP104599.
3 PHOTOMETRIC PROPERTIES
The light curve of AT2021lwx (Fig. 1) peaked in the observer-frame r band on MJD 59291, 122 d after and 3 mag brighter than the first ZTF detection. The decay tends to a smooth decline of ∼0.004 mag d−1, consistent with an exponential (e−0.005t) decay, while the late-time decline is also consistent with the power law t−5/3. To measure the (pseudo-) bolometric light curve, we K-correct the observed magnitudes according to Hogg et al. (2002) by assuming a blackbody as the underlying spectral energy distribution (SED). By correcting the observed r band to the rest-frame u, we are able to compare to similar events at lower redshift. For those objects for which rest-frame light curves are not public, we estimate a K-correction to the u band by choosing the observer-frame band that is closest to u when shifted to the rest frame. We then add the correction of −log (1 + z) to account for the shortening of the wavelength range of the emission in the rest frame. The rest-frame UV peak absolute magnitude is M ∼ −25.7 mag.
3.1 Comparison to similar events
We build a comparison sample by selecting the most luminous examples of transients from a variety of observational classes, the rest-frame u-band absolute magnitude light curves of which we show in the lower right panel of Fig. 1. Our choice of objects serves two purposes: first, we search the literature for the brightest known objects of various classes; and secondly, we show typical examples of TDEs, the most likely candidate for the type of event that could produce such extreme luminosity.
The light curve and luminosity of AT2021lwx most closely resemble a handful of transients detected in known NLSy1 galaxies presented by Frederick et al. (2021), from which we select the two that display the brightest luminosity and longest time-scales, AT2019brs and AT2019fdr. To these, we add the even more luminous PS1-10adi (Kankare et al. 2017). NLSy1s are highly accreting AGNs, and the flares have been attributed to sudden enhancements of accretion rate (either due to a TDE or as increased gas flow) on to already-accreting SMBHs. At peak, AT2021lwx is nearly 2.5 times more luminous than any of those events. AT2021lwx is several orders of magnitude brighter than any known supernova (SN; De Cia et al. 2018; Angus et al. 2019; Nicholl et al. 2020). We show the most luminous, SN2016aps (Nicholl et al. 2020), which has been interpreted as a possible pulsational pair instability SN. AT2021lwx is 10 times more luminous than the extreme TDE ASASSN15-lh (Dong et al. 2016; Leloudas et al. 2016) and three times brighter (in the optical/UV) than the jetted TDE AT2022cmc (e.g. Andreoni et al. 2022; Pasham et al. 2023). We also show three further, more regular TDEs (although the class is diverse; Leloudas et al. 2019; van Velzen et al. 2021): AT2019dsg that likely includes a relativistic jet (van Velzen et al. 2021), the well-studied AT2018dyb (e.g. Leloudas et al. 2019), and the MIR-brightening PS16dtm (e.g. Petrushevska et al. 2023). AT2021lwx is 100 times brighter and decays slower than these TDEs.
3.2 Spectral energy distribution
Using the (K-corrected) UV photometry from t = 317 d, we fit the SED with a blackbody with a Levenberg–Marquardt least-squares minimization. We omit the farthest UV band, uvw2, since there is evidence in the spectrum that a strong Lyman α absorber is present. There is no ZTF or ATLAS photometry available at the epoch of the Swift observations, and we do not extrapolate in order to add them to the blackbody fit. The fit is shown in Fig. 2. We measure a blackbody colour temperature of TC = 1.2 ± 0.1 × 10⁴ K and a radius of RBB = 1.5 ± 0.3 × 1016 cm, while the t = 338 d photometry is best fitted by consistent values of TC = 1.3 ± 0.08 × 10⁴ K and RBB = 1.3 ± 0.2 × 1016 cm. By integrating the blackbody spectrum, normalized to the r-band peak brightness, we estimate the maximum pseudo-bolometric luminosity of the transient to be 7 × 1045 erg s−1, which is similar to the median luminosity of quasars (Rakshit, Stalin & Kotilainen 2020). We estimate the total energy radiated by integrating the blackbody with the simplistic assumption that the SED did not evolve over the duration of the transient. Up until December 2022 (440 rest-frame days from the onset of the event), the transient has radiated 1.5 × 1053 erg. Such a high energy release in a relatively short time is unprecedented for a transient and is usually only associated with continuously accreting SMBHs. Given that the transient becomes redder with time, this assumption likely leads to an underestimate of the peak and total bolometric luminosity.
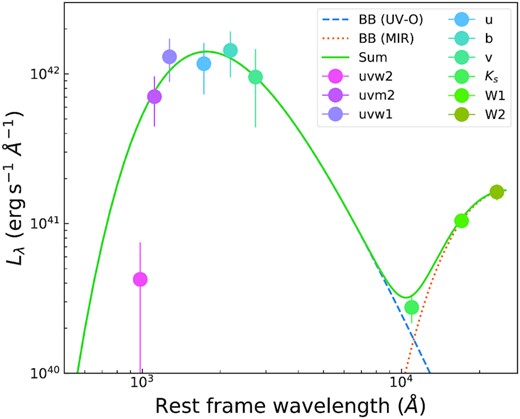
The rest-frame UV to MIR SED of AT2021lwx at +338 d. The MIR data come from +114 d and are not scaled as we do not predict their evolution. Data are corrected for MW reddening, but not for any host extinction. The uvw2 point is not included in the blackbody fit due to likely Lyman α absorption.
The XRT observations resulted in the tentative detection of X-rays in the range 0.3–10 keV. The second epoch is more significant at |$4.6 \sigma$|, while the combined significance is |$2.7 \sigma$|. Modelling the X-ray spectrum from the combined observations as a power law, we measure an observed 0.3–10 keV flux of 2.94 ± 1.59 × 10⁻¹³ erg s−1 cm−2. Correcting for Galactic neutral hydrogen column density 1021 cm−2 (HI4PI Collaboration 2016), this flux corresponds to an unabsorbed luminosity of 1.52 × 1045 erg s−1. This luminosity is far higher than expected by extrapolating the UV–optical blackbody and indicates the presence of a separate emission region. The size of the SMBH inferred from the UV–optical properties precludes the X-rays originating as thermal disc emission, while this X-ray luminosity is of similar order to the UV–optical luminosity at the same epoch. An Loptical/LX-ray ∼ 1 is consistent with late-time observations of TDEs (e.g. Gezari, Cenko & Arcavi 2017; van Velzen et al. 2019; Wevers et al. 2019).
Emission in the MIR is also not consistent with the UV–optical blackbody. It continues rising after the UV–optical starts to decline, indicative either of reprocessing by dust or from a relativistic jet. Similar effects have been seen in TDEs (e.g. van Velzen et al. 2016; Jiang et al. 2021; Onori et al. 2022; Petrushevska et al. 2023) and are interpreted as the echoes of the UV emission from a dusty ‘torus’ surrounding the SMBH. From a pseudo-bolometric luminosity of 7 × 1045 erg s−1, we follow Jiang et al. (2021) to estimate a sublimation radius of ∼400 light days, while following the K-band size–luminosity relation from GRAVITY Collaboration (2020) we predict rsub ∼ 220 ± 24 light days. This distance should be reflected in a lag between the UV–optical and MIR emission. Although the cadence is low, we estimate the MIR to have peaked around +110 d, consistent with the intrinsic scatter of the size–luminosity relation. We fit the MIR SED at the latest epoch, which is closest to the Swift photometry and GTC spectroscopy. Fitting a blackbody and including the GTC KS-band measurement, we measure a colour temperature of TC ≃ 103 K and a radius of RBB ≃ 1018 cm, again consistent with the time lags and sublimation radius predictions.
3.3 Host galaxy limits
From the aperture photometry outlined in Section 2.1, we find no significant detections in any band, leading to magnitude limits g > 23.3, r > 23.2, i > 23.1, z > 22.3, and y > 21.4. The i-band limit corresponds roughly to a rest-frame g-band absolute magnitude limit of M ≳ −21.5 mag. Assuming a mass-to-light ratio M/L = 2 results in a stellar mass upper limit of 7 × 10¹⁰ M⊙; that is, an average Milky Way (MW)-like galaxy would be marginally detected in the imaging. Galaxy stellar mass (M*) is correlated with the mass of central SMBHs. A rough MBH/M* fraction of 0.025 per cent (Reines & Volonteri 2015) implies a BH of mass |$1\times 10^{7}\, \mathrm{M}_{\odot }\lesssim M_{\mathrm{BH}} \lesssim 3\times 10^{8}\, \mathrm{M}_{\odot }$| for a galaxy with the mass of our estimated upper limit. The PS1 catalogue (Flewelling et al. 2020) contains an object located ∼3 arcsec north-west of the location of AT2021lwx (PSO 318.4511+27.4315), with r = 19.25. If we assume this object is at z = 0.9945, then the physical separation is 30.8 kpc, meaning that it is unlikely to be associated with the transient. Using the PS1 magnitudes and their uncertainties, we estimate a photometric redshift of the nearby object with EAZY (Brammer, van Dokkum & Coppi 2008) in its default configuration. We find a best-fitting photometric redshift zphot = 2.05 ± 0.1, which translates to a rest-frame UV brightness of −23 mag. This object is either a bright high-redshift galaxy, quasar, or an MW star, and is likely unrelated to AT2021lwx.
4 SPECTRAL PROPERTIES
The rest-frame UV–optical spectra of AT2021lwx (Fig. 3) are dominated by Balmer emission lines superimposed on a blue continuum that becomes redder with time. Low-ionization species common to AGNs including Mg ii and He i as well as semiforbidden C iii] and C ii] are present, but various forbidden nebular lines such as [O ii] and [O iii] are absent. The spectra are compared to similar objects in Fig. 4 and show similarities and differences to TDEs, SNe, and AGN flares. Particularly noticeable is the absence of lines indicative of Bowen fluorescence, which appear to be ubiquitous in AGN flares and are also common in TDEs. H α and H β are well represented by a two-component Gaussian profile (Fig. 5). We fit the two lines both simultaneously (although the fit is dominated by H α that lies in a much higher signal-to-noise ratio region) and independently. The broad component of H β is only marginally detected. To ensure that the broad H β component is taken into account, we fix it to the same width as that found from H α but allow the normalization to vary freely. The fit results show that the lines comprise an unresolved narrow component with full-width at half maximum (FWHM) ≃ 430 km s−1, and a broad component with FWHM 5404 km s−1, the broad component being blueshifted by ∼800 km s−1. The width and blueshift are largely dependent on the estimation of the continuum that is affected by the line corresponding to the end of the spectral coverage of the instrument. If the blueshift is confirmed, it indicates outflowing material.
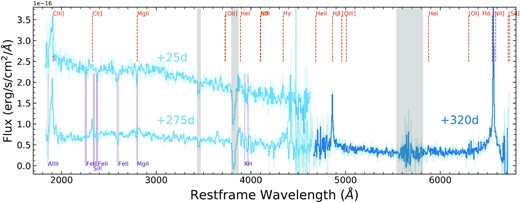
Rest-frame UV and optical spectra of AT2021lwx. For clarity, the GTC EMIR +320 d spectrum (dark blue) has been scaled to match the optical NTT EFOSC2 spectrum from +275 d. Common emission features are shown in gold, while absorption features are marked in purple. Telluric absorption has been masked in grey.
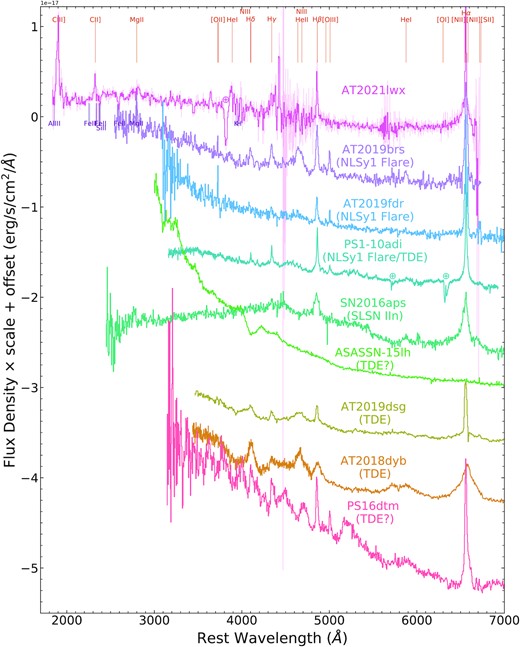
Rest-frame UV and optical spectra of AT2021lwx as well as the same objects compared in Fig. 1. Spectra have been shifted and scaled in order to provide a qualitative comparison. Telluric features are marked with ⊕. Spectra have been retrieved from the WISeREP spectral data base (Yaron & Gal-Yam 2012).
![Fits to the Balmer lines H β (left) and H α (right) in the +321 d spectrum. We also show the locations of [O iii] and [N ii]. The best-fitting [O iii] fluxes are consistent with being caused by noise, while the [N ii] lines are marginally significant.](https://oup.silverchair-cdn.com/oup/backfile/Content_public/Journal/mnras/522/3/10.1093_mnras_stad1000/1/m_stad1000fig5.jpeg?Expires=1716986088&Signature=gFqTvwbrkSonMVBvPkCtURem79s4djOx~RAn48Hw7hfe9S6wuXz~TQxIsSA2kD9bS~ZAn0isuNwP597dxVFA5dPYtsDZZTSjBXSz3izOvbvpR7zJAMdoV9z4eNXQ8SFrnTnj0JJM9RCuvnY7vIGvwLB4DVKlQylAZnKxFYWt5rbz5-1qiZMk3Ea32sVxNDlBzsvK-y04CbkbXykkjWY1UoStCpiDDIWa~oDvmg3pHm5ffjCtlXmdVPhNGubUw4rtV88rE9Z06D5ZhPtIbirwKkhi08BJ4tDr6VEF0WmNPekRCACa19v6T-9-5cMVSEZMQmXqkJhgZwcG4GrhGH6E-g__&Key-Pair-Id=APKAIE5G5CRDK6RD3PGA)
Fits to the Balmer lines H β (left) and H α (right) in the +321 d spectrum. We also show the locations of [O iii] and [N ii]. The best-fitting [O iii] fluxes are consistent with being caused by noise, while the [N ii] lines are marginally significant.
To estimate a reddening, we assume Case B recombination for narrow Balmer lines (Osterbrock 1989), with a temperature of |$T=10\,000\,$|K and a density of ne = 100 cm−3 and a Calzetti et al. (2000) extinction law (all standard choices for star-forming galaxies; we note that if the narrow Balmer lines are from the transient then Case B may not be appropriate); we measure a modest dust reddening of E(B − V) = 0.23. The lack of forbidden oxygen lines in the spectrum allows us to place a limit on the star formation rate (SFR) of the host galaxy. Correcting the spectrum for the MW and host reddening, we estimate an upper limit on the [O ii] luminosity of 5.6 × 1041 erg s−1. Using the |$L (\mathrm{[O\, \small {II}]})$|–SFR relation from Kennicutt (1998), modified according to Kewley, Geller & Jansen (2004), we place an upper limit of |$\mathrm{SFR}\le 3.7\, \mathrm{M}_{\odot }$| yr−1. Assuming our upper limit on stellar mass of 7 × 10¹⁰ M⊙, the SFR–stellar mass relation for average star-forming galaxies at z = 1 predicts |$\mathrm{SFR}\sim 26\, \mathrm{M}_{\odot }$| yr−1 (Zahid et al. 2012). Unless it has a mass below ∼109 M⊙, which would be highly unlikely given the inferred black hole mass, we conclude that the host of AT2021lwx is not a highly star-forming galaxy.
The rest-frame UV spectra of AT2021lwx display unresolved absorption features from singly ionized metal species, including Fe ii, Mg ii, and possibly doubly ionized Al iii. The uvw2 luminosity is a factor of 10 smaller than the rest of the UV–optical. In the rest frame at z = 0.9945, uvw2 lies bluewards of Lyman α. We infer that there is a significant Lyman α absorber located at the systemic redshift, indicating a large reservoir of warm gas, often observed in quasar (e.g. Viegas 1995; Wolfe, Gawiser & Prochaska 2005; Péroux et al. 2006) and gamma-ray burst (e.g. Krühler et al. 2013; Wiseman et al. 2017) spectra.
5 ORIGIN AS AN EXTREME ACCRETION EVENT
AT2021lwx is a highly energetic event, arguably the most luminous optical transient ever observed. Such high luminosity limits the available mechanisms with which to explain the event, which we summarize in this section.
5.1 Tidal disruption event
In this section, we discuss the possibility that AT2021lwx is a TDE. We begin by estimating some parameters of the system under the assumption of basic accretion physics and with many simplifications, before discussing the results of two different modelling approaches.
A TDE can only occur when the tidal radius lies outside the event horizon of the black hole. That tidal radius depends on the density of the star being disrupted such that for a given stellar mass and radius there is a corresponding upper black hole mass limit, the Hills mass (Hills 1975), above which a TDE cannot occur. For a non-rotating black hole, the Hills mass for a typical 1 M⊙ main-sequence star is ∼8 × 10⁷ M⊙. Assuming a corresponding radiative efficiency of 0.1 (e.g. Marconi et al. 2004; Alexander & Hickox 2012; Nicholl et al. 2022), the peak luminosity of AT2021lwx corresponds to a mass accretion rate of |${\sim} 1.2\, \mathrm{M}_{\odot }$| yr−1. This accretion rate lies at half of the Eddington limit for a black hole of mass |${\sim} 10^8\, \mathrm{M}_{\odot }$|, which is far larger than the typical black hole mass inferred for TDEs (Mockler et al. 2019; Wevers et al. 2019; van Velzen et al. 2021) and marginally above the Hills mass for a 1 M⊙ star. Assuming an accretion rate typical of quasars (|$\dot{M}/\dot{M}_{\mathrm{edd}}=0.1$|) implies |$M_{\mathrm{BH}}\sim 10^9\, \mathrm{M}_{\odot }$|. This lies close to the mean black hole mass for quasars at z = 1 that is |$10^{8.5}\, \mathrm{M}_{\odot }$| (McLure & Dunlop 2004). This black hole mass is beyond the Hills mass for stars up to |$200\, \mathrm{M}_{\odot }$|, unless the black hole is rotating with a large spin, in which case the Hills mass increases (Leloudas et al. 2016), or if the star is evolved, which has the same effect due to the lower density of its atmosphere. At an accretion rate of |$1\!-\!2\, \mathrm{M}_{\odot }$| yr−1, over two solar masses must already have been accreted, placing that mass as a lower limit on any star to have been disrupted.
The energetics of the event are compatible with a TDE if we expand the range of progenitor stars to far higher masses than have been observed before. Fitting the light curve using Modular Open Source Fitter for Transients (MOSFiT; Guillochon et al. 2018) using the TDE model of Mockler et al. (2019), we estimate |$M_{\mathrm{BH}} = 8.3\times 10^8\, \mathrm{M}_{\odot }$| and |$M_* = 14.8\, \mathrm{M}_{\odot }$|, consistent with accretion close to the Eddington limit. It has previously been assumed that TDEs of such massive stars are extremely rare, not least because the lifetimes of such massive stars are of the order of 15 Myr (Meynet & Maeder 2002). A star of this mass must therefore be born within the very central region of the galaxy in order to pass within the tidal radius of the SMBH within its lifetime, which we find unlikely. Similarly, the existence of an |${\sim} 15\, \mathrm{M}_{\odot }$| star requires strong star formation in the host galaxy that is generally inconsistent with our upper limits. Nevertheless, the MW Galactic centre hosts a population of young (≲10–100 Myr) massive (|${\gtrsim} 10\, \mathrm{M}_{\odot }$|) stars, despite there still not being a clear understanding of their origin (e.g. Paumard et al. 2006; Lu et al. 2008). Recent work has also suggested that there are more tidal disruptions of higher mass stars than previously expected – possible explanations include higher SFR in the centres of these galaxies compared to elsewhere in the galaxies or top-heavy initial mass functions (IMFs) in galactic nuclei producing more higher mass stars in these regions (Mockler et al. 2022). Furthermore, the apparent overabundance of carbon compared to oxygen is consistent with some observations of evolved asymptotic giant branch stars (e.g. De Beck & Olofsson 2020). Even so, the lower limits from this study were in the |$1 \!-\! 2\, \mathrm{M}_{\odot }$| range, which is far below the mass inferred for AT2021lwx. Furthermore, we note that there is a strong degeneracy in MOSFiT between the radiative efficiency and the stellar mass of the accreted star (Mockler & Ramirez-Ruiz 2021).
It should also be noted that MOSFiT has not been designed to model disruptions of massive stars; it currently only includes zero-age main-sequence stars, while a massive star may well be evolved into a more diffuse, giant stage. Indeed, the disruption of evolved stars, or those with diffuse envelopes, is a plausible mechanism for a TDE (e.g. MacLeod, Guillochon & Ramirez-Ruiz 2012; Law-Smith et al. 2017), and while uncertainty in the mass–radius relation from stellar evolution is included in MOSFiT’s systematic error measurements, an extreme example could push these errors to the maximum.
Instead of MOSFiT, which relies on simulations of disruption and assumes a set of standard relations to describe the transfer of energy from the disrupted material, through the accretion disc, into radiation, we attempt to model the light curve using specific disc models that assume an initial disc condition. Following the work of Mummery & Balbus (2020), we are able to explain the peak luminosity and late-time UV–optical SED of AT2021lwx with a |$2\, \mathrm{M}_{\odot }$| star being disrupted by a higher mass, maximally spinning SMBH of |$M_{\mathrm{BH}} \gt 1\times 10^9\, \mathrm{M}_{\odot }$|. These results are reliant on a compact initial disc (around the ISCO) and a short viscous time-scale of the order of the orbital time-scale – usually disc time-scales are expected to be several orders of magnitude larger than the orbital time-scale. We find that including a much larger disc mass (i.e. mass of the disrupted star) drives the temperature to be inconsistent with observations (although this could be rectified if the observations are influenced by significant host galaxy reddening).
Neither of the above models accounts for the possibility of super-Eddington accretion, which is likely to occur in TDEs (Dai et al. 2018), particularly in the early phases of the event. In the super-Eddington regime, the disc is likely to inflate into a geometrically thick disc at which point many of the assumptions used in those models break down. For example, there will be significant mass-loss from the disc due to winds, viewing angle effects, and the likely launching of relativistic jets.
The spectra of AT2021lwx do not resemble typical TDEs (e.g. Leloudas et al. 2019; van Velzen et al. 2021; Charalampopoulos et al. 2022). Around half of TDEs appear to show He ii, Fe ii, and/or Bowen features, and while it is fairly common for TDEs to exhibit only Balmer features, such features tend not to include such strong narrow (in our case unresolved) components as AT2021lwx (although see PS16dtm; Petrushevska et al. 2023 and AT2019dsg; van Velzen et al. 2021). If the transient is caused by the disruption of a star, then these spectral features must originate from a reprocessing region not present in typical TDEs. Instead, the narrow components resemble more closely the low-velocity, shocked circumstellar material (CSM) that gives rise to the narrow lines of type IIn SNe.
5.1.1 The expected rate of high-mass star TDEs
To assess the plausibility of detecting a TDE of an |${\sim} 15\, \mathrm{M}_{\odot }$| star, we make a brief estimate of the expected rate of such events. Measurements of the volumetric and galactic rates of TDEs are sparse, but progress has been made with systematically selected samples from ZTF, with Yao et al. (2023) finding 3.2 × 10⁻⁵ galaxy−1 yr−1 in galaxies of |$10^{10}\, \mathrm{M}_{\odot }$|. To estimate the intrinsic rate of TDEs of |$15\, \mathrm{M}_{\odot }$| stars, we take the rate of Yao et al. (2023), assume that it is representative for |$1\, \mathrm{M}_{\odot }$| TDEs, and scale it to |$15\, \mathrm{M}_{\odot }$| by the stellar IMF. Of the 33 TDEs in their sample, only one has a stellar mass measurement substantially greater than |$1\, \mathrm{M}_{\odot }$|. We approximate the rate of TDEs of different mass stars by assuming that it scales directly with the IMF. Using an IMF with a high-mass slope α = −2.3 (e.g. Salpeter 1955; Kroupa 2001; Chabrier 2003), there are 500 times fewer |$15\, \mathrm{M}_{\odot }$| stars than solar-mass stars. The fraction of disruption candidates at this mass is smaller still due to the short lifetimes of these stars (a |$15\, \mathrm{M}_{\odot }$| star lives 103 times shorter than a |$1\, \mathrm{M}_{\odot }$| star), the exact reduction dependent on the integrated stellar population age of stars in the galaxy nucleus. This effect is reflected in the stellar mass function of TDEs: Nicholl et al. (2022) showed that the disrupted stellar mass function drops off faster than the IMF (although the mass function is relatively unconstrained at masses |${\gtrsim} 1.5\, \mathrm{M}_{\odot }$|), since there are only one or two known TDEs from stars with a mass greater than that number. This is likely due to the short lifetime of such intermediate- and high-mass stars. Combining the ratio of lifetimes with the IMF, the intrinsic rate of |$15\, \mathrm{M}_{\odot }$| TDEs is likely ∼106 times smaller than the intrinsic rate of |$1\, \mathrm{M}_{\odot }$| TDEs, rendering the discovery unlikely. However, assuming the energetics are correct and that a TDE of a |$15\, \mathrm{M}_{\odot }$| star is roughly 100 times brighter than that of a solar-mass star, then those from higher mass stars would be detectable by ZTF in a greater volume. Using the faintest magnitude limit used by Yao et al. (2023), |$15\, \mathrm{M}_{\odot }$| TDEs would be visible in a volume 120 times larger. Thus, the observed rates of |$15\, \mathrm{M}_{\odot }$| TDEs may only be >104 times smaller than those at smaller masses. Nevertheless, with current samples numbering in the few tens of objects, it is thus highly unlikely that a |$15\, \mathrm{M}_{\odot }$| TDE would have been discovered.
Overall, while the light curve, SED, and spectra can be explained by a TDE, the frequency and nature of such a disruption are highly unconstrained and significant advances in the modelling of both the disruption of massive stars and the physics of the subsequent accretion must be made before strong conclusions are drawn.
5.2 Turn on of an AGN via sudden accretion of gas
An alternative to the disruption of a star is the sudden, and isolated, accretion of a large amount of more diffuse material. This is distinct from the classical CLAGNs (e.g. LaMassa et al. 2015; Frederick et al. 2019; Graham et al. 2020) that tend to show a change of spectral properties. The turn-on scenario has been proposed for the smooth flaring events in known AGNs such as AT2017bgt (Trakhtenbrot et al. 2019) and AT2019brs (Frederick et al. 2021). Unlike those transients, there is no evidence for a pre-existing AGN in AT2021lwx, although a low-luminosity AGN is not ruled out due to the larger cosmological distance.
A handful of optical nuclear flares that do not adhere to typical TDE, CLAGN, or SN characteristics have been accumulated over recent years (Kankare et al. 2017; Trakhtenbrot et al. 2019; Frederick et al. 2021). Optically, AT2021lwx is more luminous than all of these events, while the light-curve shape is similar to those interpreted as unusual accretion events. Spectroscopically, the two-component H α profile is similar to the nuclear transient PS1-10adi, with the broad component showing a similar velocity to that transient and AT2017bgt, a long-lasting optical flare in a known AGN. The width of the broad component in AT2021lwx is larger than all other similar nuclear flares in Frederick et al. (2021). Unlike all transients in the comparison sample, the spectrum of AT2021lwx shows no Fe ii or features excited by Bowen fluorescence (e.g. N iii).
The large widths of the broad lines imply emission from a region with a high-velocity dispersion, while the existence of narrow lines implies a slow-moving component. Such a scenario resembles a traditional AGN according to the unification picture (Antonucci 1993), where broad lines emanate from the eponymous broad-line region (BLR), comprising clouds of gas that follow virialized orbits around an SMBH. If the observed broad Balmer emission originates from an illuminated virialized BLR, then the radius of this region is rBLR ∼ 5 × 10¹⁶ to 5 × 1017 cm for black holes of |$10^8 \!-\! 10^9\, \mathrm{M}_{\odot }$|, respectively. This inferred BLR size is similar in scale to the inferred blackbody radius RBB, although it is likely that the assumption of a spherical photosphere does not hold if the UV emission originates from an accretion disc.
The narrow-line region (NLR) in AGNs comprises gas at much larger radii, with light traveltimes from black hole to NLR of 102–105 yr, too far to have been ionized by the current flare of AT2021lwx. If the narrow Balmer lines in the AT2021lwx spectra correspond to an NLR in its host galaxy, they must have been ionized by a previously UV-bright source (i.e. an AGN’s accretion disc). However, the lack of narrow nebular lines other than those from hydrogen and carbon renders the NLR unlikely as the source of these features. A second possible explanation for the lack of [O ii], [O iii], and narrow Mg ii is the Baldwin effect (Baldwin & Baldwin 1977), an observed anticorrelation between AGN luminosity and emission-line equivalent widths. Indeed, according to the relationship between B-band absolute magnitude and [O ii] equivalent width in Croom et al. (2002), we may not expect to see any [O ii] emission at all. [O ii] is found to be lacking in approximately 5 per cent of all AGNs (Schawinski et al. 2015).
5.3 Accretion of a gas cloud by a dormant black hole
Given the lack of evidence for an AGN coupled with the difficulties of explaining the event with a TDE, we explore an alternative origin of AT2021lwx. It is plausible that a large amount of material in the form of a molecular cloud was disrupted (see e.g. Wang et al. 2017) and accreted by the black hole. Assuming a TDE-like scenario, the fuelling rate is determined by the fallback rate of material on to the black hole after the disruption. To achieve the observed rise time, the cloud would need to be compact enough to provide significant fuel at early times, since a diffuse cloud would likely result in a slower fallback rate. Detailed modelling of this scenario is deferred to further work.
5.4 Lensed superluminous supernova
The smooth and slow rise, long decline, and colour evolution of AT2021lwx resemble superluminous SNe (SLSNe), which are thought to be powered either by magnetars (e.g. Kasen & Bildsten 2010; Woosley 2010) or by interaction of ejecta with dense CSM. The latter scenario is particularly likely in the case of SLSNe-IIn (e.g. Smith et al. 2007; Benetti et al. 2014; Nicholl et al. 2020) that display narrow Balmer features as seen in AT2021lwx, raising the possibility of an SN origin for the transient. A number of observed properties deter us from this conclusion. Primarily, the peak luminosity requires an extremely unlikely mass of CSM, of the order of |$250\, \mathrm{M}_{\odot }$|, following Chevalier & Irwin (2011), larger than even the zero-age main-sequence mass of the largest expected SN progenitors (e.g. Kasen, Woosley & Heger 2011). The required CSM mass is reduced if the light curve is strongly lensed, and thus magnified, by a foreground source. Given the lack of evidence for any galaxy foreground galaxy in deep imaging, or any system at a lower redshift in the spectra, we find the lensing explanation unlikely.
6 CONCLUSIONS
AT2021lwx is an extraordinary event that does not fit into any common class of transient. With a total radiated energy >1053 erg, it is one of the most luminous transients ever discovered. By collecting and analysing multiwavelength photometry and spectroscopy of the transient, we conclude the following:
The emission is dominated by a blackbody with a moderate temperate of 12 000 K and a large radius of 1016 cm that cools as the transient fades.
There are two components to the material, one with a large velocity dispersion (∼5400 km s−1) and another slow-moving component (∼430 km s−1), the fast-moving component potentially forming an outflow.
The luminosity is likely powered by the accretion of a large amount of gas on to an SMBH with a mass |$\gt 10^{8}\, \mathrm{M}_{\odot }$|.
While there is no evidence of AGN activity, there is, via non-thermal X-rays, evidence for a hot corona or jet as well as the presence of large amounts of dust.
A tidal disruption of a massive star is unlikely due to the small chance of observing such an event.
The spectral and photometric features of the transient suggest the sudden accretion of a large amount of gas, potentially a giant molecular cloud.
Further follow-up and modelling of AT2021lwx is necessary to reveal more about the scenario that caused the flare, and the community is strongly encouraged to search for similar events in both the future and in archival data.
ACKNOWLEDGEMENTS
We thank the anonymous referee for their helpful comments. We thank Nick Stone for helpful discussions on the interpretation of the transient. We are grateful for the rapid turnaround of the DDT proposal by the time allocation committee of the GTC. PW acknowledges support from the Science and Technology Facilities Council (STFC) grant ST/R000506/1. YW acknowledges support from the Royal Society Newton Fund. MP and GL were supported by a research grant (19054) from Villum Fonden. TEMB and LG acknowledge financial support from the Spanish Ministerio de Ciencia e Innovación (MCIN), the Agencia Estatal de Investigación (AEI) 10.13039/501100011033, the European Social Fund (ESF) ‘Investing in your future’, the European Union Next Generation EU/PRTR funds under the PID2020-115253GA-I00 HOSTFLOWS project, the 2019 Ramón y Cajal programme RYC2019-027683-I, the 2021 Juan de la Cierva programme FJC2021-047124-I, Centro Superior de Investigaciones Científicas (CSIC) under the PIE project 20215AT016, and the program Unidad de Excelencia María de Maeztu CEX2020-001058-M. MN was supported by the European Research Council (ERC) under the European Union’s Horizon 2020 research and innovation programme (grant agreement no. 948381) and by funding from the UK Space Agency. PC acknowledges support via an Academy of Finland grant (340613; PI: R. Kotak). This work was partially funded by ANID, Millennium Science Initiative, ICN12_009. MG was supported by the EU Horizon 2020 research and innovation programme under grant agreement no. 101004719. NI was partially supported by Polish NCN DAINA grant no. 2017/27/L/ST9/03221. This work was supported by a Leverhulme Trust International Professorship grant (number LIP-202-014). TP acknowledges the financial support from the Slovenian Research Agency (grant P1-0031). FV was supported by the Spanish Ministry of Science and Innovation research project PID2020-120323GB-I00 and by grant FJC2020-043334-I financed by MCIN/AEI/10.13039/501100011033 and NextGenerationEU/PRTR.
This study is based on observations collected at the European Organisation for Astronomical Research in the Southern Hemisphere, Chile, as part of ePESSTO+ (the advanced Public ESO Spectroscopic Survey for Transient Objects Survey). ePESSTO+ observations were obtained under ESO programme IDs 1103.D-0328, 106.216C, and 108.220C (PI: Inserra). This study is also based on observations made with the GTC telescope, in the Spanish Observatorio del Roque de los Muchachos of the Instituto de Astrofísica de Canarias, under Director’s Discretionary Time GTC05-22BDDT (PI: Müller Bravo). This work made use of photutils (Bradley et al. 2022).
DATA AVAILABILITY
Swift X-ray and UV data are publicly available from the UK Swift Science Data Centre (https://www.swift.ac.uk/swift_portal). ZTF data can be retrieved from the ZTF forced photometry service (https://web.ipac.caltech.edu/staff/fmasci/ztf/forcedphot.pdf). The GTC spectra will be made public upon acceptance via the GTC archive. WISE data are publicly accessible via the NASA IPAC IRSA at https://irsa.ipac.caltech.edu.
