


Skip to results
Modify your search
NARROW
1-20 of 8146

Journal Article
ACCEPTED MANUSCRIPT
A pleiotropy scan to discover new susceptibility loci for pancreatic ductal adenocarcinoma Get access
Mutagenesis, geae012, https://doi.org/10.1093/mutage/geae012
Published: 12 April 2024
Journal Article
ACCEPTED MANUSCRIPT
Commentary: Special Issue - Current Understanding of Colorectal and Pancreatic Cancers
Mutagenesis, geae009, https://doi.org/10.1093/mutage/geae009
Published: 29 March 2024
Journal Article
Piper auritum ethanol extract is a potent antimutagen against food-borne aromatic amines: mechanisms of action and chemical composition
Mutagenesis, geae011, https://doi.org/10.1093/mutage/geae011
Published: 23 March 2024
Image
Inhibition of CYP1A1 (ethoxyresorufin-O-deethylase activity) (3A) ...
in
Mutagenesis
>
Piper auritum ethanol extract is a potent antimutagen against food-borne aromatic amines: mechanisms of action and chemical composition
Published: 23 March 2024
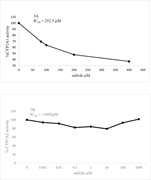
Figure 3.
Inhibition of CYP1A1 (ethoxyresorufin- O -deethylase activity) (3A) and CYP1A2 (methoxyresorufin- O -demethylase activity) (3B) in rat liver microsomes by safrole. IC50 values were calculated by linear regression as described in the “Materials and methods” section.
Image
Inhibition of CYP1A1 (ethoxyresorufin-O-deethylase activity) (2A) ...
in
Mutagenesis
>
Piper auritum ethanol extract is a potent antimutagen against food-borne aromatic amines: mechanisms of action and chemical composition
Published: 23 March 2024
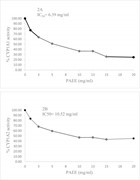
Figure 2.
Inhibition of CYP1A1 (ethoxyresorufin- O -deethylase activity) (2A) and CYP1A2 (methoxyresorufin- O -demethylase activity) (2B) in rat liver microsomes by Piper auritum ethanolic extract. IC50 values were calculated by linear regression as described in the “Materials and methods” section.
Image
Antimutagenicity of Piper auritum Kunth extract against MeIQx in a...
in
Mutagenesis
>
Piper auritum ethanol extract is a potent antimutagen against food-borne aromatic amines: mechanisms of action and chemical composition
Published: 23 March 2024
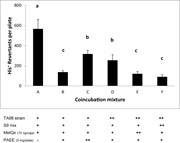
Figure 1.
Antimutagenicity of Piper auritum Kunth extract against MeIQx in a coincubation experiment in S. typhimurium TA98 strain in the presence of metabolic activation. ( − ) not added; (+) added before preincubation; ( ++ ) added after 20 min. coincubation at 37°C. Similar letters above each column me
Journal Article
Adapting the in vitro micronucleus assay (OECD Test Guideline No. 487) for testing of manufactured nanomaterials: recommendations for best practices
Mutagenesis, Volume 39, Issue 3, May 2024, Pages 205–217, https://doi.org/10.1093/mutage/geae010
Published: 19 March 2024
Image
Buffy coat CBPI and frequency of micronuclei (percentage of binucleated cel...
in
Mutagenesis
>
Adapting the in vitro micronucleus assay (OECD Test Guideline No. 487) for testing of manufactured nanomaterials: recommendations for best practices
Published: 19 March 2024
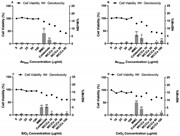
Figure 2.
Buffy coat CBPI and frequency of micronuclei (percentage of binucleated cells containing micronuclei (%Mn/BN)) determined by the in vitro CBMN assay following 1 cell cycle exposure to Au 5nm , Au 30nm , SiO 2 , and CeO 2 ENPs (A, B, C, and D, respectively). Positive controls used were Mitomycin C
Image
Whole blood CBPI and frequency of micronuclei (percentage of binucleated ce...
in
Mutagenesis
>
Adapting the in vitro micronucleus assay (OECD Test Guideline No. 487) for testing of manufactured nanomaterials: recommendations for best practices
Published: 19 March 2024
Figure 3.
Whole blood CBPI and frequency of micronuclei (percentage of binucleated cells containing micronuclei (%Mn/BN)) determined by the in vitro CBMN assay following 1 cell cycle exposure to Au 5nm , Au 30nm , and BaSO 4 ENPs (A, B, and C, respectively). Positive controls used were Mitomycin C (MMC) at
Image
V79 CBPI and frequency of micronuclei (percentage of binucleated cells cont...
in
Mutagenesis
>
Adapting the in vitro micronucleus assay (OECD Test Guideline No. 487) for testing of manufactured nanomaterials: recommendations for best practices
Published: 19 March 2024
Figure 5.
V79 CBPI and frequency of micronuclei (percentage of binucleated cells containing micronuclei (%Mn/BN)) determined by the in vitro CBMN assay following 1 cell cycle exposure to Au 5nm , Au 30nm , SiO 2 , BaSO 4 , and CeO 2 ENPs (A, B, C, D, and E, respectively). Positive controls used were ethyl
Image
V79 CBPI and frequency of micronuclei (percentage of binucleated cells cont...
in
Mutagenesis
>
Adapting the in vitro micronucleus assay (OECD Test Guideline No. 487) for testing of manufactured nanomaterials: recommendations for best practices
Published: 19 March 2024
Figure 4.
V79 CBPI and frequency of micronuclei (percentage of binucleated cells containing micronuclei (%Mn/BN)) determined by the in vitro CBMN assay following 1 cell cycle exposure to Au 5nm , Au 30nm , and SiO 2 ENPs (A, B, and C, respectively). Positive controls used were ethyl methanesulfonate (EMS)
Image
TK6 and HepG2 cell viability and mutagenicity (percentage of binucleated ce...
in
Mutagenesis
>
Adapting the in vitro micronucleus assay (OECD Test Guideline No. 487) for testing of manufactured nanomaterials: recommendations for best practices
Published: 19 March 2024
Figure 1.
TK6 and HepG2 cell viability and mutagenicity (percentage of binucleated cells containing micronuclei (%Mn/BN)) determined by the in vitro CBMN assay following exposure to Au 5nm , Au 30nm , and SiO 2 (TK6; A, B, C, respectively and HepG2; D, E, F). Positive controls: Mitomycin C (MMC) at 0.01 µg
Image
Summary of the molecular (blue text) and cellular (black text) endpoints us...
in
Mutagenesis
>
An integrated in vitro carcinogenicity test that distinguishes between genotoxic carcinogens, non-genotoxic carcinogens, and non-carcinogens
Published: 12 March 2024
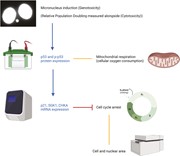
Figure 1.
Summary of the molecular (blue text) and cellular (black text) endpoints used for the in vitro multiple-endpoint assay, and relationships between these endpoints. Arrows represent the series of events leading to gene upregulation (i.e. micronucleus induction leads to p53 accumulation, resulting in
Image
Summary of the overall scores for test chemicals based on ISC and number of...
in
Mutagenesis
>
An integrated in vitro carcinogenicity test that distinguishes between genotoxic carcinogens, non-genotoxic carcinogens, and non-carcinogens
Published: 12 March 2024
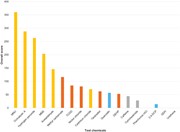
Figure 4.
Summary of the overall scores for test chemicals based on ISC and number of endpoints changed. Chemicals are coloured according to sub-category; gold = GC, brown = NGC, orange = misleading in vitro negative; grey = toxic NC, blue = misleading in vitro positive. Chemicals with a 0 score and there
Journal Article
Effects of aflatoxin and fumonisin on gene expression of growth factors and inflammation-related genes in a human hepatocyte cell line
Mutagenesis, Volume 39, Issue 3, May 2024, Pages 181–195, https://doi.org/10.1093/mutage/geae005
Published: 12 March 2024
Image
(A) Combined treatment of AFB1 and FB1 on HHL-16 cell...
in
Mutagenesis
>
Effects of aflatoxin and fumonisin on gene expression of growth factors and inflammation-related genes in a human hepatocyte cell line
Published: 12 March 2024
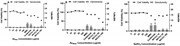
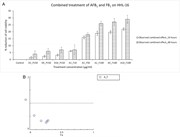
Figure 2.
(A) Combined treatment of AFB 1 and FB 1 on HHL-16 cells for 24 and 48 h. Control: untreated cells; D: DMSO treatment; P: PBS treatment; A: AFB 1 treatment; F: FB 1 treatment; PBS and DMSO treatment were normalized against control groups. Combined treatments were normalized against corresponding
Image
Gene expression of cytochrome P450 (CYP) enzymes in HHL-16 cells exposed to...
in
Mutagenesis
>
Effects of aflatoxin and fumonisin on gene expression of growth factors and inflammation-related genes in a human hepatocyte cell line
Published: 12 March 2024
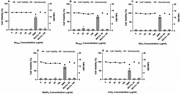
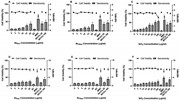
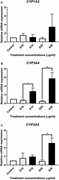
Figure 3.
Gene expression of cytochrome P450 (CYP) enzymes in HHL-16 cells exposed to aflatoxin for 24 h. Control: untreated cells; D: DMSO treatment; A: aflatoxin treatment. ACTB : Beta-actine, a reference gene used for the normalization to CYP1A2 (A), CYP3A4 (B) and CYP3A5 (C). A significant increase
Journal Article
An integrated in vitro carcinogenicity test that distinguishes between genotoxic carcinogens, non-genotoxic carcinogens, and non-carcinogens
Mutagenesis, Volume 39, Issue 2, April 2024, Pages 69–77, https://doi.org/10.1093/mutage/geae004
Published: 12 March 2024
Image
Single AFB1 (A) or FB1 (B) treatment on HHL-16 cells ...
in
Mutagenesis
>
Effects of aflatoxin and fumonisin on gene expression of growth factors and inflammation-related genes in a human hepatocyte cell line
Published: 12 March 2024
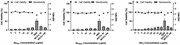
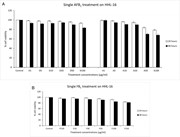
Figure 1.
Single AFB 1 (A) or FB 1 (B) treatment on HHL-16 cells for 24 and 48 h. Control: untreated cells; D: DMSO treatments; A: AFB 1 treatments; P: PBS treatment; F: FB 1 treatment. DMSO and PBS treatments were normalized against the control group. AFB 1 treatments were normalized against correspondi
Image
Heat map of gene expression fold change of several selected genes in growth...
in
Mutagenesis
>
Effects of aflatoxin and fumonisin on gene expression of growth factors and inflammation-related genes in a human hepatocyte cell line
Published: 12 March 2024
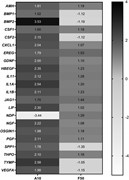
Figure 4.
Heat map of gene expression fold change of several selected genes in growth factors pathway in HHL-16 cells exposed to single AFB 1 (10 µg/ml) or single FB 1 (50 µg/ml) for 24 h. A: AFB 1 treatment; F: FB 1 treatment. The colours represent the up-regulated (black) and down-regulated (white) gene
