


Abstract
Here we present ICARUS, a web server to enable users without experience in R to undertake single cell RNA-seq analysis. The focal point of ICARUS is its intuitive tutorial-style user interface, designed to guide logical navigation through the multitude of pre-processing, analysis and visualization steps. ICARUS is easily accessible through a dedicated web server (https://launch.icarus-scrnaseq.cloud.edu.au/) and avoids installation of software on the user's computer. Notable features include the facility to apply quality control thresholds and adjust dimensionality reduction and cell clustering parameters. Data is visualized through 2D/3D UMAP and t-SNE plots and may be curated to remove potential confounders such as cell cycle heterogeneity. ICARUS offers flexible differential expression analysis with user-defined cell groups and gene set enrichment analysis to identify likely affected biological pathways. Eleven organisms including human, dog, mouse, rat, zebrafish, fruit fly, nematode, yeast, cattle, chicken and pig are currently supported. Visualization of multimodal data including those generated by CITE-seq and the 10X Genomics Multiome kit is included. ICARUS incorporates a function to save the current state of analysis avoiding computationally intensive steps during repeat analysis. The complete analysis of a typical single cell RNA-seq dataset by inexperienced users may be achieved in 1–2 h.
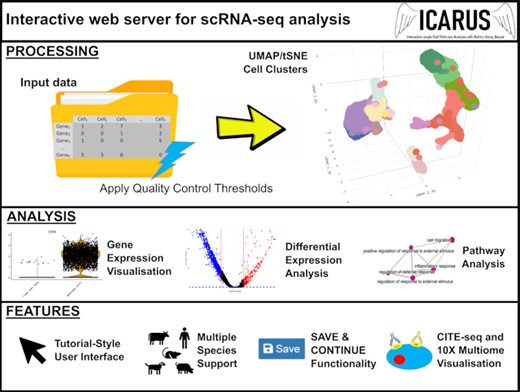
Overview of ICARUS, an interactive web server for single cell RNA-seq analysis with a tutorial style user interface to guide logical navigation through processing and analysis steps.
INTRODUCTION
Many single cell RNA-seq data analysis software require knowledge of programming in R or python. We present ICARUS (Interactive single cell RNA-seq analysis with R-shiny using Seurat), an application for single cell RNA-seq (scRNA-seq) analysis accessible through standard web browsers, with an intuitive tutorial style interface and user control over a wide range of parameters at each analysis step (Table 1 and Figure 1). ICARUS functionality is based on the Seurat R package which contains the most comprehensive tool set for scRNA-seq data analysis with the latest methodologies and frequent updates (1–4). ICARUS improves on previous analysis and visualization software tools including 10X Genomics Loupe cell browser or third-party tools such as Cerebro (5), NASQAR (6), Alona (7), single cell explorer (8) and others in three main areas: (i) intuitive tutorial-style user interface to guide logical navigation through the multitude of pre-processing, analysis and visualization steps; (ii) extended functionality and increased diversity of analysis tools to accommodate the rapidly evolving singe cell RNA-seq research field; (iii) easy accessibility through a dedicated web server (https://launch.icarus-scrnaseq.cloud.edu.au/) that avoids installation of software on the user's computer.
Summary of R packages used for each ICARUS step
| Step in ICARUS | Main command | R packages | Reference |
|---|---|---|---|
| Quality control | - | Seurat | (1–4) |
| Integration of second dataset | Seurat::FindIntegrationAnchors Harmony::RunHarmony | Seurat, Harmony | (1–4,22) |
| Dimensionality reduction | Seurat::FindVariableFeatures Seurat::NormalizeData Seurat::ScaleData Seurat::RunPCA | Seurat | (1–4) |
| Clustering | Seurat::FindNeighbours Seurat::FindClusters Seurat::RunUMAP Seurat::RunTSNE | Seurat | (1–4) |
| Data correction | Seurat::CellCycleScoring Seurat::ScaleData(vars.to.regress) | Seurat | (1–4) |
| Labelling clusters | SingleR::SingleR Celldex::BlueprintEncodeData Celldex::DatabaseImmuneCellExpressionData Celldex::HumanPrimaryCellAtlasData Celldex::ImmGenData Celldex::MonacoImmuneData Celldex::MouseRNAseqData Celldex::NovershternHematopoieticData | SingleR, Celldex | (12) |
| Multimodal analysis | - | Seurat | (1–4) |
| Differential expression analysis | Seurat::FindMarkers | Seurat | (1–4) |
| Pathway analysis | ClusterProfiler::gseGO ClusterProfiler::gseKEGG ClusterProfiler::gseWP ReactomePA::gsePathway | ClusterProfiler, ReactomePA | (20,21) |
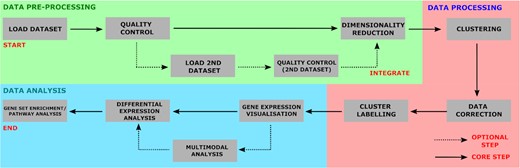
Flow chart of pre-processing, processing and analysis steps performed in ICARUS.
MATERIALS AND METHODS
Input data
ICARUS requires a matrix of UMI counts for each gene per cell. Input data may be in the form of a tab delimited table with cells as columns and gene features as rows. Seurat R objects (RDS file) can also be loaded. Alternatively, 10X CellRanger output data files (barcodes.tsv, features.tsv and matrix.tsv) may be directly loaded. For data privacy reasons, the user data is not retained on the server after the user-session is terminated.
Pre-processing
The user may apply various quality control parameters to the dataset with ICARUS including, the number of unique genes detected per cell, the number of molecules detected per cell, mitochondrial and ribosomal percentage. Cells with a low number of unique genes, low number of molecules and a high mitochondrial percentage are indicative of perforated cells or low-quality libraries that have undergone a loss of cytoplasmic RNA. It is recommended to remove these cells before downstream steps to avoid formation of spurious clusters that may mask biological interpretation during analysis. A scaling and normalization step is then applied to account for differences in sequence coverage that arise from cDNA capture errors or PCR amplification efficiency differences. ICARUS integrates Seurat's dimensionality reduction workflow with principal component analysis prioritising a set of highly variable genes (user-selectable, 2000 genes default) (3). For visualization of the sources of cell heterogeneity across the dataset, a dimensionality reduction heatmap and loadings plot displays top genes within each dimension. Further, a plot of variance explained by successive principal components can be helpful in determining the number of dimensions that captures the majority of the variance in the dataset (often referred to as the ‘elbow point’). The elbow point is the recommended number of dimensions to use for downstream cell clustering.
Processing
ICARUS performs clustering with graph-based community detection. Briefly, a graph of k-nearest neighbours is formed between cells in high dimensional space where each cell is a node that is connected to its k-nearest neighbours. The edges of every connection are then weighted based on its similarities to neighbouring cells using the Jaccard-similarity algorithm and a community detection algorithm is used to define clusters (3). Clusters are visualized with 2D or 3D UMAP and t-SNE plots. ICARUS offers user control over clustering parameters including number of dimensions, number of k-nearest neighbours for graph construction and choice of clustering algorithm (either Louvain, SLM or Leiden). UMAP parameters (nearest neighbours and minimum distance) and t-SNE parameters (perplexity and number of iterations) can also be adjusted.
A data correction step allows removal of potential technical and biological confounders that could mask biological signal, such as cell cycle heterogeneity. For removal of cell cycle effects, a cell cycle score is first assigned to each cell based on its expression of G2/M and S phase markers. If the cell displays low or no expression of these markers, then the cell is likely not cycling (G1 phase). Each cell cycle score is modelled against highly variable genes and a corrected expression matrix is generated for dimensionality reduction and clustering (2,9,10). Alternatively, the user may opt to remove the effects of user selected gene(s) or an entire gene set (MsigDB gene sets) (11). In this case, average normalized gene counts of each gene of interest are computed and modelled against all expressed genes. The residuals of the model are scaled and centred and used for dimensionality reduction and clustering (2).
Marker genes for each cluster may be compared against known cell marker databases to assign a cell type to existing clusters. ICARUS utilizes the singleR and Celldex R packages (12) to annotate cell clusters against cell marker databases including Blueprint Encode (13), Database of immune cell expression (DICE) (14), Human primary cell atlas (15), Immunologic genome project (ImmGen) (www.immgen.org), Monaco immune data (16), Mouse RNAseq Dataset (17) and Novershtern Hematopoietic data (18).
Analysis
Visualization of gene expression across clusters is helpful in determining the main drivers of cluster formation and cell heterogeneity. ICARUS provides visualization of normalised and scaled gene counts as UMAP/t-SNE plots and violin plots. Further, multiple genes or gene sets (MsigDB) may be visualized as average normalised gene count between all selected genes.
ICARUS enables users to perform pairwise differential expression tests between cell clusters of interest or between samples within a cell cluster and output a list of differentially expressed genes. Statistical significance testing between pairwise observations is conducted with the Wilcoxon rank sum test (Wilcoxon–Mann–Whitney test) with Bonferroni multiple testing correction. The list of differentially expressed genes are then tested for enriched terms (gene set enrichment analysis) to identify potential affected biological pathways (19). Gene set enrichment and visualization are performed using ClusterProfiler (20) and ReactomePA (21) R packages. ICARUS currently supports eleven model organisms and livestock species including human (Homo sapiens), dog (Canis lupus familiaris), mouse (Mus musculus), rat (Rattus norvegicus), zebrafish (Danio rerio), fruit fly (Drosophila melanogaster), nematode (Caenorhabditis elegans), yeast (Saccharomyces cerevisiae), cattle (Bos taurus), chicken (Gallus gallus) and pig (Sus scrofa).
Graphical visualization of enriched terms includes a dot plot ordered by gene ratio (number of genes in enriched gene set/total number of genes in gene set), a gene concept network showcasing genes involved with the enriched terms and an enrichment map consisting of a network of enriched terms with edges connecting overlapping gene sets.
Occasionally, significant heterogeneity exists within computed cell clusters and differential expression tests may be confounded by the broad cluster classification. ICARUS provides the user the option to interactively select customised cell groups using a lasso select function for differential expression tests. This function may provide additional power to detect unique gene expression profiles in rare cell types that were previously obscured in a wider cluster of cells.
Advanced features
Integration of a second dataset
Comparisons between different scRNA-seq samples (i.e. control versus treatment samples or samples across different batches) are challenging due to technical differences in library preparation and batch effects (e.g. cells on different microfluidic chips, cells harvested at different time points or cells in different sequencing lanes). Simply merging gene expression matrices of samples from different conditions/datasets/batches may result in spurious cell clustering. Instead, methods for data integration rely on identification of a set of shared variable genes from each dataset to group cells with common biological states. In brief, pairs of cells from each dataset that exists within similar high dimensional space are identified through either Canonical Correction Analysis, Reciprocal PCA or Harmony. A neighbour graph is then constructed to compute shared neighbour overlap between cells to output a combined integrated dataset (2,22). The aim of integration is to enable successful grouping of cells from one condition/dataset/batch with the same cell types of the other condition/dataset/batch.
ICARUS offers users the ability to upload a second dataset for integration with the first dataset. Quality control functionality as per described in the preprocessing section is also available for the second dataset. Integration may be performed with user selected parameters including the choice of reduction method (Canonical Correction Analysis, Reciprocal PCA or Harmony) and strength of integration (k anchors).
Support for multimodal analysis
Multimodal analysis refers to the simultaneous measurements of several data types from the same cell. For example, methodologies including CITE-seq (23), cell hashing oligos (24) and single cell RNA-seq plus ATAC-seq (10X multiome kit) allow measurements of both single cell transcriptomes and cell-surface proteins of the same cell. Multimodal data in the form of a tab delimited count matrix with cells as columns (cells must be matching those of the scRNA-seq dataset) and multimodal features as rows can be uploaded into ICARUS. Multimodal data is visualised alongside scRNA-seq data to ensure easy comparison and interpretation.
Local save and continue functionality
ICARUS features local save and continue functionality. At each analysis step the user may opt to save their progress as a Rdata file containing the Seurat R object and the current working environment. The saved file can then be loaded at the CONTINUE interface at the ‘Introduction’ tab to resume analysis. The save and continue feature bypasses potential long computationally intensive processing steps during repeat analysis. Further, the user is able to reproduce all parameters that were used to complete each analysis step and replicate plots and tables. An automatically updated log will record the user's input parameters. Additionally, the Seurat R object may be saved individually and this may be shared across sites/teams to facilitate collaboration. The Seurat R object can be loaded into RStudio for a more in-depth analysis with a variety of supporting scRNA-seq analysis packages available in the R environment.
Downloadable plots and tables
All plots and tables produced in ICARUS are downloadable. Plots may be downloaded with user defined height and width and are available in 6 different file formats including png, jpeg, tiff, png, bmp and svg. Tables are downloaded as comma separated values (csv) files.
RESULTS
To demonstrate the utility of ICARUS, five example datasets listed in Table 2 are available within ICARUS. These include a dataset of 2700 peripheral blood mononuclear cells (PBMC) that was used as demonstration for the Seurat guided clustering tutorial vignette (https://satijalab.org/seurat/articles/pbmc3k_tutorial.html). Using this 2,700 PBMC dataset, a quality control filter was first applied removing low quality cells with unique gene counts more than 2,500 or less than 200 and cells with over 5% mitochondrial content. Dimensionality reduction with PCA was performed prioritising 2,000 highly variable genes. Cell clustering was performed with the first 10 dimensions, a k-nearest neighbour value of 20 and the Louvain community detection algorithm. ICARUS was able to successfully reproduce the UMAP/t-SNE plots shown in the Seurat clustering vignette (Figure 2A) and differentiate PBMC cells into 6 cell types including T cells CD4+, naïve; T cells CD4+, TFH; B cells, naïve; NK cells; Monocytes, CD14 + and Monocytes, CD16+ (Figure 2B). An example of differential expression analyses between B cells and T cells CD4+, naïve cell clusters showcased top differentially expressed genes comprising of HLA genes (HLA-DRB1, HLA-DQA1, HLA-DPB1, HLA-DPA1) and CD79. Gene set enrichment analyses revealed enriched terms including MHC protein complex assembly, antigen processing and presentation and peptide antigen assembly (Figure 3).
Example datasets available in ICARUS
| Dataset | Available from… |
|---|---|
| 2,700 Human peripheral blood mononuclear cells (Seurat guided clustering tutorial dataset) | 10x genomics https://cf.10xgenomics.com/samples/cell/pbmc3k/pbmc3k_filtered_gene_bc_matrices.tar.gz |
| 500 human peripheral blood mononuclear cells | 10x genomics https://cf.10xgenomics.com/samples/cell-exp/6.1.0/500_PBMC_3p_LT_Chromium_Controller/500_PBMC_3p_LT_Chromium_Controller_filtered_feature_bc_matrix.tar.gz |
| 5,000 cells from a combined cortex, hippocampus and subventricular zone of an E18 mouse | 10x genomics https://cf.10xgenomics.com/samples/cell-exp/3.0.2/5k_neuron_v3/5k_neuron_v3_filtered_feature_bc_matrix.tar.gz |
| 8,617 cord blood mononuclear cells (Seurat multimodal data tutorial), this dataset also contains CITE-seq data for 11 surface proteins. | NCBI GEO https://www.ncbi.nlm.nih.gov/geo/query/acc.cgi?acc = GSE100866 |
| 10k Human PBMCs Multiplexed, 2 CMOs (CellPlex) | 10x genomics https://www.10xgenomics.com/resources/datasets/10-k-human-pbm-cs-multiplexed-2-cm-os-3–1-standard-6–0-0 |
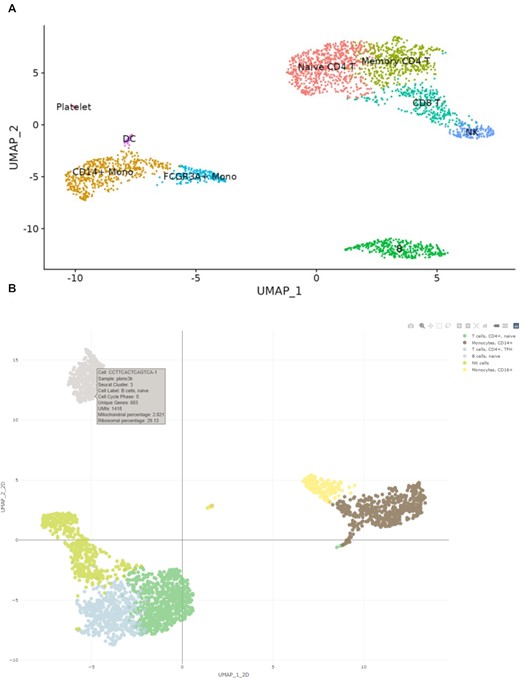
Comparison of cell clustering and annotation. ICARUS employs the Seurat clustering algorithm. Clustering outcome comparison between Seurat clustering tutorial vignette (A) and ICARUS (B) on a dataset of 2700 Human PBMCs. Cell cluster labelling in ICARUS by comparison of cluster marker genes to the Database of Immune Cell Expression.
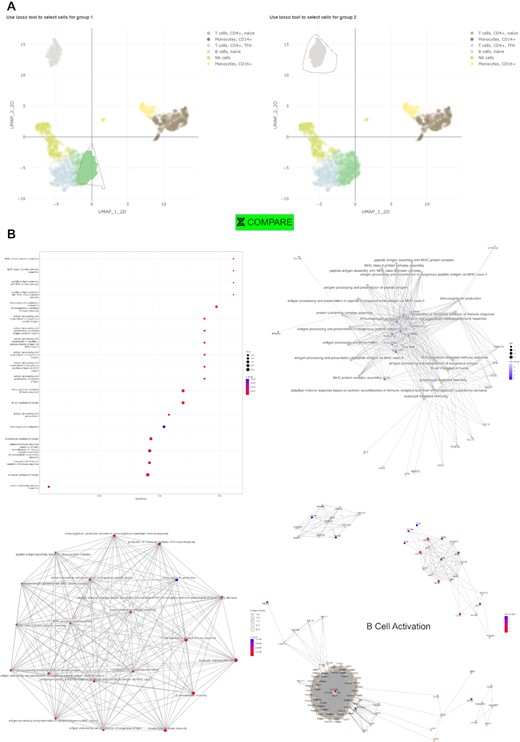
User selected differential expression analyses and gene set enrichment. (A) ICARUS provides the user the option to interactively select customised cell groups using a lasso select function for differential expression tests. (B) Extended visualizations of enriched terms (gene set enrichment analysis) including a dot plot ordered by gene ratio, a gene concept network showcasing genes involved with enriched terms and an enrichment map consisting of a network of enriched terms with edges connecting overlapping gene sets. Enriched terms may also be visualised individually as gene pathways (B cell activation pathway shown in figure).
DISCUSSION
This manuscript describes ICARUS, a web server application for guided processing and analysis of single cell RNA-seq data. The intended goal for ICARUS is to provide users a platform to enable logical and stepwise interpretation of scRNA-seq data without the requirement of previous programming knowledge. ICARUS combines a tutorial style interface with graphical outputs at every step to reduce the steep learning curve associated with scRNA-seq data processing and analysis. Compared to other similar tools, ICARUS has flexible functionality and includes additional tools to enable biological interpretation and accommodate the rapidly evolving scRNA-seq research field. A typical scRNA-seq dataset containing 8000 cells with 4000 UMIs per cell may be analysed in ICARUS within 1–2 h using commodity hardware. Experienced users may utilise the downloadable R objects for a more in-depth analysis using the multitude of supporting scRNA-seq and other analysis packages available in the R environment.
DATA AVAILABILITY
ICARUS is available at https://launch.icarus-scrnaseq.cloud.edu.au/. The application is free and open to all users with no login requirement. Alternatively, a docker version is accessible through the Docker Hub under the name ‘icarusscrnaseq/icarus’.
ACKNOWLEDGEMENTS
We thank the New Zealand–China Non Communicable Diseases Research Collaboration Centre (NCD CRCC). This web server was supported by the Australian National eResearch Collaboration Tools and Resources (Nectar Research Cloud) initiative.
FUNDING
New Zealand Ministry of Business Innovation and Employment funding for New Zealand–China Non Communicable Diseases Research [UOOX1601]. Funding for open access charge: New Zealand–China Non Communicable Diseases Research [UOOX1601].
Conflict of interest statement. None declared.
Notes
Present address: Andrew Jiang, Applied Translational Genetics Group, School of Biological Sciences, The University of Auckland, Auckland, New Zealand.

Comments