


Abstract
Renal osteodystrophy is considered common, but is not well characterized in contemporary kidney transplant recipients. This study reports extensively on bone phenotype by bone histomorphometry, bone densitometry and novel bone biomarkers 1 year after kidney transplantation.
A transiliac bone biopsy and dual-energy X-ray absorptiometry scans were performed in 141 unselected kidney transplant recipients in this observational cohort study. Blood and 24-h urine samples were collected simultaneously.
The median age was 57 ± 11 years, 71% were men and all were of Caucasian ethnicity. Bone turnover was normal in 71% of patients, low in 26% and high in just four cases (3%). Hyperparathyroidism with hypercalcaemia was present in 13% of patients, of which only one had high bone turnover. Delayed bone mineralization was detected in 16% of patients, who were characterized by hyperparathyroidism (137 versus 53 ρg/mL), a higher fractional excretion of phosphate (40 versus 32%) and lower levels of phosphate (2.68 versus 3.18 mg/dL) and calcidiol (29 versus 37 ng/mL) compared with patients with normal bone mineralization. Osteoporosis was present in 15–46% of patients, with the highest prevalence at the distal skeleton. The proportion of osteoporotic patients was comparable across categories of bone turnover and mineralization.
The majority of kidney transplant recipients, including patients with osteoporosis, have normal bone turnover at 1-year post-transplant. Low bone turnover is seen in a substantial subset, while high bone turnover is rare. Vitamin D deficiency and hypophosphataemia represent potential interventional targets to improve bone health post-transplant.
KEY LEARNING POINTS
What is currently known about this subject?
Current international guidelines highlight the importance of evaluating bone fragility in kidney transplant recipients, but recommendations for screening and treatment remain vague.
To advance treatment strategies for optimal bone health post-transplant, it is essential to characterize the bone phenotype. This study reports extensively on bone disease in an unselected cohort of kidney transplant recipients at 12 months post-transplant, a time point where kidney function and mineral metabolism are expected to have stabilized.
What this study adds?
Normal bone turnover is the most common finding in unselected kidney transplant recipients at 12 months post-transplant. The remaining patients have low bone turnover, which is associated with steroid exposure, while high bone turnover is rare despite a high prevalence of hyperparathyroidism.
Bone mineralization is delayed in a subset of patients and related to disturbances of mineral metabolism with hyperparathyroidism, renal phosphate wasting and low vitamin D levels.
Osteoporosis and osteopenia as defined by dual-energy X-ray absorptiometry T-scores are highly prevalent in kidney transplant recipients, particularly at the distal skeleton. Importantly, the majority of patients with osteoporosis have normal bone turnover and mineralization at 12 months post-transplant.
What impact this may have on practice or policy?
By informing on the bone phenotype of kidney transplant recipients, and particularly the pattern of renal osteodystrophy, we hope to reduce therapeutic nihilism regarding fracture prevention in the post-transplant period.
INTRODUCTION
Bone disease after kidney transplantation is an issue of growing concern [1]. Current international guidelines highlight the importance of evaluating bone fragility in kidney transplant recipients, but recommendations for screening and treatment remain vague [2]. To advance treatment strategies for optimal bone health post-transplant, it is essential to characterize the bone phenotype.
Pre-transplant renal osteodystrophy, post-transplant immunosuppressive treatment and ongoing disturbances of mineral metabolism all contribute to bone disease in kidney transplant recipients. The pattern of renal osteodystrophy in patients with kidney failure is changing, shifting from high to low bone turnover states [3, 4], the clinical consequences of which are yet to be established. Immunosuppressive regimens have been optimized with the introduction of steroid-minimization or steroid-free protocols, contributing to reduced bone loss after transplantation [5, 6]. Changes in mineral metabolism therapy with the introduction of calcimimetics, widespread nutritional vitamin D supplementation and a more restrictive use of calcium (Ca)-containing phosphate (PO4) binders may translate to altered mineral metabolism phenotypes post-transplant [7, 8].
The transiliac bone biopsy with subsequent histomorphometric analysis remains the gold standard for evaluating renal osteodystrophy. By the current recommendations, three key histologic features are evaluated, namely bone turnover, mineralization and volume (TMV classification) [9]. Bone turnover decreases post-transplant, even from a low to normal phenotype pre-transplant [10, 11]. Osteoblast dysfunction has been demonstrated in the early post-transplant period and linked to glucocorticoid use and hypophosphataemia [12]. Mineralization defects are reported to varying degrees [13, 14].
The use of bone biopsies in clinics and research is waning [15] and consequently contemporary studies investigating bone disease after kidney transplantation by histomorphometry are limited. The resulting knowledge gap, along with the lack of guidance from interventional trials, may lead to therapeutic nihilism, potentially contributing to the high fracture risk seen after kidney transplantation [16, 17].
The aim of this study was to characterize renal osteodystrophy after kidney transplantation by performing protocol-specified bone biopsies at 1-year post-transplant. The contributions of patient demographics, current medical treatment and ongoing disturbances of mineral metabolism to the pattern of renal osteodystrophy in kidney transplant recipients are examined.
MATERIALS AND METHODS
Cohort
Adult patients referred for a single kidney transplantation at the University Hospitals, Leuven, Belgium were eligible to participate in this prospective, observational study detailing mineral and bone disorders after kidney transplantation (clinical trial identifier NCT01886950). The only exclusion criteria was the use of anti-osteoporotic medications. From 15 October 2010 to 31 August 2018, 955 patients received a single kidney transplant, of which 155 agreed to participate in this study. Eleven patients were excluded due to poor quality of the bone biopsy and three due to the use of antiresorptive therapy, resulting in a final cohort of 141 patients. Relevant demographic variables including comorbidities, acute rejections and medical therapy were extracted from electronic patient files. Patients were scheduled for a study visit with blood samples and a bone biopsy at 12 months post-transplant. The median time from transplant was 376 days [interquartile range (IQR) 367–385] and 90% of patients had the bone biopsy performed from 1 week before to 1 month after the 1-year post-transplant date. Study participants were comparable to non-participants, with the exception of being slightly older (57 versus 55 years; P = 0.04) and having higher calcidiol levels (36 versus 32 ng/mL) (Supplementary data, Table S1).
All clinical and research activities reported are consistent with the Principles of the Declaration of Istanbul on Organ Trafficking and Transplant Tourism. The study adhered to the principles of the Declaration of Helsinki and was approved by the Research Ethical Committee (study ID S52091) of KU Leuven. All patients provided written informed consent prior to participation.
Immunosuppressive protocol
Standard triple immunosuppressive therapy with glucocorticoids, a calcineurin inhibitor and an antimetabolite were initiated at the time of transplantation. Methylprednisolone was administered intravenously on the day of (500 mg) and the first day after (40 mg) transplantation, followed by a daily oral dose of 16 mg that was tapered over the first 3 months at the discretion of the treating physician. Clinical parameters and findings on a protocolled kidney graft biopsy at Month 3 determined whether glucocorticoids were discontinued or not. All mineral metabolism therapy was stopped at the time of transplantation and resumed as considered necessary by the treating physician. Vitamin D levels were systematically monitored and supplemented to a target level >30 ng/mL.
Biochemical analyses
Fasting blood samples were collected at the outpatient study visit in relation to the bone biopsy procedure. Samples were stored for ˂2 h at 5°C before arrival at the laboratory, where they were centrifuged at 3000 rpm for 10 min, aliquoted and stored at –80°C until analysis. Then 24-h urine samples were collected, shaken, aliquoted and stored at –80°C until analysis. Creatinine, haemoglobin, PO4, total Ca and bicarbonate were all measured using standard laboratory techniques. The estimated glomerular filtration rate (eGFR) was calculated using the Chronic Kidney Disease (CKD) Epidemiology Collaboration equation [18].
Serum 25-hydroxyvitamin D (calcidiol) levels were measured using a radioimmunoassay [19]. Serum full-length (biointact) parathyroid hormone (PTH) was determined by an in-house immunoradiometric assay (normal range 3–40 ρg/mL) [20]. Bone-specific alkaline phosphatase (BsAP; normal range 6.1–25.5 μg/L), trimeric procollagen type I N-terminal propeptide (PINP; normal range 12.8–82.6 μg/L) and tartrate-resistant acid phosphatase isoform 5b (TRAP5b; normal range 1.1–6.9 U/L) were measured with the iSYS instrument (Immunodiagnostic Systems, Boldon, UK). Values above the upper limit of quantification of the assay were determined after dilution. Serum sclerostin (TECOmedical, Sissach, Switzerland; normal range 0.25–0.93 ng/mL), osteoprotegerin (OPG; Biomedica, Vienna, Austria; normal mean 54 ρg/mL) and soluble receptor activator of nuclear factor ϰΒ ligand (sRANKL; Biomedica; normal range 0.6–9.6 ρg/mL) were measured using enzyme-linked immunosorbent assay kits as per the manufacturer’s instructions. Inter- and intra-assay coefficients of variation for all assays used were ˂10%. Fractional excretions of PO4 (FEPO4; normal range 0–25%) and Ca (FECa; normal range 1–2%) were calculated based on serum (S) and 24-hr urinary (U) measurements by the following equations: (UPO4 × Screatinine)/(SPO4 × Ucreatinine) and (UCa × Screatinine)/(SCa × Ucreatinine), with all measurements in mg/dL. For the urinary Ca (UCa) excretion, 100–250 mg/24 h was considered the normal range [21].
Bone histomorphometry
A transiliac bone biopsy was performed under light sedation with local anaesthesia using a trephine with an outer/inner diameter of 4.50/3.55 mm (Osteobell 7G; Biopsybell, Mirandola, Italy) at a site 2 cm posterior and 2 cm inferior to the anterior iliac spine. Oral tetracyclines were administered twice (2 × 500 mg/day for 3 days) with an interval of 11 days and the bone biopsy was performed 4 days after the last intake of tetracycline. Biopsy specimens were fixed in 70% ethanol and embedded in a methylmethacrylate resin. Undecalcified 5-μm thick sections were stained by the Goldner method in order to determine static bone parameters, while unstained sections of 10-μm thickness were mounted in 100% glycerol for fluorescence microscopy to visualize tetracycline labels and determine the dynamic parameters.
All histomorphometric parameters are reported in two dimensions using standardized nomenclature [22]. The bone histomorphometric analysis was performed at the Laboratory of Pathophysiology, University of Antwerp, Antwerp, Belgium, using a commercially available image analysis software (AxioVision version 4.51, Zeiss Microscopy, Zeiss, Germany) running a custom programme. Patients were categorized by the TMV classification [9] by an experienced bone pathologist using a semi-quantitative approach, taking into account key dynamic and static parameters. The normal range of the bone formation rate (BFR)/total tissue area was 97–613 μm2/mm2/day [23]. Delayed mineralization was defined as the combination of a prolonged mineralization lag time (MLT; normal range 2–63 days) in combination with high amounts of osteoid (OAr/BAr; normal range 0.2–5.8%). Bone volume was considered low if bone versus the total tissue area (BAr/TAr) was <14.6% and high if BAr/TAr was >27.0%.
Dual energy X-ray absorptiometry (DXA)
Bone mineral density (BMD) was measured by DXA using a 4500 or Discovery densitometer (Hologic, Marlborough, MA, USA). Scans performed ±4 weeks from the date of bone biopsy were accepted. A single, certified operator analysed all DXA scans. The Hologic Spine Phantom was scanned daily to monitor the device performance and long-term stability. T- and Z-scores were calculated using reference data from the third National Health and Nutrition Examination Survey, as provided by the manufacturer.
Statistical analysis
Data are expressed as mean ± standard deviation (SD) or median (IQR). For comparison of variables across groups, one-way analysis of variance or the Kruskal–Wallis rank sum test was used for normally distributed and skewed variables, respectively. For dichotomous and categorical variables, Pearson’s chi-squared or Fisher’s exact tests were used. Associations between continuous variables were assessed using Spearman’s univariate correlation, with Bonferroni-adjusted P-values to account for multiple comparisons. Multivariable linear regression was used to identify independent determinants of key bone histomorphometric variables, applying a stepwise backward selection with P < 0.20, followed by a forward selection with P < 0.05. All statistical analyses were performed using Stata IC version 16.1 (StataCorp, College Station, TX, USA).
RESULTS
Demography
Demographic data including relevant medical therapy are given in Table 1. The majority of patients had received chronic intermittent haemodialysis (64%) or continuous peritoneal dialysis (30%) prior to kidney transplantation, with a median dialysis vintage of 26 months (IQR 14–37). Immunosuppression was achieved with tacrolimus for nearly all (96%); a single patient received cyclosporine. Steroids had been halted in 21% of patients and the current prednisolone dose for the remaining was 2–4 mg, with the exception of one patient receiving 10 mg. The cumulative steroid dose in the overall cohort amounted to 2.45 g (IQR 1.84–2.93). Thirty-six patients (26%) experienced at least one episode of acute rejection during the first post-transplant year. The cumulative steroid dose in these patients was 4.57 g (IQR 2.47–5.63). The mean eGFR was 49 ± 16 mL/min/1.73 m2; 12 patients had an eGFR <30 mL/min/1.73 m2 and none <15 mL/min/1.73 m2. The prevalence of metabolic acidosis, defined as either a serum bicarbonate <20 mmol/L or the use of oral bicarbonate supplement, was 41%.
Demographic data 12 months after kidney transplantation (N = 141)
| Characteristics | Values |
|---|---|
| Age ( years), mean ± SD | 57 ± 11 |
| Male, n (%) | 100 (71) |
| BMI (kg/m2), mean ± SD | 25.3 ± 4.9 |
| Dialysis vintage (months), median (IQR) | 26 (14–37) |
| Diabetes mellitus type 1, n (%) | 5 (3.5) |
| Diabetes mellitus type 2, n (%) | 42 (30) |
| Previous parathyroidectomy, n (%) | 15 (11) |
| Previous fracture, n (%) | 14 (10) |
| Cause of kidney failure, n (%) | |
| Cystic/hereditary/congenital diseases | 34 (24) |
| Glomerulonephritis/vasculitis | 33 (23) |
| Diabetic nephropathy | 14 (10) |
| Hypertensive/large vessel disease | 14 (10) |
| Interstitial nephritis | 8 (6) |
| Miscellaneous | 6 (4) |
| Unknown | 32 (23) |
| eGFR (mL/min/1.73 m2), mean ± SD | 49 ± 16 |
| Biointact PTH (ρg/mL), median (IQR) (normal 3–40) | 56 (39–109) |
| PO4 (mg/dL), mean ± SD | 3.09 ± 0.71 |
| Total Ca (mg/dL), mean ± SD | 9.74 ± 0.88 |
| Calcidiol (ng/mL), mean ± SD | 36 ± 14 |
| Bicarbonate (mmol/L), mean ± SD | 23.0 ± 2.9 |
| 24-h UCa (mg), median (IQR) | 90 (43–141) |
| 24-h UFECa (%), median (IQR) (normal 1–2%) | 1.0 (0.6–1.5) |
| 24-h UPO4 (mg), median (IQR) | 846 (663–1106) |
| 24-h UFEPO4 (%), median (IQR) (normal 0–25%) | 33 (24–40) |
| Current medical therapy, n (%) | |
| Prednisolone | 111 (79) |
| Calcineurin inhibitor | 137 (97) |
| Antimetabolite | 122 (87) |
| Ca supplement | 33 (23) |
| Nutritional vitamin D | 58 (41) |
| Active vitamin D | 19 (13) |
| Cinacalcet | 1 (0.7) |
| Bicarbonate supplement | 50 (35) |
Renal osteodystrophy
Distribution of bone TMV at 12 months post-transplant is shown in Figure 1 and patient characteristics according to the TMV classification are given in Table 2. Bone turnover was normal in the majority (71%), with low turnover in 26% and high turnover in 3% of patients. Patients with low bone turnover had received a 22% higher cumulative dose of steroids compared with those with normal bone turnover. There was a trend towards lower levels of calcidiol in patients with high turnover. The biochemical bone turnover markers (BsAP, intact PINP and TRAP5b) were significantly lower in patients with low bone turnover and numerically higher in patients with high turnover.
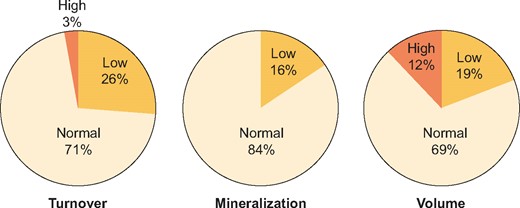
Disturbances of bone TMV by transiliac bone biopsy 1 year after kidney transplantation.
Patient characteristics based on classification of bone TMV
| Characteristics | Turnover | Mineralization | Volume | ||||
|---|---|---|---|---|---|---|---|
| Low (n = 37) | Normal (n = 100) | High (n = 4) | Normal (n = 119) | Delayed (n = 22) | Normal (n = 114) | Low (n = 27) | |
| Age (years), mean ± SD | 60 ± 11 | 56 ± 11 | 55 ± 12 | 58 ± 11 | 52 ± 11** | 56 ± 12 | 61 ± 9* |
| Male, n (%) | 29 (78) | 68 (68) | 3 (75) | 84 (71) | 16 (73) | 78 (68) | 22 (82) |
| BMI (kg/m2), mean ± SD | 25.7 ± 4.9 | 25.3 ± 5.0 | 22.9 ± 2.8 | 24.8 ± 4.3 | 28.0 ± 7.2** | 25.5 ± 5.0 | 24.6 ± 4.8 |
| Dialysis vintage (months), median (IQR) | 29 (19–36) | 25 (13–38) | 29 (9–56) | 27 (13–40) | 19 (14–29) | 26 (16–35) | 30 (15–57) |
| Diabetes mellitus, n (%) | 14 (38) | 32 (32) | 1 (25) | 43 (36) | 4 (18) | 38 (33) | 9 (33) |
| Cumulative steroids (g), median (IQR) | 2.78 (1.97–4.88)** | 2.39 (1.80–2.85) | 1.70 (1.39–2.74) | 2.36 (1.80–2.89) | 2.85 (2.49–4.80)** | 2.44 (1.80–2.94) | 2.45 (1.97–2.94) |
| eGFR (mL/min/m2), mean ± SD | 48 ± 15 | 50 ± 16 | 47 ± 8 | 50 ± 16 | 46 ± 14 | 50 ± 16 | 47 ± 13 |
| Biointact PTH (ρg/mL), median (IQR) | 53.5 (42.4–78.7) | 60.0 (38.4–115) | 124 (22.9–342) | 53.0 (34.5–89.2) | 137 (66.7–218)** | 56.1 (39.3–110) | 64.4 (38.9–93.9) |
| Biointact PTH (×UNL), median (IQR) | 1.3 (1.1–2.0) | 1.5 (1.0–2.9) | 3.1 (0.7–7.5) | 1.3 (0.9–2.2) | 3.4 (1.7–5.5)** | 1.4 (1.0–2.8) | 1.1 (0.6–1.4) |
| Total AP (U/L), median (IQR) | 68 (52–87)* | 80 (63–95) | 111 (74–243)** | 77 (58–91) | 84 (67–102) | 82 (61–115) | 76 (58–92) |
| BsAP (μg/L), median (IQR) | 16.7 (11.5–23.7)** | 21.9 (14.4–32.4) | 32.8 (19.6–62.2) | 20.1 (13.8–27.2) | 25.8 (16.4–37.2)* | 22.9 (14.0–29.8) | 20.3 (13.9–27.3) |
| Intact PINP (μg/L), median (IQR) | 32.7 (23.2–57.1)** | 62.5 (31.6–102.9) | 103.4 (33.5–151.1) | 50.3 (29.3–86.6) | 60.4 (29.5–103.4) | 41.5 (31.3–91.1) | 56.7 (28.7–89.7) |
| TRAP5b (U/L), median (IQR) | 2.83 (2.03–3.44)** | 3.61 (2.46–4.96) | 4.80 (3.44–5.79) | 3.27 (2.40–4.43) | 3.90 (3.06–5.21) | 3.36 (2.37–4.38) | 3.37 (2.47–4.62) |
| Total Ca (mg/dL), mean ± SD | 9.77 ± 0.54 | 9.73 ± 0.99 | 9.82 ± 0.46 | 9.76 ± 0.64 | 10.00 ± 0.59 | 9.82 ± 0.66 | 9.70 ± 0.48 |
| PO4 (mg/dL), mean ± SD | 3.20 ± 0.67 | 3.04 ± 0.73 | 3.41 ± 0.50 | 3.18 ± 0.68 | 2.68 ± 0.58** | 3.06 ± 0.70 | 3.29 ± 0.62 |
| Calcidiol (μg/L), mean ± SD | 36 ± 15 | 36 ± 14 | 19 ± 7* | 37 ± 14 | 29 ± 12** | 36 ± 14 | 35 ± 15 |
| Bicarbonate (mmol/L), mean ± SD | 23.5 ± 2.9 | 22.9 ± 2.9 | 21.1 ± 4.9 | 23.3 ± 2.9 | 21.3 ± 2.3** | 22.9 ± 2.8 | 23.2 ± 3.4 |
| Magnesium (mg/dL), mean ± SD | 1.69 ± 0.25 | 1.67 ± 0.23 | 1.63 ± 0.28 | 1.69 ± 0.23 | 1.56 ± 0.22** | 1.66 ± 0.24 | 1.73 ± 0.22 |
| 24-h FECa (%), median (IQR) | 1.0 (0.5–1.4) | 1.0 (0.6–1.5) | 1.4 (0.8–1.8) | 1.0 (0.6–1.4) | 1.3 (0.8–1.6) | 1.0 (0.6–1.5) | 1.1 (0.6–1.4) |
| 24-h FEPO4 (%), mean ± SD | 32 ± 9 | 34 ± 13 | 32 ± 8 | 32 ± 11 | 40 ± 14** | 34 ± 12 | 32 ± 10 |
| Sclerostin (ρg/mL), median (IQR) | 627 (468–911) | 558 (440–768) | 493 (208–631) | 594 (461–805) | 457 (372–590)** | 582 (457–799) | 548 (654–1041) |
| sRANKL (ρg/mL), median (IQR) | 1.9 (1.2–2.4) | 2.1 (1.0–3.3) | 2.1 (1.2–2.4) | 2.0 (1.0–2.7) | 2.4 (1.3–4.1) | 2.2 (1.2–3.1) | 1.4 (0.5–2.1)** |
| OPG (ρg/mL), median (IQR) | 84 (51–103) | 80 (59–100) | 80 (24–112) | 83 (59–105) | 70 (44–92)* | 79 (57–98) | 94 (68–124)** |
*P < 0.10 and **P < 0.05 compared to ‘normal’.
×UNL, times upper normal limit.
Delayed mineralization was seen in 16% of patients, none of which had overt osteomalacia. Patients with delayed mineralization were younger and more obese and had received a 26% higher cumulative dose of steroids. Delayed mineralization was associated with higher levels of biointact PTH, a higher 24-h urinary FEPO4 and lower levels of PO4, calcidiol, magnesium, bicarbonate and sclerostin.
Bone volume was low in 18% of patients, who tended to be older but otherwise had comparable demography to that of patients with normal bone volume. sRANKL levels were lower, with a trend towards higher OPG levels, and consequently the OPG:sRANKL ratio was significantly higher (median 51 versus 34; P = 0.003) in patients with low bone volume.
Bone densitometry
A DXA scan was available for 108 patients (77%) at the lumbar spine, 106 (75%) at the proximal femur and 91 (65%) at the distal forearm. The prevalence of osteoporosis and osteopenia as defined by DXA T-scores at different skeletal sites is shown in Figure 2. Osteoporosis prevalence was comparable across categories of bone turnover and between patients with and without delayed mineralization (Table 3). The diagnostic overlap between low bone volume on bone biopsy versus low BMD by DXA was incomplete; only 33% of patients with DXA-defined osteoporosis at the femoral neck were categorized as having low bone volume by bone histomorphometry.
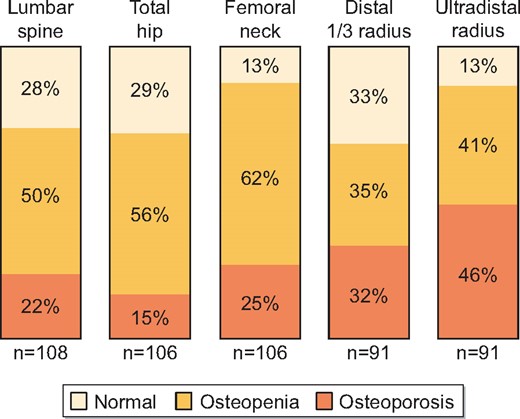
Osteoporosis (T-score <−2.5) and osteopenia (T-score −1.0 to −2.5) by DXA at different skeletal sites 1 year after kidney transplantation.
Demographic variables and bone TMV by transiliac bone biopsy in patients with and without osteoporosis by DXA at different skeletal sites
| Variables | Lumbar spine | Femoral neck | Distal 1/3 radius | Ultradistal radius | ||||
|---|---|---|---|---|---|---|---|---|
| T-score ≥−2.5 | Osteoporosis | T-score ≥−2.5 | Osteoporosis | T-score ≥−2.5 | Osteoporosis | T-score ≥−2.5 | Osteoporosis | |
| (n = 84) | (n = 24) | (n = 79) | (n = 27) | (n = 62) | (n = 29) | (n = 49) | (n = 42) | |
| Age (years), mean ± SD | 55 ± 12 | 60 ± 11* | 55 ± 12 | 61 ± 9.5** | 55 ± 11 | 60 ± 12* | 54 ± 12 | 61 ± 10** |
| Male, n (%) | 63 (75) | 13 (54)* | 53 (67) | 21 (78) | 42 (68) | 20 (69) | 26 (53) | 36 (86)** |
| BMI (kg/m2), mean ± SD | 25.7 ± 4.9 | 23.4 ± 3.9** | 25.7 ± 5.1 | 23.7 ± 3.6* | 25.4 ± 5.2 | 24.3 ± 4.7 | 26.4 ± 5.2 | 23.5 ± 4.3** |
| Dialysis vintage (months), median (IQR) | 22 (10–35) | 31 (19–55)** | 24 (10–36) | 31 (15–45) | 21 (8–32) | 33 (14–54)** | 21 (8–35) | 31 (13–47) |
| Diabetes mellitus, n (%) | 29 (35) | 7 (29) | 26 (33) | 10 (37) | 22 (36) | 7 (24) | 12 (25) | 17 (41) |
| Cumulative steroids (g), median (IQR) | 2.4 (1.8 –2.8) | 2.3 (1.6–3.1) | 2.3 (1.8–2.9) | 2.4 (1.9–2.8) | 2.4 (1.8–3.0) | 2.2 (1.6–2.8) | 2.4 (1.8–2.9) | 2.3 (1.8–2.8) |
| TMV classification | ||||||||
| Turnover, n (%) | ||||||||
| Low | 17 (20) | 6 (25) | 18 (23) | 4 (15) | 14 (23) | 5 (17) | 9 (18) | 10 (24) |
| Normal | 65 (77) | 17 (71) | 59 (75) | 22 (82) | 47 (76) | 22 (76) | 39 (80) | 30 (71) |
| High | 2 (2) | 1 (4) | 2 (3) | 1 (4) | 1 (2) | 2 (7) | 1 (2) | 2 (5) |
| Mineralization, n (%) | ||||||||
| Normal | 71 (85) | 23 (96) | 67 (85) | 25 (93) | 52 (84) | 28 (97) | 42 (86) | 38 (91) |
| Delayed | 13 (15) | 1 (4) | 12 (15) | 2 (7) | 10 (16) | 1 (3)* | 7 (14) | 4 (10) |
| Volume, n (%) | ||||||||
| Low | 12 (14) | 9 (38)** | 11 (14) | 9 (33)** | 10 (16) | 9 (31)* | 9 (18) | 10 (24) |
| Normal | 72 (86) | 15 (62) | 68 (86) | 18 (67) | 52 (84) | 20 (69) | 40 (82) | 32 (76) |
*P < 0.10 and **P < 0.05 by Student’s t-test, Wilcoxon rank sum test or Pearson’s chi-squared test.
Mineral metabolism
Only 44 patients (31%) had all biochemical parameters of mineral metabolism within the target range. Hyperparathyroidism (biointact PTH >1.5 times above the normal range) was the most prevalent disturbance (47%), while vitamin D insufficiency (calcidiol <30 ng/mL) was seen in 38%, hypercalcaemia (total Ca >10.3 mg/dL) in 18% and hypophosphataemia (PO4 <2.3 mg/dL) in 13% of patients. Vitamin D deficiency (<15 ng/mL) was detected in just 4%. There was a noticeable overlap between these categories (Figure 3).
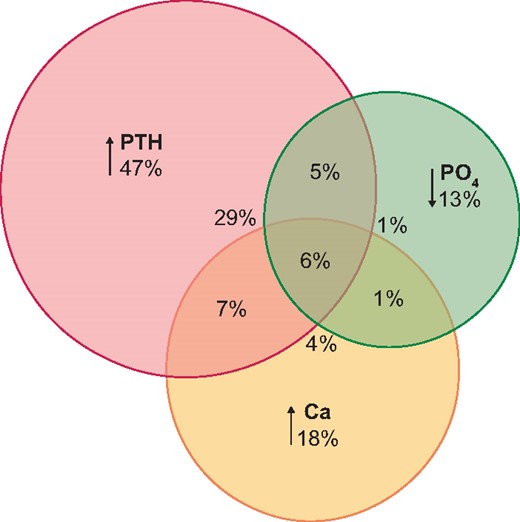
Disturbances of mineral metabolism 1 year after kidney transplantation: hyperparathyroidism (biointact PTH >1.5× upper normal limit), hypophosphataemia (PO4 < 2.3 mg/dL) and hypercalcaemia (total Ca >10.3 mg/dL).
Histomorphometric findings in patients with disturbed mineral metabolism are provided in Table 4. Hyperparathyroidism was associated with higher bone turnover, while this was not the case for hypercalcaemia. Patients with hypophosphataemia had greater amounts of osteoid and were more likely to have delayed mineralization (39 versus 12%; P = 0.004) as compared with patients with normal PO4 levels. In accordance with these findings, biointact PTH was directly correlated to all parameters of skeletal remodelling, while the PO4 level correlated inversely with parameters of mineralization (Supplementary data, Table S2).
Bone histomorphometry in different categories of mineral metabolism disturbances after kidney transplantation
| Histomorphometric parameters | PTH ≤1.5 ×UNL (n = 71) | PTH >1.5 ×UNL (n = 67) | Ca ≤10.3 mg/dL (n = 114) | Ca >10.3 mg/dL (n = 26) | PO4 ≥2.3 mg/dL (n = 123) | PO4 <2.3 mg/dL (n = 18) | Calcidiol ≥ 30 ng/mL (n = 85) | Calcidiol <30 ng/mL (n = 53) |
|---|---|---|---|---|---|---|---|---|
| BFR/TAr (μm2/mm2/day) | 110 (40–198) | 185 (66–372)** | 130 (44–221) | 193 (36–309) | 134 (44–229) | 208 (57–496) | 138 (42–229) | 138 (49–278) |
| MPm/BPm (%) | 4.4 (2.5–7.7) | 8.6 (3.1–12.7)** | 5.0 (2.7–9.6) | 8.7 (2.4–12.5) | 5.4 (2.7–9.9) | 7.4 (3.1–14.9) | 5.9 (2.8–9.7) | 4.7 (2.6–10.7) |
| MLT (days) | 29 (20–51) | 46 (22–78)** | 32 (20–65) | 46 (21–80) | 33 (20–59) | 55 (30–86)* | 33 (21–57) | 46 (20–80) |
| ObPm/BPm (%) | 1.2 (0.0–3.3) | 6.6 (1.2–13.4)** | 2.0 (0.0–7.5) | 2.9 (0.9–7.5) | 2.1 (0.5–7.3) | 3.6 (0.9–10.9) | 2.7 (0.6–7.2) | 1.5 (0.0–12.0) |
| OcPm/BPm (%) | 0.1 (0.0–0.6) | 0.6 (0.3–1.2)** | 0.4 (0.0–0.9) | 0.6 (0.2–0.9) | 0.4 (0.0–0.9) | 0.5 (0.3–0.9) | 0.4 (0.0–1.0) | 0.5 (0.0–0.8) |
| EPm/BPm (%) | 1.6 (0.6–3.3) | 2.6 (1.3–4.3)** | 2.2 (0.9–3.6) | 3.4 (1.4–4.5)** | 2.2 (1.0–3.9) | 2.5 (1.3–3.5) | 2.3 (1.0–3.9) | 2.3 (1.0–3.9) |
| OAr/BAr (%) | 1.4 (0.8–2.8) | 3.5 (1.9–7.0)** | 2.0 (0.9–4.4) | 3.1 (1.3–6.4) | 2.0 (1.0–4.3) | 4.2 (2.2–8.5)** | 2.0 (0.9–4.2) | 3.1 (1.2–6.1) |
| OPm/BPm (%) | 13.3 (9.0–21.0) | 31.1 (18.3–47.9)** | 17.7 (10.0–31.2) | 24.7 (13.5–42.4) | 16.6 (10.1–30.5) | 33.5 (18.9–49.5)** | 15.7 (10.0–29.2) | 24.8 (10.8–38.6) |
| OWi (μm) | 6.6 (5.4–9.3) | 8.0 (5.9–10.0) | 6.9 (5.4–9.4) | 7.5 (6.2–10.6) | 6.9 (5.4–9.4) | 8.7 (6.2–10.8) | 6.6 (5.3–9.3) | 7.6 (6.1–10.7)** |
| BAr/TAr (%), mean ± SD | 20.0 ± 6.5 | 20.2 ± 5.8 | 20.3 ± 6.5 | 19.5 ± 4.9 | 20.0 ± 6.3 | 21.6 ± 5.2 | 19.6 ± 6.1 | 20.9 ± 6.3 |
Data median (IQR) unless stated otherwise. *P < 0.10 and **P < 0.05 by Student’s t-test, Wilcoxon rank sum test or Pearson’s chi-squared test. MPm, mineralizing perimeter; ObPm, osteoblast perimeter; OcPm, osteoclast perimeter; EPm, eroded perimeter; OPm, osteoid perimeter; OWi, osteoid width, BPm, bone perimeter.
Determinants of bone TMV
To identify independent determinants of TMV status, we performed multivariable linear regression analyses with key bone histomorphometric parameters as the outcome and a stepwise backwards selection of explanatory variables, including demographics, post-transplant kidney function, cumulative steroid dose and biochemical markers of mineral metabolism. Results of univariate analyses are given in Supplementary data, Table S3.
Independent determinants of bone turnover (BFR) were PTH (β = 0.684, P < 0.001) and cumulative steroid dose (β = −0.218, P = 0.02; model adjusted R2 = 16%). Determinants of mineralization (MLT) were PO4 (β = −0.481, P = 0.001) and cumulative steroid dose (β = 0.182, P = 0.004; model adjusted R2 = 15%) and determinants of bone volume (BAr/TAr) were age (β = −0.150, P = 0.002) and body mass index (BMI; β = 0.331, P = 0.002; model adjusted R2 = 11%).
DISCUSSION
The key findings of this study detailing bone phenotype at 1 year post-transplant are that bone turnover is normal in the majority of kidney transplant recipients; high bone turnover is rare, despite a high prevalence of hyperparathyroidism; and delayed bone mineralization is seen in a subset of patients and is associated with disturbed mineral metabolism.
Bone turnover
Bone turnover was low or normal in 97% of patients at 1 year post-transplant. This should be seen in the context of the current pattern of renal osteodystrophy pre-transplant, where low bone turnover is reported in 60–80% of Caucasian patients with kidney failure [4, 24]. Recent studies in kidney transplant recipients similarly report mainly low (26–64%) or normal (17–48%) bone turnover, with the prevalence of high turnover in the range of 0–19% [10, 11, 14, 25, 26]. Variation between studies may be explained by the heterogeneity of patient characteristics, particularly time since transplantation, as well as differences in diagnostic criteria of histomorphometry. As bone biopsies were performed not on indication, but per research protocol, our findings should be representative of the current pattern of renal osteodystrophy in kidney transplant recipients.
The clinical consequence of low bone turnover post-transplant is unknown. Medically induced low bone turnover is the hallmark of osteoporosis treatment, aiming to reduce bone loss by inhibiting bone resorption. In the setting of CKD, however, low bone turnover is characterized by reductions in both bone formation and resorption, a combination that may negatively impact bone mechanical properties [27]. In patients with kidney failure, low bone turnover associates with older age and a greater burden of comorbidity [28], representing important confounders for the clinical implications of this phenotype.
Determinants of BFR, the key histomorphometric parameter of bone turnover, were current PTH level and cumulative steroid dose. The direct association with PTH is consistent with our understanding of the effects of hyperparathyroidism on skeletal remodelling. The inverse relationship between bone turnover and steroids is also well known [12, 13], as decreased bone formation due to inhibition of osteoblast function is the key mechanism behind corticosteroid-related bone loss [29].
High bone turnover was a rare finding 1 year post-transplant, observed in just 3% of patients. This low occurrence, despite a high prevalence of hyperparathyroidism, could imply continued skeletal resistance to PTH in kidney transplant recipients [30]. We used a cutoff of 1.5 times the upper limit of the normal range to define hyperparathyroidism, but there is no clear recommendation on what PTH range to target post-transplant [2]. Indeed, if PTH hyporesponsiveness remains an issue post-transplant, the optimal range of PTH may vary depending on kidney function.
Hyperparathyroidism with hypercalcaemia was not indicative of high bone turnover, supporting previous reports [10, 31]. Hypercalcaemia was also not associated with elevated histomorphometric parameters of skeletal remodelling, suggesting that mechanisms other than skeletal efflux of Ca, i.e. increased gastrointestinal uptake or renal Ca reabsorption, are involved in hypercalcaemia post-transplant. The latter seems likely, as the UCa excretion was generally low. Both hyperparathyroidism and increasing levels of calcitriol may contribute to increased renal Ca reabsorption post-transplant [32]. Additional studies are required to clarify the pathophysiology, as well as the consequence, of hypercalcaemia in kidney transplant recipients.
Bone mineralization
Delayed mineralization was present in 16% of patients in this cohort. Previous studies report mineralization defects in the range of 22–88%, with no clear trends depending on the time since transplantation [10, 11, 13, 14, 26]. Several definitions are currently in use to describe abnormal mineralization in renal osteodystrophy, rendering comparisons difficult. We used a semi-quantitative approach, defining delayed mineralization as prolonged MLT (> 50 days) with increased amounts of osteoid either focally or globally. None of our patients had overt osteomalacia, a phenotype that has become rare after the disappearance of aluminium bone disease [24].
Low levels of PO4, calcidiol, bicarbonate and sclerostin were associated with delayed mineralization. Adequate PO4 and vitamin D levels are necessary for normal biomineralization [33]. While vitamin D levels were lower in patients with delayed mineralization, calcidiol was not an independent predictor of MLT and did not correlate with histomorphometric parameters. Two previous studies failed to find an association between calcidiol and bone mineralization in kidney transplant recipients [13, 14]. Hypophosphataemia has been implicated in osteoblast apoptosis in the early post-transplant period [12] and, similar to our findings, lower PO4 levels were reported in patients with delayed mineralization >2 years after kidney transplantation [14]. A normal physiological response to hypophosphataemia is to increase renal PO4 reabsorption, virtually abolishing PO4 in the urine, but kidney transplant recipients have a high urinary PO4 excretion [31], likely due to effects of ongoing hyperparathyroidism and hyperphosphatoninism on the kidney graft [34, 35]. Consistent with this, our 24-h urinary analysis revealed a high FEPO4 in this cohort, and particularly so in patients with delayed bone mineralization. Although low levels of PO4 associate with better long-term outcomes post-transplant, with reduced risk of graft failure and cardiovascular events [36], our findings highlight potential harmful effects in bone. In line with this, hypophosphataemia was associated with fractures in a retrospective analysis of kidney transplant recipients [37].
Metabolic acidosis leads to bone demineralization as excess protons are buffered through dissolution of skeletal calcium carbonate [38] and may also inhibit osteoblast differentiation and function [39]. The potential effect of bicarbonate supplementation on bone quality in CKD is poorly investigated. Metabolic acidosis associates with low BMD in kidney transplant recipients [40] and correction improved bone microarchitecture in one study that included histomorphometry; unfortunately, bone mineralization was not reported [41]. Lastly, the sclerostin level was 26% lower in patients with delayed mineralization. Although a potential role of sclerostin in bone mineralization has been proposed [42], this finding may also reflect the inverse relation between sclerostin and PTH levels [43].
Bone volume
Bone volume was low in 19% of patients at 1 year post-transplant, as evaluated by the bone biopsy. Previous studies report higher prevalence of 26–56%, generally increasing with time since kidney transplantation [11, 13, 14]. Patients with low bone volume had higher levels of OPG—a counterintuitive finding considering that the role of OPG in bone remodelling is to inhibit osteoclast differentiation. Nevertheless, an inverse relationship between OPG levels and BMD was previously reported in patients with CKD [44, 45]. As OPG and sRANKL are effectors of bone metabolism, their relationship with bone mass is likely complex. The only independent determinants of bone volume in this cohort were age and BMI, which explained just 11% of the variation in BAr/TAr. Cumulative steroid dose was not correlated to bone volume, in contrast to previous reports [10, 13]. However, as this was a cross-sectional study, we could not evaluate the effect of steroid exposure on bone loss.
Osteoporosis as defined by DXA T-scores was present in 15–46% of patients, with the highest prevalence at the distal skeleton. The overlap between low bone volume by bone biopsy versus low BMD by DXA was not impressive, as two-thirds of patients with DXA-defined osteoporosis at the femoral neck were classified as having normal bone volume by bone histomorphometry. Previous studies similarly report moderate correlations at most between bone volume by bone biopsy and BMD by DXA [10, 11, 46]. Bone histomorphometry is likely the less suitable method for assessing bone mass, as the sample size is small and findings are specific for the site of the bone biopsy, i.e. the iliac crest. In contrast, DXA BMD captures a much larger area of bone and can be measured at several different skeletal sites. DXA BMD is rapidly gaining acceptance as a clinically relevant measure of bone fragility in CKD [2, 47], although, as an important limitation, it cannot inform on disturbances of skeletal remodelling and mineralization, which are the hallmarks of renal osteodystrophy.
There was no difference in the prevalence of osteoporosis across categories of bone turnover, nor between patients with or without delayed mineralization. The majority of patients with DXA-defined osteoporosis, irrespective of skeletal site, had normal bone biopsy findings, which may to some degree alleviate fears of exacerbating low turnover states or disturbed mineralization when considering antiresorptive therapy aimed at reducing fracture risk post-transplant. Biochemical markers of skeletal remodelling could potentially aid such treatment decisions; levels of BsAP, intact PINP and TRAP5b were all significantly lower in patients with low bone turnover and have previously been shown to discriminate bone turnover in patients with kidney failure [48]. As these biomarkers do not accumulate in CKD [49], they may be particularly suitable in the post-transplant setting; however, this remains to be investigated.
STRENGTHS AND LIMITATIONS
Strengths of this study include the substantial number of bone biopsies, the unselected nature of the cohort and the standardized post-transplant window. Kidney graft function, immunosuppression and mineral metabolism all stabilize at ~12 weeks post-transplant, leaving 9 months for the bone to adapt to the altered metabolic environment. An experienced bone pathologist blinded to patient characteristics performed a full quantitative histomorphometric analysis. The cross-sectional single-centre design may be considered the main limitation. All participants were Caucasian, which may limit generalizability to cohorts of other ethnicities. We report total Ca levels, which have been shown to underestimate hypercalcaemia [50]. Despite these limitations, this is, to our knowledge, the largest study evaluating renal osteodystrophy by bone histomorphometry in kidney transplant recipients to date, and as patients were unselected, results should be representative of this patient population. There is a lack of consensus on diagnostic cutoffs defining the lesions of renal osteodystrophy, and several different normative references are currently in use. Applying different diagnostic cut-offs would affect the prevalence of disturbed bone turnover and mineralization. Achieving a broad consensus on the applied methodology, appropriate reference ranges and diagnostic cut-offs of bone histomorphometry for the diagnosis of renal ostodystrophy is an urgent priority [15].
CONCLUSIONS AND FUTURE ASPECTS
In conclusion, bone turnover is low to normal in the majority of kidney transplant recipients at 1 year post-transplant. High bone turnover is a rare finding, despite persistent hyperparathyroidism, suggesting that PTH is a poor guide for treatment decisions. While a bone biopsy remains the gold standard to evaluate bone turnover, it is both invasive and time-consuming, and non-invasive alternatives are clearly needed. Promising results have been shown for novel biochemical markers of skeletal remodelling, although diagnostic accuracy studies are needed to validate these in the post-transplant setting. Importantly, the clinical implications of the different renal osteodystrophy phenotypes post-transplant are largely unknown and deserve further investigation. Collaborative efforts like the European Renal Osteodystrophy initiative [15] may be expected to deliver robust outcome data in the future.
SUPPLEMENTARY DATA
Supplementary data are available at ndt online.
ACKNOWLEDGEMENTS
The authors would like to acknowledge the excellent technical support of Marc Dekens, Henriette de Loor, Albert Herelixka and Herman Borghs at KU/UZ Leuven and thank the centres of the Leuven Collaborative Group for Renal Transplantation, the clinicians and surgeons, nursing staff and patients who participated in this study.
FUNDING
H.S.J. was supported by an ERA-EDTA long-term fellowship in the Chronic Kidney Disease–Mineral and Bone Disorder Working Group and received financial support from the Augustinus Foundation and Kornings Fund at the time of this study.
AUTHORS’ CONTRIBUTIONS
P.E. was responsible for the conception and design of the study. H.S.J. performed data analyses and drafted the first version of the article. All authors provided intellectual content of importance to the performance of the study, contributed to the analysis and interpretation of the data and critically revised the manuscript.
CONFLICT OF INTEREST STATEMENT
B.B. reports grants and other support from Otsuka Pharmaceutical and other support from Baxter, outside the submitted work. K.C. reports other support from Astellas, AstraZeneca and Alexion, outside the submitted work. B.M. reports grants and personal fees from Nipro and personal fees from AstraZeneca, Baxter and Bayer, outside the submitted work. P.E. reports personal and other fees from Amgen, outside the submitted work. B.S. and M.N. are senior clinical investigators of the Research Foundation Flanders (1842919 N and 1844019 N, respectively). The remaining authors report no conflicts of interest.
DATA AVAILABILITY STATEMENT
The data underlying this article cannot be shared publicly due to the privacy of individuals who participated in the study. The data will be shared upon reasonable request to the corresponding author.


Comments