


Abstract
Background. Residual renal function influences morbidity, mortality and quality of life of chronic dialysis patients. Residual glomerular filtration rate (rGFR) is therefore an important parameter in the follow-up of these patients. Because rGFR is measured as the mean of creatinine and urea clearance, a complete 24 h urine collection is essential, but often very difficult to manage for these patients.
Methods. We investigated if plasma cystatin C (cysC) could give a good estimate of rGFR in dialysis patients and compared it to the measured rGFR, as well as to the rGFR estimate obtained with the Modification of Diet in Renal Disease (MDRD) formula. A total of 465 patients were included in this study. CysC levels of 215 haemodialysis (HD) and 95 chronic ambulatory peritoneal dialysis (PD) patients were used to derive a formula for rGFR. This formula was tested in the validation group of 107 HD and 48 PD patients.
Results. The cysC formula derived in the modelling group was rGFR = −0.70 + 22 × (1/cysC). The mean estimated rGFR obtained with this formula in the validation group was not significantly different from the mean measured rGFR: difference 0.19 ml/min/1.73 m 2 , 95% confidence interval (CI) −2.37 to 2.75 ml/min/1.73 m 2 . The MDRD formula gave a larger difference from the mean measured rGFR (3.13 ml/min/1.73 m 2 ) and a much wider 95% CI (−1.29 to 7.55 ml/min/1.73 m 2 ). A separate model for HD and PD patients did not improve the estimation of rGFR.
Conclusions. The cysC formula showed better accuracy and precision than the MDRD formula. Therefore the cysC formula and not the MDRD formula should be used to calculate rGFR in dialysis patients when no 24 h urine sample is available.
Introduction
Residual renal function is recognized as a significant factor influencing morbidity, mortality and quality of life in chronic dialysis patients [ 1–5 ]. Residual glomerular filtration rate (rGFR) is therefore one of the parameters recorded in the inclusion and follow-up of patients participating in the Netherlands Cooperative Study on the Adequacy of Dialysis, phase 2 (NECOSAD-2). It is calculated as the mean of creatinine and urea clearance and corrected for body surface area. This provides an accurate approximation of the glomerular filtration rate (GFR) in end-stage renal failure [ 6 ].
Yet, collection of urine for 24 h, or even during a complete interdialytic interval, is a heavy burden for chronic dialysis patients. Therefore alternative methods to estimate rGFR based on just a plasma analyte would be welcome. The search for an alternative led us to plasma cystatin C (cysC) as a good possibility. CysC, a low molecular weight plasma protein, is the product of a housekeeping gene and therefore synthesized by all nucleated cells. Its rate of synthesis is almost constant in most situations. Only dexamethasone [ 7 ], hyper- and hypothyroidism [ 8 , 9 ] might influence the plasma cysC level to some extent. We and others have demonstrated that plasma cysC can be used for accurate estimation of GFR in patients with various degrees of impairment of renal function [ 10–13 ].
Many studies have been published on the relative merits of cysC and creatinine for the estimation of renal function [ 14 ]. Much of the attention has been focused on the range of mild renal dysfunction where cysC offers higher sensitivity compared to creatinine. Our own results, obtained in patients with renal function ranging from normal to severely abnormal, showed that cysC levels could be used to estimate GFR more accurately and more precisely than when plasma creatinine was used with application of the Cockcroft & Gault formula [ 10 ].
The other end of the spectrum, the area of severe renal dysfunction/renal failure, has received very little attention so far. Bökenkamp et al . [ 15 ] tested the effects of kidney failure on cysC levels in an animal model. Kabanda et al . [ 16 , 17 ] compared the plasma levels of low molecular weight proteins like β 2 -microglobulin and cysC in haemodialysis (HD) and chronic peritoneal dialysis (PD). Only recently Balik et al . [ 18 ] reported a study investigating cysC as a marker of residual renal function during continuous haemodiafiltration.
The modification of diet in renal disease (MDRD) formula [ 19 ] offers an alternative way to estimate rGFR in the absence of an adequate 24 h urine collection. The formula can be expected to overestimate rGFR as a consequence of tubular excretion of creatinine, but has not been validated in these patient categories. However, the equation has been developed for patients with GFR down to 10–15 ml/min/1.73 m 2 , and it is known that measurement error is lower at lower GFR levels. Below 18 ml/min/1.73 m 2 the contribution of tubular excretion of creatinine decreases [ 20 ]. Therefore a GFR estimate below 10–15 ml/min/1.73 m 2 might be more accurate than one somewhat above that level.
The aim of the present study was to assess how well rGFR can be estimated from a plasma cysC measurement in end-stage renal disease (ESRD) patients on HD or PD, and whether this gives a better estimation of rGFR compared with the existing MDRD formula.
Patients and methods
Patients
The patients investigated in this study were taken from the Netherlands Cooperative Study on the Adequacy of Dialysis, phase 2 (NECOSAD-2). In the NECOSAD-2 study new ESRD patients, 18 years or older, from 38 dialysis units in the Netherlands were consecutively included between January 1997 and November 1999. For these patients demographic data, clinical data, rGFR measurements, plasma and urine samples were collected at regular time intervals during the course of the study.
From this cohort a random sample of patients was taken. The plasma sample obtained from the patients 6 months after the start of the chronic dialysis treatment was used for the present study. The rGFR, as determined from the mean of the creatinine and the urea clearance at this time, should not exceed 6.5 ml/min/1.73 m 2 . In addition, the urine production had to be at least 200 ml/24 h. Inaccurate urine collections were excluded, as decided by the local nurse after interviewing the patient.
A total number of 465 patients, 322 on HD and 143 on PD, who fulfilled these criteria, were investigated. In the majority (85%) of the HD patients low-flux membrane dialysis was used and in 49 patients (15%) high-flux membrane dialysis. Pre-dialysis cysC and creatinine levels do not differ between these two modalities [ 16 ]. Two-thirds of the HD and two-thirds of the PD patients were randomly assigned to estimation model groups and the remaining one-third of the HD and PD patients were used in the validation groups.
Demographic data and measured weight and height were taken from the NECOSAD-2 records.
Sample collection
According to the NECOSAD-2 protocol, blood samples of the HD patients were drawn before and after a monitoring dialysis session and again before the next dialysis session. Urine was collected during the entire interdialytic interval. For the calculation of rGFR the mean values of the plasma creatinine and urea concentrations after a monitoring dialysis session and those before the next dialysis session were used. The plasma sample taken before the monitoring dialysis session was used for the cysC analysis and for the creatinine measurement used in the MDRD formula.
In the PD patients, a 24 h urine and dialysate collection was done prior to a monitoring visit at the outpatient clinic and the blood sample was drawn on that visit.
Analysis
All creatinine and urea measurements in plasma and urine were performed with routine methods in the participating renal units. For the plasma creatinine usually the Jaffé methodology was used on different types of routine analysers, but in a part of the patients an enzymatic creatinine assay was used. For the high creatinine levels found in dialysis patients there is no difference in outcome between these methods. The rGFR was calculated as the mean of creatinine and urea clearance and corrected for body surface area. Estimation of the rGFR from the plasma creatinine was done with the simplified MDRD formula: GFR = 186 × (creatinine, in mg/dl) −1.154 × (age) −0.203 × (0.742, if female) × (1.21, if black) [ 19 ]. All GFR values were expressed as ml/min/1.73 m 2 body surface area.
CysC was measured in heparinized plasma samples with the Dade Behring N Latex Cystatin C test kit, a particle-enhanced immunonephelometric method, on the BN ProSpec analyzer (Dade Behring, Leusden, The Netherlands). A total CV of 1.8% was found for the method at a level of 1.04 mg/l cysC and 2.0% at 1.43 mg/l cysC.
Statistics
Statistical analysis was done with SAS version 9.1. Data are given as mean ± SD, unless stated otherwise. Standard descriptive statistics were used. Differences were considered significant when P < 0.05.
Results
Demographic and clinical data of the patients are given in Table 1 . No significant differences were observed between modelling and validation groups for any of the parameters.
Patient characteristics of the HD and PD patients in the modelling and validation groups. Data are given as mean (SD)
| HD modelling group | HD validation group | PD modelling group | PD validation group | |
|---|---|---|---|---|
| N | 215 | 107 | 95 | 48 |
| Age (years) | 61.7 (14.3) | 63.1 (12.6) | 51.6 (13.9) | 52.1 (16.0) |
| Male (%) | 62 | 51 | 63 | 57 |
| Primary kidney disease (%) | ||||
| Diabetes | 13 | 12 | 14 | 10 |
| Glomerulonephritis | 7 | 11 | 18 | 8 |
| Renal vascular disease | 20 | 18 | 15 | 17 |
| Other | 60 | 59 | 54 | 65 |
| Comorbidity score— N (%) Davies | ||||
| Low | 44 | 50 | 67 | 48 |
| Medium | 50 | 41 | 28 | 44 |
| High | 6 | 9 | 4 | 7 |
| Plasma albumin (g/l) | 37 (5) | 36 (4) | 37 (5) | 37 (5) |
| Plasma creatinine (µmol/l) | 876 (216) | 872 (236) | 844 (239) | 766 (210) |
| Cystatin C (mg/l) | 6.1 (1.1) | 5.8 (0.9) | 6.1 (1.2) | 6.0 (1.1) |
| rGFR (ml/min/1.73 m 2 ) | 2.7 (1.3) | 2.8 (1.4) | 3.2 (1.5) | 3.3 (1.5) |
| MDRD rGFR (ml/min/1.73 m 2 ) | 5.5 (1.6) | 5.5 (2.1) | 6.2 (1.9) | 7.0 (2.9) |
Overall, in the HD patients cysC ( r = −0.48) and 1/cysC ( r = 0.48) showed the highest correlation with rGFR, better than creatinine ( r = −0.43) and the MDRD formula ( r = 0.37; p = 0.03). In the PD patients the correlations with rGFR were even better. For cysC the correlation was r = −0.55, for 1/cysC r = 0.53, for creatinine r = −0.56, and for the MDRD formula r = 0.56. The difference between the correlation coefficients for HD and PD patients was not significant. Ln-transformation of the data did not result in a better correlation between rGFR and cysC.
A comparison of the goodness of fit obtained with these formulas in the validation groups with the data obtained using the MDRD formula is presented in Table 2 .
| Mean estimated rGFR (ml/min/1.73 m 2 ) | Mean measured rGFR (ml/min/1.73 m 2 ) | Difference (SD) | Lower limit a | Upper limit a | |
|---|---|---|---|---|---|
| HD patients | |||||
| CysC | 3.01 | 2.77 | 0.24 (1.24) | −2.20 | 2.68 |
| MDRD | 5.55 | 2.77 | 2.78 * (1.97) | −1.07 | 6.65 |
| PD patients | |||||
| CysC | 3.14 | 3.06 | 0.08 (1.38) | −2.62 | 2.78 |
| MDRD | 6.97 | 3.06 | 3.91 * (2.63) | −1.25 | 9.07 |
a Lower and upper limits of agreement; difference between estimated and measured value ±1.96 SD of the difference.
* P < 0.001; estimated and measured rGFR are significantly different.
| Mean estimated rGFR (ml/min/1.73 m 2 ) | Mean measured rGFR (ml/min/1.73 m 2 ) | Difference (SD) | Lower limit a | Upper limit a | |
|---|---|---|---|---|---|
| HD patients | |||||
| CysC | 3.01 | 2.77 | 0.24 (1.24) | −2.20 | 2.68 |
| MDRD | 5.55 | 2.77 | 2.78 * (1.97) | −1.07 | 6.65 |
| PD patients | |||||
| CysC | 3.14 | 3.06 | 0.08 (1.38) | −2.62 | 2.78 |
| MDRD | 6.97 | 3.06 | 3.91 * (2.63) | −1.25 | 9.07 |
a Lower and upper limits of agreement; difference between estimated and measured value ±1.96 SD of the difference.
* P < 0.001; estimated and measured rGFR are significantly different.
In the validation groups, the mean bias of the estimated rGFR based on cysC was negligible for HD as well as for PD patients. In contrast, rGFR estimated with the MDRD formula gave a significant overestimation of the true rGFR. The limits of agreement, as a measure of precision, were the smallest for the cysC formulas. When applied in PD patients, the MDRD formula showed even larger imprecision than in the HD group. As a consequence, the interval between the upper and lower limit given in Table 2 , was smaller for cysC-derived estimates than for estimates obtained with the MDRD formula.
This formula was tested in the combined validation groups, in a total of 155 patients. Also, in these patients the cysC formula performed much better than the MDRD formula ( Table 3 ).
Goodness of fit for rGFR in the combined dialysis validation groups estimated with cysC formula 3 or the MDRD formula
| Mean estimated rGFR (ml/min/1.73 m 2 ) | Mean measured rGFR (ml/min/1.73 m 2 ) | Difference (SD) | Lower limit a | Upper limit a | |
|---|---|---|---|---|---|
| CysC | 3.05 | 2.86 | 0.19 (1.31) | −2.37 | 2.75 |
| MDRD | 5.99 | 2.86 | 3.13 * (2.26) | −1.29 | 7.55 |
| Mean estimated rGFR (ml/min/1.73 m 2 ) | Mean measured rGFR (ml/min/1.73 m 2 ) | Difference (SD) | Lower limit a | Upper limit a | |
|---|---|---|---|---|---|
| CysC | 3.05 | 2.86 | 0.19 (1.31) | −2.37 | 2.75 |
| MDRD | 5.99 | 2.86 | 3.13 * (2.26) | −1.29 | 7.55 |
a Lower and upper limits of agreement; difference between estimated and measured value ±1.96 SD of the difference.
* P < 0.0001.
When the difference between estimated and measured rGFR was plotted for each patient against the measured rGFR for the cysC formula and the MDRD formula separately ( Figure 1 ), the superior accuracy and precision of the cysC formula were evident. With the cysC formula, 42.6% of the estimates were within 30% of the measured rGFR and 65.8% were within 50%. With the MDRD formula, only 14.2% and 23.9% of the estimates were within 30% and 50% respectively of the measured rGFR.
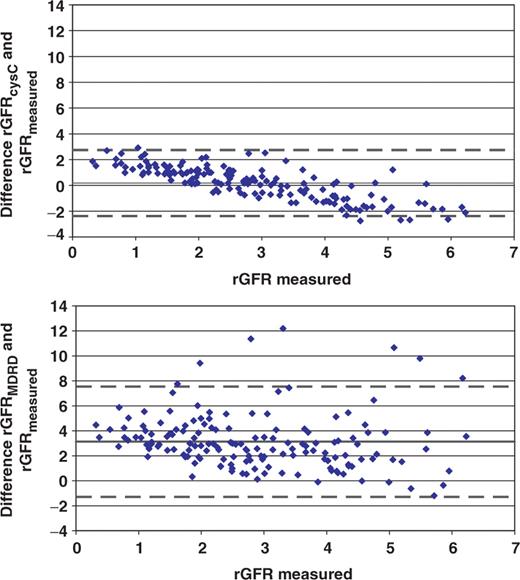
Plot for differences between estimated rGFR, based on cysC (upper panel) or MDRD formula (lower panel) and measured rGFR ( y -axis), against measured rGFR ( x -axis), as found in the validation group with 107 HD patients and 48 PD patients. Mean differences (solid lines) and limits of agreement (dotted lines) are given. All data are given in ml/min/1.73 m 2 .
Discussion
Residual GFR is an important parameter for the management of chronic dialysis patients. In view of its influence on morbidity, mortality and quality of life of these patients it has to be determined on a regular basis. So far the advocated way to determine rGFR in this setting is from the mean of creatinine and urea clearance. But for the clearance measurements a complete and accurate urine collection is mandatory. This procedure is cumbersome for the patient and in a significant number of cases no reliable urine collection is achieved. For lack of an alternative, one is tempted to use the MDRD formula in these cases. However, the MDRD formula can be expected to give an overestimation of the rGFR at this low range, and is indeed shown in this study to do so.
We have chosen not to recalibrate our creatinine results to the Beckman method used in the MDRD study, although several equations have been published to do so [ 21 ]. These equations have only been developed for the normal and the mild to moderate kidney dysfunction range. The effect of creatinine calibration bias and imprecision on the estimated GFR decreases as the creatinine level increases [ 22 ]. In addition, Wuyts et al . [ 23 ] showed that results from compensated Jaffé and enzymatic creatinine methods, as used in the NECOSAD study, can be used in the MDRD formula without restandardization.
Our hypothesis that plasma cysC could be used to predict rGFR in HD as well as in PD patients and that it would perform better than the MDRD formula was put to the test. In the HD patients, the correlation with rGFR was better for 1/cysC than for MDRD results. In the PD patients for all parameters, the correlations with rGFR were comparable but somewhat higher than in the HD patients. All cysC data from the modelling groups were combined into one formula rGFR = −0.70 + 22(1/cysC), which is applicable for all dialysis patients.
GFR values calculated with this formula are three to four times lower than values obtained with the formula presented earlier for patients not on dialysis, with milder renal dysfunction, and controls [ 10 ]. Both formulas are of the type y = a + b (1/ x ). According to Sjöström et al . [ 24 ], constant a would represent the non-renal clearance and constant b the production rate of cysC, multiplied by 1000 to correct for the units (mg/l) in which the cysC result is given. These authors do comment on the difference between their figures and the formula derived by us [ 10 ], but that difference is almost completely due to the different methodologies used in the two studies. Results obtained with the Dade Behring nephelometric method are lower in the low range than the Dako-Cytomation turbidimetric method and higher in the high range. When we converted our cysC results from that study [ 10 ] to turbidimetric values with the formula published by Larsson et al . [ 11 ], the regression equation was similar to the one in the Sjöström study [ 24 ] (results not shown).
However, the use of the Sjöström formula in dialysis patients would be disappointing because it would result in negative rGFR values in almost one half of the patients, those with plasma cysC levels above 6.13 mg/l (nephelometry) or 5.56 mg/l (turbidimetry). On the other hand, our general formula for mild renal impairment [ 10 ] would calculate in the same patients rGFR levels of 2.5 to 16 ml/min/1.73 m 2 with a mean of about 9 ml/min/1.73 m 2 , much too inaccurate for the dialysis patients. Therefore, a separate formula, as presented here, is necessary for the estimation in the low range of rGFR levels observed in the dialysis patients.
The rGFR estimation formula is of the same simple type as the general formula, with the plasma cysC concentration as the only variable. No significant improvements in the fit of the curve were found when weight, plasma albumin, CRP, urinary protein or medication type was included as a variable in the regression analysis (results not shown). The plasma level of cysC was reported to be independent of weight and age, although recently data have been published which are in disagreement with the earlier results and show some association with age, weight and gender and even with C-reactive protein [ 25 , 26 ]. Apparently these associations are too weak to influence the fit to a significant extent.
Constant b in the formula for the dialysis patients derived in the present study is 3.5 times lower than for patients with milder renal dysfunction. This suggests that the production rate of cysC is much lower in end-stage renal failure than in milder renal dysfunction or normal renal function. Some support for this conclusion is found in the studies of Kabanda et al . [ 16 , 17 ] and in the animal model of end-stage renal failure studied by Bökenkamp et al . [ 15 ]. The rise of plasma cysC observed by them in dialysis patients lagged far behind the rise of β 2 -microglobulin and of creatinine. Also in the anephric rats there was a large discrepancy between the increase of cysC to a plateau phase and the continuous increase of creatinine. Partial inhibition of cysC synthesis in end-stage renal failure would be one possible explanation for this phenomenon.
In the present study, a lower value in the dialysis patients than in the patients with milder renal dysfunction was found for constant a as well. However, this lower value was still well within the confidence limits of the value found earlier [ 10 ]. Therefore, no conclusions can be drawn about changes in extra-renal clearance of cysC in dialysis patients.
The results obtained with the MDRD formula were significantly worse than those with the cysC formula. Not only was the overestimation larger, but also the limits of agreement interval was much wider. As a consequence, the number of estimates which differed less than 30% or 50% from the measured rGFR was much lower for the MDRD formula than for the cysC formula.
Both formulas compared in this study do overestimate the true rGFR of the patients, with the lowest residual renal function being more than the rGFR of the patients with a somewhat higher residual function ( Figure 1 ). Minor variations in the degree of inhibition of cysC production could be an explanation with regard to the findings for the cysC formula, but not for the creatinine-based MDRD formula. This similar, in shape as well as in size, downward trend for the difference between estimated and true rGFR with rising rGFR for both the cysC-based formula and the creatinine-based formula might indicate that the gold standard, rGFR, calculated as the mean of creatinine and urea clearance, is to blame here. After all, the mean of creatinine and urea clearance is very useful as a routine measure of rGFR, but it shows some variability compared to the inulin clearance [ 6 ] and this variability might well depend on the size of the rGFR.
In conclusion, with the use of a simple formula an estimate of rGFR in HD and PD patients could be obtained from the plasma cysC concentration. For HD and PD patients the same formula was applicable. This cysC formula gives much better accuracy and precision compared to the MDRD formula. Therefore, plasma cysC should be used to calculate rGFR in dialysis patients in case urine collection is unsuccessful or unreliable. The MDRD formula should not be used for this purpose.
Acknowledgements
The reagents for the cystatin C determinations performed in this study were a gift from Dade Behring, Marburg, Germany.
Conflict of interest statement . None declared.


Comments