


Abstract
As of mid-2021, Australia’s only nationwide coronavirus disease 2019 (COVID-19) epidemic occurred in the first 6 months of the pandemic. Subsequently, there has been limited transmission in most states and territories. Understanding community spread during the first wave was hampered by initial limitations on testing and surveillance. To characterize the prevalence of severe acute respiratory syndrome coronavirus 2 (SARS-CoV-2)-specific antibody seroprevalence generated during this time, we undertook Australia’s largest national SARS-CoV-2 serosurvey.
Between June 19 and August 6, 2020, residual specimens were sampled from people undergoing general pathology testing (all ages), women attending antenatal screening (20–39 years), and blood donors (20–69 years) based on the Australian population’s age and geographic distributions. Specimens were tested by Wantai total SARS-CoV-2-antibody assay. Seroprevalence estimates adjusted for test performance were produced. The SARS-CoV-2 antibody-positive specimens were characterized with microneutralization assays.
Of 11 317 specimens (5132 general pathology; 2972 antenatal; 3213 blood-donors), 71 were positive for SARS-CoV-2-specific antibodies. Seroprevalence estimates were 0.47% (95% credible interval [CrI], 0.04%–0.89%), 0.25% (CrI, 0.03%–0.54%), and 0.23% (CrI, 0.04%–0.54%), respectively. No seropositive specimens had neutralizing antibodies.
Australia’s seroprevalence was extremely low (<0.5%) after the only national COVID-19 wave thus far. These data and the subsequent limited community transmission highlight the population’s naivety to SARS-CoV-2 and the urgency of increasing vaccine-derived protection.
In the first 18 months of the coronavirus disease 2019 (COVID-19) pandemic, Australia has successfully pursued an aggressive suppression strategy [1]. As of July 2021, approximately 30 000 cumulative cases were reported nationally among the population of 26 million [2, 3]. The cumulative rate of COVID-19 in Australia, at 129 cases per 100 000 population, is in the lowest 20% of countries globally [4], and the testing rate per confirmed case is among the highest in the world [5]. In the first year of the pandemic, there were 2 distinct epidemic waves [3]. The first wave, in March–April 2020, affected all 8 Australian states and territories (hereafter jurisdictions), with approximately 7000 cases reported. During this time, the majority of reported cases were acquired overseas [6], but testing criteria were strongly focused on international travelers and their contacts [7], and a high number of the cases detected outside these groups could not be linked to a specific infection source [8]. Therefore, it was possible that case notifications did not capture the full extent of virus transmission during this period. The second wave, in July–September 2020, was confined to the state of Victoria, with approximately 19 000 cases mainly concentrated in the state’s capital, Melbourne [7, 9]. In June 2021, a third COVID-19 outbreak began in Australia’s largest city, Sydney, with approximately 2000 cases reported to the end of July [3]. Outside of these periods, the vast majority of cases have been among quarantined international travelers and infrequently among short-lived community clusters with limited chains of transmission [10]. This reflects Australia’s successful control of COVID-19 through strict public health measures, including international and domestic border closures, mandatory 14-day quarantine for international arrivals, stay-at-home orders, extensive contact tracing and isolation activities, and comprehensive community testing and surveillance systems [1, 7, 10].
Tracking of the pandemic has been largely based on reported COVID-19 cases detected through virus-specific nucleic acid testing (NAT). Reported cases underestimate the true number of infections in the population [11], because they do not account for individuals who do not present for testing for various reasons including the following: having no or minimal symptoms [12], being ineligible (particularly early in the pandemic when NAT reagents were limited), or simply not presenting despite being symptomatic [13]. Since severe acute respiratory syndrome coronavirus 2 (SARS-CoV-2) infection generates detectable antibodies in the vast majority of people [14], measuring population prevalence of SARS-CoV-2-specific antibodies provides an alternative means of estimating cumulative infections [15]. Such studies help to provide a more complete understanding of SARS-CoV-2 spread in diverse settings, which is a key global public health priority [15].
In addition to helping determine the extent to which case reporting has missed infections, serosurveys are key to estimating population susceptibility and hence reliance on vaccination to protect from SARS-CoV-2. Accordingly, we implemented Australia’s largest national SARS-CoV-2 serosurvey after the country’s first (and to date only) national COVID-19 epidemic period.
METHODS
The Australian COVID-19 Serosurveillance Network
The Australian COVID-19 Serosurveillance Network (https://www.ncirs.org.au/our-work/serosurveillance) was formed with representation from health departments in all 8 Australian jurisdictions, 5 major reference laboratories, Australian Red Cross Lifeblood (Lifeblood), and private and public laboratories involved in specimen collection (Figure 1). This structure allowed procedures to be aligned nationally and established a framework for repeat serosurveys. A laboratory expert subgroup was convened to advise on testing. In consultation with jurisdictional health departments and with the goal of achieving broad geographical coverage and population diversity, public and private laboratories were approached to participate in specimen collection for general pathology and antenatal screening populations. Nineteen representative public and private laboratories provided specimens (Figure 1).
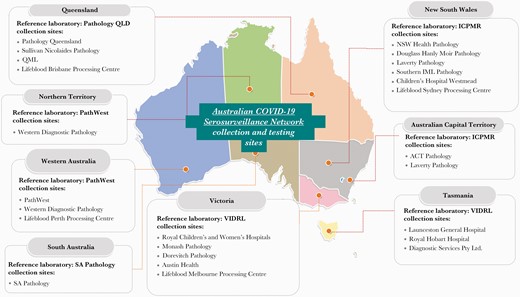
Australian COVID-19 Serosurveillance Network collection sites and reference laboratories by jurisdiction. ACT, Australian Capital Territory; ICPMR, Institute of Clinical Pathology and Medical Research; NSW, New South Wales; SA, South Australia; VIDRL, Victorian Infectious Diseases Reference Laboratory.
Specimen Selection
Specimens were selected from 3 populations for this study: (1) general pathology - outpatients (all ages) who presented for a diagnostic blood test at participating public or private pathology services; (2) antenatal screening - pregnant women (20–39 years) who provided blood for antenatal screening at participating public or private pathology services; and (3) blood donors - Lifeblood donors (20–69 years) who provided blood at any Lifeblood donor center nationwide.
Deidentified residual blood specimens (serum, heparinized plasma, or EDTA plasma) were collected from the 3 populations. Eligible specimens were selected randomly or sequentially, depending on feasibility at each site (Table 1). Selection occurred upon receipt or before routine disposal until target numbers were achieved. Data were collected for each specimen on age, sex, and postcode, and, where permitted, initials and date of birth.
National Serosurvey Collection Populations and Specimen Eligibility Criteria
| Collection Population | Eligible Age Range | Inclusion Criteria | Exclusion Criteria |
|---|---|---|---|
| General pathology | All ages | Specimens collected for routine pathology testing at public and private laboratories (including hospital outpatient and emergency departments) | Specimens from hospital inpatients and specimens submitted for a SARS-CoV-2 antibody diagnostic test |
| Antenatal screening | 20–39 years | Specimens submitted for antenatal testing from pregnant females regardless of stage of pregnancy | Nil |
| Blood donors | 20–69 years | Specimens from blood donors | Specimens from donors with a previous, self-reported COVID-19 infection who enrolled to donate for the first time after recovery from COVID-19 (ie, may have been recruited for convalescent plasma)a |
Abbreviations: COVID-19, coronavirus disease 2019; SARS-CoV-2, severe acute respiratory syndrome coronavirus 2.
Exclusion of these blood-donor specimens only occurred after a positive result on the Wantai SARS-CoV-2 total antibody assay.
Sample Size and Distribution
A minimum sample size of 350 per subgroup (jurisdiction, age group, or sex) was adopted to allow exclusion of seroprevalence above 2.0% at the 95% confidence level in each subgroup, if observed seropositivity was at most 0.6%. To achieve geographic spread, we collected specimens proportional to the distribution of the Australian population in each of the 89 national Statistical Area 4 (SA4) regions [2, 16]. The SA4s were assigned according to the sample’s residential postcode.
Testing
Specimens were tested at a reference laboratory using the Wantai SARS-CoV-2 total antibody enzyme-linked immunosorbent assay ([ELISA] Beijing Wantai Biological Pharmacy Enterprise Co. Ltd., Beijing, China). An in-house validation found that the test sensitivity was 95.1% (95% confidence interval [CI], 88.9–98.4) among individuals with a positive SARS-CoV-2 NAT at least 14 days postillness onset (range, 14–130 days). Specificity among prepandemic blood specimens was 99.6% (95% CI, 98.9–99.9) (see Supplementary Material).
Specimens were considered ELISA-positive if they returned a positive (signal to cut-off ratio [S/CO] ≥1.1 on first and repeat Wantai testing) or equivocal result (S/CO = 0.9 to <1.1 on first or repeat testing, or positive with nonpositive result upon repeat). To provide additional information on antibody profiles, ELISA-positive specimens were tested quantitatively for neutralizing antibody using a microneutralization assay ([MN] ICPMR, Westmead, New South Wales, Australia) [17]. The MN titers of 10 or more were considered positive.
Analysis
The timing of specimen collection was compared graphically to COVID-19 case notifications reported by a national public data-aggregation website [8]. Sex, age group, and geographic distribution was compared with the following reference populations: (1) - general pathology – Australian-estimated residential population, March 2020 [2]; (2) antenatal screening - the estimated population of women, 20–39 years, undergoing antenatal care (based on births by mother’s age in 2019 [18]); and (3) blood donors - Lifeblood donors, 20–69 years, in 2019 (supplied by Lifeblood). Crude ELISA positivity and the distribution of S/CO values were summarized for each population.
Using ELISA results, we estimated the seroprevalence in each demographic subgroup using Bayesian methods to adjust for test sensitivity and specificity, incorporating the statistical uncertainty in these estimated values (see Supplementary Material). We summarized seroprevalence estimates using the median (point estimate) and 95% credible interval (CrI) of the corresponding posterior probability distribution.
Our primary analysis specified a “noninformative” prior distribution for seroprevalence that assumed uniform probability density between a predetermined lower bound and 100% for each demographic subgroup within each collection population. A sensitivity analysis was conducted using an alternative prior distribution that assigned a higher probability to low seroprevalence values, a beta distribution with parameters 0.2 and 10 (prior median prevalence ~1%). A separate analysis was also undertaken using the noninformative prior distribution, with equivocal ELISA results classified as negative.
Lower bounds for the prior distribution were calculated separately for demographic subgroups in each collection population, based on the cumulative number of nationally notified COVID-19 cases [19] reported at 14 days before the median specimen collection date, as a proportion of the corresponding estimated resident population [2].
The cumulative number of infections in the population during the first wave was estimated by multiplying the general pathology seroprevalence estimate by the Australian population [2]. The general pathology estimate was used because it encompasses all ages [20]. The infection-to-case-ratio was estimated using total estimated infections compared with the cumulative number of notified COVID-19 cases [19] reported at 14 days before the median serosurvey specimen collection date.
Ethics Approval
Ethics approvals were granted by the Sydney Children’s Hospital Network Human Research Ethics Committee ([SCHN HREC] HREC/17/SCHN/245); Lifeblood Ethics Committee (2020#07); University of Tasmania Health and Medical HREC (21875); Australian Capital Territory Health HREC (2020.LRE.00099); the Northern Territory Department of Health and Menzies School of Health Research HREC (2020-3768); and the Western Australian Department of Health HREC (RGS0000003804).
Patient Consent Statement
Because specimens were residual and deidentified, a waiver of consent was granted by all approving HRECs.
RESULTS
Sample Details
From June 19 to August 6, 2020, 11 317 eligible specimens were collected, comprising 5132 general pathology, 2972 antenatal screening, and 3213 blood donor specimens (Table 2). Sample size targets for each population were exceeded overall and by age group and sex, and at least 90% of targets were reached in all 8 jurisdictions, except for the antenatal screening collection in the 3 smallest jurisdictions: the Australian Capital Territory, Northern Territory, and Tasmania.
Target Sample Size and Distribution of Demographic Characteristics in Each Collection and Their Australian Reference Populations
| General Pathology Sample | 2020 Australian Population | Antenatal Screening Sample | Antenatal Population | Blood Donor Sample | Blood Donor Population | |||||||||||
|---|---|---|---|---|---|---|---|---|---|---|---|---|---|---|---|---|
| Demographic Group | Target (n) | Collected (n) | Distribution of Collection (%) | Reference Population (n) | Reference Population (%) | Target (n) | Collected (n) | Distribution of Collection (%) | Reference Population (n) | Reference Population (%) | Target (n) | Collected (n) | Distribution of Collection (%) | Reference Population (n) | Reference Population (%) | |
| Age group | 0 to <5 | 399 | 424 | 8.3 | 1 562 936 | 6.1 | ||||||||||
| (years) | 5 to <10 | 401 | 423 | 8.2 | 1 629 015 | 6.3 | ||||||||||
| 10 to <20 | 477 | 584 | 11.4 | 3 089 130 | 12.0 | |||||||||||
| 20 to <30 | 514 | 598 | 11.7 | 3 643 811 | 14.2 | 1395 | 1434 | 48.3 | 113 507 | 39.7 | 628 | 643 | 20.0 | 118 208 | 26.2 | |
| 30 to <40 | 518 | 609 | 11.9 | 3 747 564 | 14.6 | 1405 | 1538 | 51.7 | 172 304 | 60.3 | 632 | 658 | 20.5 | 105 927 | 23.4 | |
| 40 to <50 | 492 | 571 | 11.1 | 3 295 654 | 12.8 | 619 | 643 | 20.0 | 86 729 | 19.2 | ||||||
| 50 to <60 | 482 | 552 | 10.8 | 3 112 102 | 12.1 | 614 | 639 | 19.9 | 81 013 | 17.9 | ||||||
| 60 to <70 | 451 | 526 | 10.2 | 2 674 295 | 10.4 | 622 | 630 | 19.6 | 59 861 | 13.3 | ||||||
| 70 to <80 | 399 | 467 | 9.1 | 1 856 527 | 7.2 | |||||||||||
| 80+ | 355 | 378 | 7.4 | 1 046 715 | 4.1 | |||||||||||
| Sex | Female | 2244 | 2787 | 54.3 | 12 938 247 | 50.4 | 2800 | 2972 | 100.0 | 285 811 | 100.0 | 1558 | 1576 | 49.1 | 229 386 | 50.8 |
| Male | 2244 | 2345 | 45.7 | 12 719 502 | 49.6 | 1558 | 1637 | 50.9 | 222 352 | 49.2 | ||||||
| Jurisdiction | ACT | 350 | 439 | 8.6 | 429 941 | 1.7 | 350 | 311 | 10.5 | 5 187 | 1.8 | 350 | 351 | 10.9 | 14 295 | 3.2 |
| NSW | 1121 | 1285 | 25.0 | 8 160 113 | 31.8 | 350 | 732 | 24.6 | 92 235 | 32.3 | 557 | 581 | 18.1 | 131 055 | 29.0 | |
| NT | 350 | 319 | 6.2 | 245 522 | 1.0 | 350 | 134 | 4.5 | 3309 | 1.2 | 350 | 368 | 11.5 | 2982 | 0.7 | |
| QLD | 702 | 871 | 17.0 | 5 161 409 | 20.1 | 350 | 397 | 13.4 | 57 498 | 20.1 | 350 | 386 | 12.0 | 88 704 | 19.6 | |
| SA | 350 | 354 | 6.9 | 1 768 045 | 6.9 | 350 | 352 | 11.8 | 18 299 | 6.4 | 350 | 343 | 10.7 | 35 940 | 8.0 | |
| TAS | 350 | 426 | 8.3 | 539 732 | 2.1 | 350 | 287 | 9.7 | 5367 | 1.9 | 350 | 334 | 10.4 | 14 761 | 3.3 | |
| VIC | 905 | 1070 | 20.8 | 6 690 180 | 26.1 | 350 | 389 | 13.1 | 72 454 | 25.4 | 459 | 503 | 15.7 | 123 147 | 27.3 | |
| WA | 360 | 368 | 7.2 | 2 658 135 | 10.4 | 350 | 370 | 12.4 | 31 439 | 11.0 | 350 | 347 | 10.8 | 40 854 | 9.0 | |
| Total | 4488 | 5132 | 100.0 | 25 653 077 | 100.0 | 2800 | 2972 | 100.0 | 285 788 | 100.0 | 3116 | 3213 | 100.0 | 451 738 | 100.0 | |
Abbreviations: ACT, Australian Capital Territory; NSW, New South Wales; NT, Northern Territory; SARS-CoV-2, severe acute respiratory syndrome coronavirus 2; QLD, Queensland; SA, South Australia; TAS, Tasmania; VIC, Victoria; WA, Western Australia.
The distribution of age, sex, and jurisdiction among specimens broadly mirrored that of the corresponding reference populations (Table 2), except that our sample overrepresented smaller jurisdictions and was more equally distributed across jurisdictions and age groups, to achieve minimum sample sizes by subgroup.
The overall median specimen collection date was July 2 (interquartile range [IQR] June 29–July 9), approximately 9 weeks after the approximate end of the first epidemic wave, and 15 weeks after its peak (Figure 2). Median collection dates for each population were within 1 week of each other: general pathology June 30, IQR June 25–July 6; antenatal screening July 3, IQR June 30–July 16; blood donors July 5, IQR July 2–July 8.
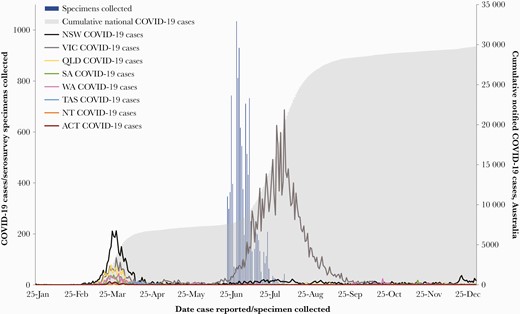
Australian coronavirus disease 2019 (COVID-19) cases and serosurvey specimens by date of report and jurisdiction or specimen collection, January 25 to December 31, 2020. ACT, Australian Capital Territory; NSW, New South Wales; NT, Northern Territory; QLD, Queensland; SA, South Australia; TAS, Tasmania; VIC, Victoria; WA, Western Australia.
Antibody Testing Outcomes
The Wantai total SARS-CoV-2-antibody ELISA detected 71 positive specimens (29 general pathology, 15 antenatal screening, and 27 blood donor specimens) (Table 3). These were recorded in all jurisdictions and across multiple Australian SA4s without apparent clustering of infections (data not shown).
Number and Proportion of Seropositive Specimens on the Wantai Total SARS-CoV-2 Antibody Assay by Collection, Age Group, Sex, and Jurisdiction
| General Pathology | Antenatal Screening | Blood Donors | ||||||||
|---|---|---|---|---|---|---|---|---|---|---|
| Demographic Group | Specimens Tested | Specimens Positive | Specimens Tested | Specimens Positive | Specimens Tested | Specimens Positive | ||||
| (n) | (n) | (%) | (n) | (n) | (%) | (n) | (n) | (%) | ||
| Age group | 0 to <5 | 424 | 2 | 0.5 | ||||||
| (years) | 5 to <10 | 423 | 2 | 0.5 | ||||||
| 10 to <20 | 584 | 4 | 0.7 | |||||||
| 20 to <30 | 598 | 4 | 0.7 | 1434 | 5 | 0.3 | 643 | 5 | 0.8 | |
| 30 to <40 | 609 | 3 | 0.5 | 1538 | 10 | 0.7 | 658 | 4 | 0.6 | |
| 40 to <50 | 571 | 3 | 0.5 | 643 | 7 | 1.1 | ||||
| 50 to <60 | 552 | 4 | 0.7 | 639 | 6 | 0.9 | ||||
| 60 to <70 | 526 | 1 | 0.2 | 630 | 5 | 0.8 | ||||
| 70 to <80 | 467 | 4 | 0.9 | |||||||
| 80+ | 378 | 2 | 0.5 | |||||||
| Sex | Female | 2787 | 15 | 0.5 | 2972 | 15 | 0.5 | 1576 | 15 | 1.0 |
| Male | 2345 | 14 | 0.6 | 1637 | 12 | 0.7 | ||||
| Jurisdiction | Australia | 5132 | 29 | 0.6 | 2972 | 15 | 0.5 | 3213 | 27 | 0.8 |
| ACT | 439 | 1 | 0.2 | 311 | 1 | 0.3 | 351 | 4 | 1.1 | |
| NSW | 1285 | 9 | 0.7 | 732 | 8 | 1.1 | 581 | 6 | 1.0 | |
| NT | 319 | 5 | 1.6 | 134 | 1 | 0.7 | 368 | 2 | 0.5 | |
| QLD | 871 | 3 | 0.3 | 397 | 2 | 0.5 | 386 | 4 | 1.0 | |
| SA | 354 | 1 | 0.3 | 352 | 0 | 0.0 | 343 | 0 | 0.0 | |
| TAS | 426 | 2 | 0.5 | 287 | 1 | 0.3 | 334 | 3 | 0.9 | |
| VIC | 1070 | 5 | 0.5 | 389 | 2 | 0.5 | 503 | 3 | 0.6 | |
| WA | 368 | 3 | 0.8 | 370 | 0 | 0.0 | 347 | 5 | 1.4 | |
| Total | 5132 | 29 | 0.6 | 2972 | 15 | 0.5 | 3213 | 27 | 0.8 | |
Abbreviations: ACT, Australian Capital Territory; NSW, New South Wales; NT, Northern Territory; QLD, Queensland; SA, South Australia; SARS-CoV-2, severe acute respiratory syndrome coronavirus 2; TAS, Tasmania; VIC, Victoria; WA, Western Australia.
The median S/CO among ELISA positives was 2.1 (range, 0.9–21.1; IQR, 1.4–5.3). Blood donors had a broader distribution of S/CO values than other populations (median S/CO in general pathology 1.8, IQR 1.2–3.3; antenatal screening 2.3, IQR 1.3–6.4; blood donors 3.2, IQR = 1.5–15.7). Of the 71 ELISA positives, 13 had S/CO readings in the equivocal range, most frequently in the general pathology population (8 of 29 positives), followed by blood donors (3 of 27) and antenatal screening (2 of 15). No ELISA-positive specimens had quantifiable neutralizing antibodies.
Seroprevalence Estimates
After adjustment, primary estimates of SARS-CoV-2-specific antibody prevalence for the general pathology, antenatal screening, and blood donor populations were as follows: 0.25% (95% CrI, 0.03–0.54), 0.23% (95% CrI, 0.04–0.54), and 0.47% (95% CrI, 0.04–0.89), respectively. There were no statistically discernible differences in seroprevalence estimates between age groups, sex, or jurisdiction (Figure 3). In sensitivity analysis using the alternative prior distribution, seroprevalence estimates were expectedly lower at 0.15% (95% CrI, 0.03–0.45), 0.14% (95% CrI, 0.04–0.44), and 0.31% (95% CrI, 0.04–0.78), respectively. When equivocal ELISA results were classified as negative seroprevalence estimates were 0.17% (95% CrI, 0.03–0.39), 0.20% (95% CrI, 0.04–0.47), and 0.39% (95% CrI, 0.04–0.79), respectively.
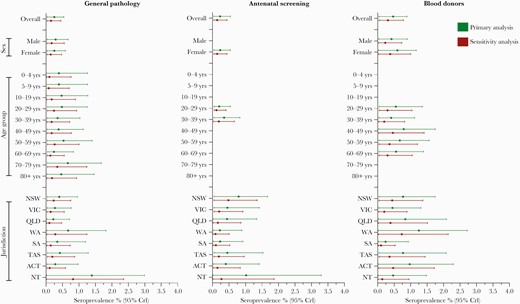
Estimated seroprevalence and 95% credible intervals by jurisdiction, age group, sex, and collection for Bayesian primary and sensitivity analyses. ACT, Australian Capital Territory; CrI, credible interval; NSW, New South Wales; NT, Northern Territory; QLD, Queensland; SA, South Australia; TAS, Tasmania; VIC, Victoria; WA, Western Australia.
Cumulative Severe Acute Respiratory Syndrome Coronavirus 2 Infections
As of June 16, 2020, there were 7636 nationally notified COVID-19 cases [19]. Based on the seroprevalence estimate of 0.25% in the general pathology population, cumulative SARS-CoV-2 infections nationally were estimated to be approximately 64 100 (95% CrI, 7700–138 500). The corresponding estimated infection-to-case-ratio was 8 (CrI, 1–18). Based on the lower seroprevalence estimate from the sensitivity analysis in the general pathology population of 0.15%, cumulative SARS-CoV-2 infections were estimated to be 38 500 (CrI, 7700–115 400), indicating an infection-to-case-ratio of 5 (CrI, 1–15).
DISCUSSION
We performed Australia’s largest national SARS-CoV-2 serosurvey to measure the spread of COVID-19 infection after the first epidemic wave in March–April 2020. As part of this, we generated important baseline seroprevalence data before the rollout of COVID-19 vaccinations in Australia. We showed that seroprevalence was very low (<0.5%), with no discernible differences between age groups, sexes, or jurisdictions. Furthermore, the 3 populations surveyed provided very similar results, increasing confidence in the generalizability of the findings to the broader community. Our findings suggest that routine surveillance may have missed approximately 7 infections for every notified case, with a credible range of no missed infections to 17 missed infections per case. Even at the upper limit of the credible intervals, the very low seroprevalence confirms that community transmission in Australia during the first wave was limited, despite being dispersed across all 8 jurisdictions. This demonstrates the success of the control measures implemented in March 2020, including the strict public health restrictions in place nationally until mid-May 2020 [6]. It also shows that the vast majority of the Australian population has no infection-derived protection against SARS-CoV-2, emphasizing the crucial role of vaccination in increasing immunity.
Severe acute respiratory syndrome coronavirus 2 seroprevalence and vaccination coverage elsewhere in the world highlights Australia’s comparative lack of protection against COVID-19. High SARS-CoV-2 seroprevalence has been observed internationally; many estimates in the general population to mid-2021 have been over 20% and as high as 73% [21]. As of July 2021, approximately 14% of people globally are fully vaccinated, and several countries have reached over 60% vaccination coverage [22]. By comparison at the same time point, only 13% of the Australian population have been fully vaccinated, and our study demonstrates that Australia has had extremely limited acquisition of any potential “natural” protection [22]. With the exception of the second epidemic in the state of Victoria and the current outbreak in Sydney, COVID-19 has been successfully suppressed nationally since the first wave and after collection of our sample [3]. As such, even as of July 2021, it is likely that seroprevalence estimates obtained in this study approximate seroprevalence for the majority of Australian jurisdictions before the commencement of COVID-19 vaccinations in February 2021. Our results make clear Australia’s high susceptibility to further waves of infection and near-complete reliance on a successful, widespread vaccination program to forge a path out of the COVID-19 pandemic.
Of note, no neutralizing antibodies were detected among our ELISA-positive specimens. Evidence suggests that neutralizing antibodies can wane over time [23], with more rapid decline in those with mild or asymptomatic infections [24, 25]. In addition, some SARS-CoV-2 infections do not result in any detectable neutralizing antibodies [24]. Given that false positivity is already accounted for in our analysis, waning is the most likely explanation for the lack of detectable neutralizing antibody in our sample. Although the correlates and duration of protection after SARS-CoV-2 infection remain unknown, substantial waning of neutralizing antibody may have important implications for any infection-derived immunity in the Australian population.
Population-based SARS-CoV-2 serosurveys have consistently shown that COVID-19 case numbers underrepresent SARS-CoV-2 infections to a degree that is primarily dependent on testing rates [11, 21]. Although infection-to-case ratios should be cautiously interpreted, our estimation of some undetected SARS-CoV-2 transmission during the first wave is consistent with previous Australian serosurveys in more limited geographic settings [20, 26]. Some undetected transmission during this time is plausible, based on initially restricted testing policies [27], the continuation of international travel until mid-March 2020 [7], and the dispersion of community transmission in every jurisdiction [8], allowing for mild disease to spread undetected. However, our serosurvey cannot differentiate between locally versus overseas-acquired infections, and as such it is unlikely to solely represent infections based on local transmission. Until mid-2021, any notable undetected transmission is likely to be isolated to the first wave, given the subsequent introduction of strict public health measures and widespread testing [1, 5, 7, 10].
Although we found no difference in seroprevalence estimates between age groups, it is possible that there was some age-related variation in the levels of undetected SARS-CoV-2 infection during the first wave. The rate of notified COVID-19 cases in those <18 years was approximately 10 times lower than in the adult population in early 2020 [6]. By contrast, seroprevalence estimates in those <20 years overlapped substantially with estimates in adult age groups (noting wide credible intervals and challenges in making comparisons in low prevalence settings). Children and adolescents have been shown to have higher rates of asymptomatic and mild infection than adults [28], which may contribute to a difference in detection of infections. Although patterns vary internationally [29], serosurveys in the United Kingdom [30] and China [31] have also demonstrated similar infection rates in children and adults despite lower rates of notified disease in younger groups.
Internationally, a wide variety of sampling methodologies have been used to conduct population SARS-CoV-2 serosurveys [11, 21]. Although probability sampling of the general population would be ideal to estimate seroprevalence [32], it is often not feasible and can introduce its own biases [33]. For this survey, collecting residual specimens was practical in the context of minimizing unnecessary close contact during the pandemic and facilitating rapid sampling at a significant time-point without lengthy consent-based procedures. To our knowledge, no national-level SARS-CoV-2 serosurveys have used more than 2 different residual specimen sources, and the vast majority use 1 [21]. Although residual specimens can only be representative of their source population, sampling 3 populations increased confidence in the plausible range of seroprevalence in the broader Australian community. The 3 populations have complementary characteristics. Blood donors are a “healthy”, well defined population frequently used in serosurveys [21], but they are limited to adults and may underrepresent sociodemographic groups, particularly those from culturally and linguistically diverse populations [34]. The general pathology population includes the full age spectrum, but it likely overrepresents those with high health system contact (eg, for chronic conditions), whose testing patterns may have changed during the pandemic. The antenatal screening population is limited in age range and sex, but it is likely to include broader sociodemographic groups [35] and be more stable despite the pandemic [36]. Taken together, these populations provide a convenient and complementary cross section of the Australian community.
Published SARS-CoV-2 serosurveys have also used a variety of SARS-CoV-2 serological assays, with a diversity of performance characteristics [11]. Detecting SARS-CoV-2-specific antibody is dependent on the time since infection, disease severity, and the type and antigenic targets of the test used [17, 23, 25, 37, 38]. We chose to use the Wantai total antibody assay, recommended by the World Health Organization for population serosurveys, because it could be reliably run by all participating reference laboratories and it performed well in the literature as well as in local validation, with both high sensitivity and specificity compared with other commercially available assays [15, 39, 40]. A high specificity test is especially important in a low prevalence setting, as even with a specificity of 99.6%, we would expect approximately 45 of our 71 ELISA-positive specimens to be false positives.
A key contribution of this study was the establishment of a national network to enable further serosurveys for SARS-CoV-2 and potentially other communicable diseases. The network provides (1) a range of geographically diverse collection sites across the 3 populations, (2) strong links to jurisdictional health departments, and (3) laboratory expertise to guide testing algorithms. Serosurveys using networks such as ours provide a practical option to monitor evolving SARS-CoV-2 epidemiology, including vaccine impacts. The network also provides a potential mechanism to characterize the epidemiology and spread of future novel pathogens.
Our study has several limitations. Low seropositivity meant wide credible intervals and prevented population-weighted adjustments in analysis. The noninformative prior distribution was used to estimate seroprevalence in the primary analysis. While this is an objective and commonly preferred method, it’s a conservative approach that may inflate infection estimates and related ratios. Further limitations exist related to our sampled populations. Truly random samples within these populations were not possible. Specimens were selected at random or sequentially depending on feasibility at each collection site, which may have introduced different selection biases. In South Australia, antenatal screening specimens were only available from women undergoing nuchal translucency testing (which incurs a cost to patients, while other antenatal screening is publicly funded) and may therefore represent a higher socioeconomic status group, at lower risk of COVID-19, than in other jurisdictions. However, the impact of this potential bias on the overall seroprevalence estimate among antenatal women was likely minimal, given that the group contributed to only 12% of the total sample. Finally, epidemiological investigation based on detecting COVID-19 antibodies alone may not capture individuals with recent infections who did not have time to mount detectable antibody responses. The impact of this on our estimates is likely to be negligible because specimen collection occurred during a time of very low COVID-19 activity. Only 1738 cases were notified during the study period, for all jurisdictions excluding Victoria. There was some overlap with our collection and the beginning of the Victorian second wave. This would have captured some recent infections resulting in an overestimate of seroprevalence for Victoria. However, we did not observe any discernible differences in estimates by jurisdiction, and it is likely that there was limited time for antibody development among those exposed at the time [14].
CONCLUSIONS
Our study provides evidence to further characterize the early and most geographically dispersed phase of the COVID-19 pandemic in Australia beyond findings obtained from case notifications alone. That there was some undetected virus transmission during Australia’s first, and so far only, national COVID-19 wave is relatively unsurprising, but it reinforces the need to maintain strict control measures while a suppression strategy is being pursued. More importantly, even at the upper estimate of prevalence, Australia’s SARS-CoV-2 antibody seroprevalence at mid-2020 was extremely low, highlighting the urgency of an effective vaccination program to increase protection from future outbreaks and severe outcomes.
Supplementary Data
Supplementary materials are available at Open Forum Infectious Diseases online. Consisting of data provided by the authors to benefit the reader, the posted materials are not copyedited and are the sole responsibility of the authors, so questions or comments should be addressed to the corresponding author.
Acknowledgments
We thank the laboratory staff who collected and tested specimens including the following: Thomas Holgate, Rianne Brizuela, Daniel Sijmons, Alma Redzic, and Mike Catton (Victorian Infectious Diseases Reference Laboratory [VIDRL]); Katherine Tudo, Melissa Lograsso, and Darren Croese (New South Wales [NSW] Health Pathology-Institute for Clinical Pathology and Medical Research [ICPMR]); Justin Morgan and Avram Levy (PathWest); Patrick Harris and Anna Zournazi (Pathology Queensland [QLD]); Craig Riddle and Stuart McKessar (South Australia [SA] Pathology); Chong-Wei Ong, Candice Li, and Cara Huang (Australian Capital Territory [ACT] Pathology); Kartik Naidu and Juliette Holland (Laverty Pathology); Andrew Cullen, Ian Chambers, Daniel Clifford, and Karen Wagner (Douglass Hanly Moir Pathology); Philip Britton and Rebecca Burrell (The Children’s Hospital at Westmead); Lawrie Bott, Ranjeni Rajah, Andrew Bowen, and Jonathon Pankhurst (Southern IML Pathology); Jenny Robson and Heath Glover (Sullivan Nicolaides Pathology); Renu Vohra (QML Pathology); Matt Tallack and James Knox (Dorevitch Pathology); Marcel Leroi, Linh Ngo, Kim Lam, and Josh Gilmore (Austin Health); Tony Korman, Megan Wieringa, and Brooke Winterton (Monash Health); Andrew Daley, Anna-Maria Costa, Karin Rautenbacher, and Steph Atchison (Royal Children’s and Women’s Hospitals Melbourne); Duncan Mclellan and Adam Herbert (Western Diagnostic Pathology); Kevin Freeman and Robert Baird (Royal Darwin Hospital); Louise Cooley and Belinda McEwan (Tasmania Health Service—Royal Hobart Hospital); Pankaja Kalukottege and Sarah Foster (Tasmania Health Service—Launceston General Hospital); and Alistair McGregor and Sandy Burton (Diagnostic Services Pty Ltd). We thank jurisdictional representatives for their advice and input including: Tambri Housen and Tim Sloan-Gardner (Australian Capital Territory Health); Roy Byun (New South Wales Ministry of Health); Peter Markey (Northern Territory Department of Health); Stephen Lambert (Queensland Health); Caroline Miller (South Australia Health/South Australian Health and Medical Research Institute); Catherine Streeton and Janet Strachan (Victorian Department of Health and Human Services); and Paul Effler (Western Australia Health). In addition, we appreciate the contributions of advisory collaborators and other contributors including James McCaw and Jodie McVernon (The Peter Doherty Institute); David Anderson and Mark Stoove (The Burnet Institute); Joseph Doyle (Alfred Health); Kim Mulholland (Murdoch Children’s Research Institute); and Elizabeth Knight (Australian Red Cross Lifeblood). We are grateful for data from the National Notifiable Diseases Surveillance System, which were provided by the Office of Health Protection, Australian Government Department of Health, on behalf of the Communicable Diseases Network Australia.
Disclaimer. The views expressed in this article do not necessarily reflect the views of these organizations.
Financial support. This study was funded by Australian Government Department of Health (HEALTH/20-21/E20-156381; Snow Medical Foundation (CT28701/G207593); and the Australian Partnership for Preparedness Research on Infectious Disease Emergencies Centre for Research Excellence (APPRISE CRE, APP1116530). Australian governments fund Australian Red Cross Lifeblood for the provision of blood, blood products, and services to the Australian community.
Potential conflicts of interest. All authors: No reported conflicts of interest. All authors have submitted the ICMJE Form for Disclosure of Potential Conflicts of Interest.
Presented in part: APPRISE CRE COVID-19 Research Meeting, November, 2020, via zoom; Snow Medical Foundation Research Update Meeting, November 2020, Sydney, New South Wales, Australia; Public Health Association of Australia’s Australasian COVID-19 Virtual Conference, December, 2020, via zoom; Children’s Hospital at Westmead Grand Rounds, May 2021, Sydney, New South Wales, Australia.
References
Author notes
J. M. K. and K. M. are joint senior authors.


Comments