


Abstract
Brine-induced microtexture formation in upper amphibolite to granulite facies lower crust is investigated using a garnet–hornblende (Grt-Hbl) selvage developed along a planar crack discordantly cutting the gneissic structure of an orthopyroxene-bearing gneiss (central Sør Rondane Mountains, East Antarctica). The Cl contents of hornblende and biotite, K contents of hornblende and the thickness of relatively Na-rich rims of plagioclase decrease with distance from the center of the Grt–Hbl selvage (inferred position of the crack). Biotite and hornblende arrangement defining the gneissic structure can be traced into the selvage, suggesting that the wall-rock was overprinted by the selvage formation. Addition and loss of elements to the wall-rock was examined using Zr as an immobile element. Trace elements that tend to be mobile in brines rather than in melts are added to the wall-rock, indicating that the Grt–Hbl selvage was formed by the advection of NaCl–KCl brine into a thin crack. Plagioclase in the wall-rock shows a discontinuous drop of anorthite content at the rim, indicating that coupled dissolution–reprecipitation took place and the grain boundaries were once wet. Trace element concentrations in the wall-rock minerals decrease with distance from the crack, and, in most cases show exponentially decreasing/increasing profiles depending on the elements. These profiles are best modelled by a diffusion equation, suggesting that the wet grain–boundary diffusion in the wall-rock minerals controlled the observed mass transfer and resulted in dissolution–reprecipitation of mineral rims.
INTRODUCTION
Fluid phases are responsible for mass and heat transfer, deformation of rocks, and the changing of melting temperatures (e.g. Helgeson, 1964; Sibson, 1994; Johannes & Holtz, 1996; Ague, 2003; Thompson, 2010). Fluid advection forms veins and altered zones in wide pressure–temperature (P–T) ranges, for example, from ore deposits at shallow depths and to eclogite-facies rocks (e.g. Austrheim, 1987; Gieré, 1993; Hermann et al., 2006; Scambelluri et al., 2010; Ague, 2011). In the case of the lower crust where high-T metamorphic rocks dominate, whether it is dry or not, the role of fluid phases in metamorphism has been a matter of debate (e.g. Thompson, 1983; Connolly & Thompson, 1989; Yardley & Valley, 1997). Low-H2O activity fluids are thought to be present during granulite-facies metamorphism (e.g. Touret, 1981; Newton et al., 1998; Touret & Huizenga, 2011). In addition to CO2-rich fluids that have long been considered to dominate in the granulite-facies lower crust, the importance of brines is increasingly recognized recently (e.g. Touret & Huizenga, 2011; Higashino et al., 2013,, 2015). Experiments and observations on natural examples revealed that NaCl- and CaCl2-bearing brines can coexist with CO2-rich fluids at granulite-facies P–T conditions (Shmulovich & Graham, 2004). Different from CO2-rich fluids, brines are able to dissolve various major and accessory minerals at mid- to lower-crustal P–T conditions (e.g. Ayers & Watson, 1991; Newton et al., 1998; Shmulovich & Graham, 2004; Newton & Manning, 2010; Tropper et al., 2011). Where the two immiscible fluid phases coexist in a porous medium, it is the more abundant one which can move, because the less abundant one will be present as droplets that are not interconnected. When brine forms an interconnected film, it is likely to move more readily than a non-polar fluid such as CO2-rich fluid, because brine has a lower wetting angle and lower viscosity than CO2-rich fluids (e.g. Watson & Brenan, 1987; Holness, 1997). While large-scale fluid pathways are reported in the case of low-salinity fluids using textural and stable isotope evidence (e.g. Bebout & Barton, 1993), brine mobility in natural samples is inferred to be on a micrometer to meter scale (e.g. Philippot & Selverstone, 1991; Kullerud, 1995). Passages and residence time of brines in lower crustal rocks are, therefore, not well understood. Furthermore, the complexity of the origin of brines hinders systematic understanding of their behavior in the lower crust. Brines could be formed from Cl-rich protoliths, from secondary reactions between entrapped fluids and sink minerals for Cl, from evolution of magmatic fluids, and from retrograde hydration reactions of Cl-bearing fluid that result in enrichment of Cl in the remaining fluid (e.g. Markl & Bucher, 1998; Van den Kerkhof et al., 2004; Heinrich, 2005; Touret & Huizenga, 2011; Yardley & Bodnar, 2014).
To understand the complexity of the behavior of brines in the lower crust, observation of natural samples becomes apparently important. Evidence for the former presence of brines can be preserved as fluid inclusions. Halite and salt inclusions are suggested as evidence of brines near the halite-saturated composition (e.g. Van Reenen & Hollister, 1988; Markl & Bucher, 1998). However, despite the great potential of brines to influence metamorphic processes, brine inclusions are not always preserved, especially in deformed rocks. High-grade metamorphic rocks are commonly subjected to strong ductile deformation, net-transfer reactions, recrystallization and diffusion, making the preservation of fluid inclusions less likely (e.g. Thompson & Connolly, 1992; Touret & Huizenga, 2011; Yoshida et al., 2015). Textural indicators have been used as a sign of the former presence of brines. One example is K-feldspar veins along grain boundaries of plagioclase and quartz in high-grade metamorphic terranes (e.g. Griffin, 1969; Todd & Evans, 1994; Harlov et al., 1998). The K-feldspar veins are considered to have resulted from the exchange of alkali elements between plagioclase and a migrating alkali-rich fluid (Griffin, 1969; Todd & Evans, 1994). Another example is the less intense cathodoluminescence of quartz overgrowths on detrital cores observed in sandstones (Demars et al., 1996). Combining the information obtained from fluid inclusions, the quartz rim was interpreted to have precipitated from brine derived from evaporites. In addition to the microtextural indicators, since hydrous minerals could change their compositions reflecting fluid compositions that are in equilibrium with the minerals (e.g. Sisson, 1987; Boudreau & McCallum, 1989), the chemistry of hydrous minerals, such as the high Cl content of biotite, hornblende, apatite and scapolite, have been considered as indicators of brines (e.g. Zhu & Sverjensky, 1991; Markl et al., 1998; Satish-Kumar et al., 2006). Such chemical indicators can be preserved better than fluid inclusions or microtextures in deformed, lower crustal rocks, especially if they are protected from deformation and later chemical modification in appropriate host minerals as inclusions. This is particularly important in recognizing the presence of brines in the early stages of metamorphism (e.g. Kawakami et al., 2016,, 2017). It should be noted, however, that Cl concentrations in hydrous minerals cannot be directly correlated with salinity, and are considered to reflect the fHCl/fH2O of coexisting fluids (e.g. Munoz, 1992).
In this study, we present a microtextural and chemical dataset from an ∼10 mm-thick Grt–Hbl selvage and its surroundings, which developed along a planar crack discordantly cutting the gneissic structure of the host orthopyroxene-bearing mafic gneiss. Based on the addition and loss of elements that are compatible in brines observed in the wall-rock, this crack is shown to have been a passage for brine under upper-amphibolite- to granulite-facies conditions. Also discussed are elementary processes to form microtextures and chemical zoning in the wall-rock by wet grain–boundary diffusion due to the brine. The terms ‘Cl-rich hornblende, biotite, and apatite’ represent those compositions containing more than 0·4 wt % Cl. Mineral abbreviations are after Kretz (1983).
GEOLOGICAL SETTING
The Sør Rondane Mountains (SRM; 22º–28ºE, 71.5º–72.5ºS), eastern Dronning Maud Land, East Antarctica, are dominated by granulite-facies metamorphic rocks and granitoids (Shiraishi et al., 1991; Asami et al., 1992). They are thought to be a part of a collision zone between East and West Gondwana during the East African-Antarctic Orogen (Jacobs et al., 2003; Jacobs & Thomas, 2004) and are also interpreted to be in the hanging wall of a mega-nappe complex involving continental collision between northern and southern Gondwana (Grantham et al., 2013) during the Kuunga Orogeny, proposed by Meert (2003). A long duration of magmatism (150 Myr) has been proposed for the collision process in the SRM (e.g. Jacobs et al., 2015; Elburg et al., 2016). The SRM are divided into a NE-terrane and a SW-terrane by a mylonite zone termed the Main Tectonic Boundary (MTB), which dips gently to the N and NE (Osanai et al., 2013), shown as ‘MTB (O)’ in Fig. 1. Based on aeromagnetic data correlated with ground-based magnetic susceptibility measurements, Mieth et al. (2014) proposed a slightly different location for the MTB, shown as ‘MTB (M)’ in Fig. 1. Metamorphic rocks in the NE-terrane record clockwise P–T paths, whereas those in the SW-terrane record anticlockwise P–T paths (Osanai et al., 2013). In the SW-terrane, the peak P–T conditions are estimated at ∼800–900°C and 0·6–0·7 GPa, and the retrograde P–T conditions are 400–600°C and < 0·4 GPa (Adachi et al., 2013a; Baba et al., 2013). Detrital zircons older than 1200 Ma are present in the NE-terrane, whereas they are absent in the SW-terrane (Osanai et al., 2013; Kitano et al., 2016). Recently, an anticlockwise P–T path and detrital zircons younger than 1200 Ma have been reported from Perlebandet, suggesting that it belongs to the SW-terrane and the MTB (M) location is preferred (Kawakami et al., 2017). The amphibolite-facies terrane and the granulite-facies terrane are bounded by the Sør Rondane Suture (SRS) (Fig. 1; Osanai et al., 1992). The nearly vertical Main Shear Zone (MSZ) that trends E–W and traverses the center of the SW-terrane is considered to have formed under an extensional regime at ∼600–560 Ma (Kojima & Shiraishi, 1986; Shiraishi et al., 2008; Toyoshima et al., 2013).
![Simplified geological map of the Sør Rondane Mountains, East Antarctica (after Shiraishi et al., 2008; Ishikawa et al., 2013; Osanai et al., 2013; Toyoshima et al., 2013). The Main Tectonic Boundary [MTB(O)] is after Osanai et al. (2013) and the Main Tectonic Boundary [MTB(M)] is after Mieth et al. (2014). MSZ, Main Share Zone (Kojima & Shiraishi, 1986); SRS, Sør Rondane Suture (Osanai et al., 1992). Note that pelitic and mafic gneisses containing Cl-rich biotite (circles) and/or amphibole (squares) are distributed locally near the large-scale shear zones and major tectonic boundaries (Higashino et al., 2013, 2015; Kawakami et al., 2017). The sample locality for this study is also shown.](https://oup.silverchair-cdn.com/oup/backfile/Content_public/Journal/petrology/60/2/10.1093_petrology_egy116/1/m_egy116f1.jpeg?Expires=1716912499&Signature=jKA2~Z2PycIKvfw51yd2kghrdzg0vXzoNo10lrTbt68YZyf6kHnkgeIz~XTrwIYzDxbsSf8I8WYau990FiKRluBEcGeYrD8kHHRTHt1yABZkF1b1FoBxAgOC5wEx95KwjHPz~SZ8zUx5IPWeK-e6ZNxpl~fvK4nQuqwrb91GuIqa8cZQMBHURAdq-dOOwoXCYWBQpPrHZsI~gg1I8O5sm3ieqmbv3B4fvP7p9WlrY9jSO-BWyD6vWaGiPzYTJqkNNnElhM5lCuYJI~H2U6Ao1uRSnNe5ahnxRdulzpiDkUPk-wA3T6AcH576KIbIdXAFvja2NkDf1bshRvMfayTAcg__&Key-Pair-Id=APKAIE5G5CRDK6RD3PGA)
Simplified geological map of the Sør Rondane Mountains, East Antarctica (after Shiraishi et al., 2008; Ishikawa et al., 2013; Osanai et al., 2013; Toyoshima et al., 2013). The Main Tectonic Boundary [MTB(O)] is after Osanai et al. (2013) and the Main Tectonic Boundary [MTB(M)] is after Mieth et al. (2014). MSZ, Main Share Zone (Kojima & Shiraishi, 1986); SRS, Sør Rondane Suture (Osanai et al., 1992). Note that pelitic and mafic gneisses containing Cl-rich biotite (circles) and/or amphibole (squares) are distributed locally near the large-scale shear zones and major tectonic boundaries (Higashino et al., 2013, 2015; Kawakami et al., 2017). The sample locality for this study is also shown.
The field distribution of Cl-rich minerals and their formation mechanisms have been studied in detail in the SRM (e.g. Higashino et al., 2013,, 2015; Kawakami et al., 2017; Uno et al., 2017). Chlorine-rich biotite, apatite and hornblende have been described in felsic and mafic gneisses along the large-scale shear zones and major tectonic boundaries, which extend over 200 km (Higashino et al., 2013,, 2015). Higashino et al. (2013) concluded that Cl-rich fluid or melt infiltration resulted in the formation of Cl-rich biotite and apatite in pelitic gneiss from Balchenfjella, at near-peak metamorphic conditions of ∼800 ºC and 0.8 GPa (Fig. 1). High halogen contents in hornblende are also reported from the Dufek and Pingvinane grantitoids (Li et al., 2007). So far, cracks and selvages consisting of Cl-rich minerals are widely reported from the SRM, such as northern Brattnipene (this study), Austhamaren (Supplementary Data Electronic Appendix Fig. 1; supplementary data are available for downloading at http://www.petrology.oxfordjournals.org), Mefjell (Mindaleva et al., 2018), and southern Balchenfjella (Uno et al., 2017).
The sample used in this study is taken from northern Brattnipene in the SW-terrane (Fig. 1), where Grt–Bt, Grt–Sil–Bt, Opx–Bt and Hbl–Bt gneisses are exposed (e.g. Shiraishi et al., 1997; Adachi et al., 2013a). The gneissic structure and lithological boundaries strike dominantly E–W and dip moderately to the S and SSW (e.g. Adachi et al., 2013a; Toyoshima et al., 2013). Peak metamorphic conditions are estimated at ∼800 ºC and 0·70–0·85 GPa (Shiraishi & Kojima, 1987; Adachi et al., 2013b), and an anticlockwise P–T path has been proposed (Adachi et al., 2013b).
SAMPLE DESCRIPTION
The sample used in this study is a Grt–Opx–Hbl gneiss discordantly cut by a planar crack along which a Grt- and Hbl-rich selvage of ∼10 mm thickness is developed (sample TK2009121002C; Fig. 2). This sample was collected from Brattnipene during the summer season of the 51st Japan Antarctic Research Expedition (JARE 51, 2009–2010) (Tsuchiya et al., 2012) (Fig. 1). Similar selvages are found at least in a ∼20 m thick layer in the outcrop (Fig. 2a). All selvages are composed of garnet and hornblende. Such selvages cut the gneissic structure randomly in orientation and form a network (Fig. 2b). One of these selvages can be traced for at least ∼2 m and is recognized as a small ductile shear zone accompanied by a small displacement (Fig. 2c, d). The U–Pb ages and REE patterns of zircon have been reported previously from sample TK2009121002C (Higashino et al., 2015).
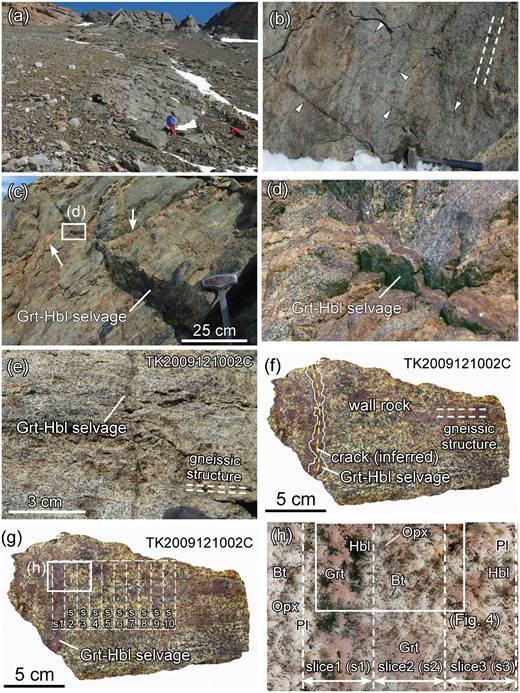
(a) Outcrop of sample TK2009121002 in Brattnipene. (b) Triangles indicate the positions of cracks and Grt–Hbl selvages that discordantly cut the gneissic structure of the outcrop in (a). Along cracks, a garnet–hornblende association is developed (termed a Grt–Hbl selvage in the text), which makes the cracks visible because of their dark colour. The orientation of the cracks is random. Broken lines represent the gneissic structure. A hammer used for scale is ∼ 40 cm long. (c) Field occurrence of the Grt–Opx–Hbl gneiss from the sample locality shown in (a). A Grt–Hbl selvage ∼ 10 mm thick developed along the crack discordantly cuts the gneissic structure. This selvage is developed along a small dextral shear zone, showing that the crack is planar along the shear zone. The selvage can be traced for at least several meters. Two white arrows indicate the same felsic layer with a displacement along the dextral shear zone. (d) Enlargement of the felsic layer indicated by a white box in (c) and the selvage developed along the dextral shear zone. (e) Close-up view of one of the cracks along which the selvage is developed from the same outcrop (sample TK2009121002C) which is the focus of this study. A Grt–Hbl selvage about 10 mm thick discordantly cuts the gneissic structure (broken lines). (f) Slab photograph of sample TK2009121002C. White lines represent the irregular boundary between the Grt–Hbl selvage and the wall-rock. The boundary is recognized as a difference in grain size. Yellow broken line represents the inferred position of the crack. White broken lines represent the gneissic structure. (g) Slab photograph of sample TK2009121002C showing the 10 mm thick slices (s1–s10; indicated by white broken lines) utilized in the bulk-rock analyses by XRF and ICP-MS (Fig. 11; Table 3). (h) Entire thin section photograph of the area shown in (g). The white rectangle represents the area of the X-ray elemental maps shown in Fig. 4. Plane polarized light (PPL).
The Grt–Hbl selvage developed along a crack in sample TK2009121002C consists mainly of coarse-grained garnet (7–10 mm) and hornblende, plagioclase, biotite and quartz, with minor amounts of apatite, zircon, sulfides, ilmenite, hematite and secondary Fe-hydroxides. The wall-rock of this selvage contains orthopyroxene in addition to the minerals in the selvage, whereas quartz is less abundant (Figs 2e–h, 3, 4). The boundary between the Grt–Hbl selvage and the neighboring wall-rock is not straight, but sharp on the outcrop scale (Fig. 2c–f), whereas it is not sharp at a microscopic scale (Figs 2h, 3a, 4a). The gneissic structure of the wall-rock is mainly defined by the arrangement of biotite and hornblende (Fig. 3a–c). Importantly, biotite is continuously included in the garnet and hornblende in the selvage (Fig. 3a), indicating that the wall-rock was overprinted by the selvage formation.
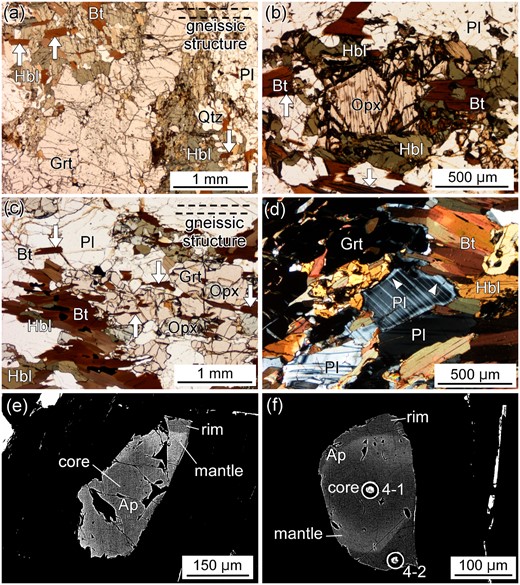
Thin section photographs (a–d) and backscattered electron (BSE) images (e, f) of sample TK2009121002C. (a) The Grt–Hbl selvage composed of garnet and hornblende that are coarser-grained than the wall-rock. The selvage is orthopyroxene-free. White arrows indicate biotite arrangements included in hornblende which preserve the continuous gneissic structure from the wall-rock (broken lines). PPL. (b) Microtexture of an area ∼ 7 mm from the crack. Orthopyroxene is surrounded by intergrowths of hornblende and biotite. White arrows indicate biotite grains defining the gneissic structure. PPL. (c) Microtexture of the wall-rock ∼ 40 mm from the crack. Orthopyroxene is present next to garnet and hornblende. White arrows indicate biotite grains defining the gneissic structure (broken lines). PPL. (d) Microtexture of the wall-rock ∼ 15 mm from the crack. The mantle/rim boundary of plagioclase (white arrows) is clearly recognized under crossed polarized light. (e) BSE image of apatite at ∼ 13 mm from the crack. Dark rim, bright mantle, and dark core are recognized. The mantle/rim boundary is sharp, whereas the core/mantle boundary is gradational. (f) BSE image of apatite at ∼ 5 mm from the crack. Circles represent pits for LA-ICP-MS trace element analyses. Numbers next to the circles represent analysis numbers given in Table 2.
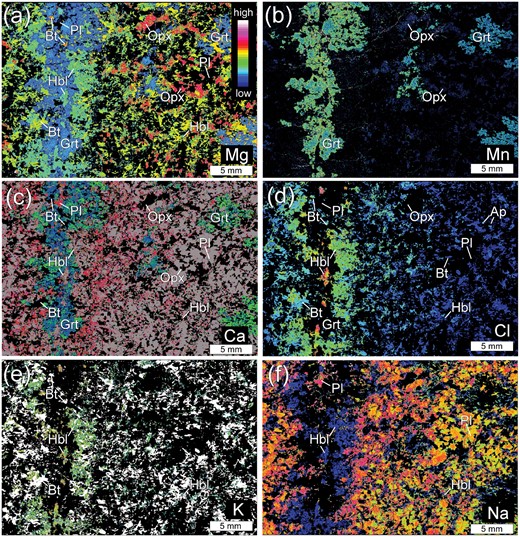
X-ray elemental maps of the white rectangle area in Fig. 2h. (a) X-ray map of Mg shows that the Grt–Hbl selvage is orthopyroxene-free. Shown in red is orthopyroxene, except for several biotite grains in the selvage. Shown in yellow, green and blue are biotite, hornblende and garnet, respectively. (b) X-ray elemental map of Mn. Blue- to green-coloured grains are garnet. Garnet present in and near the selvage has rims which are slightly enriched in Mn. The garnet away from the selvage is unzoned, having similar Mn contents to the garnet cores in the selvage. (c) X-ray elemental map of Ca. The Ca content of plagioclase shows the opposite trend to the Na content. Shown in red to white is plagioclase and blue to green is garnet. (d) X-ray elemental map of Cl. Chlorine contents of hornblende and biotite decrease away from the center of the selvage. (e) X-ray elemental map of K. The K content of hornblende (green to blue) decreases away from the crack. Shown in white is biotite. (f) X-ray map of Na showing the development of Na-richer rims on plagioclase in the wall-rock. The rims of plagioclase tend to become thinner and their modal amount decreases with distance from the crack. Shown in greenish-yellow to pink is plagioclase, and shown in dark blue is hornblende.
ANALYTICAL METHODS
Quantitative analyses and X-ray elemental mapping of minerals were performed using a JEOL JXA-8105 superprobe (EPMA) at Kyoto University. Quantitative analyses, except for apatite, were performed using the conditions of 15 kV acceleration voltage, 10 nA beam current, beam diameter of 3 μm, and counting times for the peak and backgrounds being 30 s and 15 s for Cl, 60 s and 30 s for F, and 10 s and 5 s for other elements, respectively. Analytical conditions for quantitative analysis of apatite followed those recommended by Goldoff et al. (2012). Further conditions for quantitative analyses and X-ray elemental mapping are summarized in Higashino et al. (2015).
Slices of the studied sample (10 mm thick) were prepared parallel to the center of the Grt–Hbl selvage (inferred position of the planar crack) as shown in Figs 2f–h: slice 1 is the selvage (± 5 mm from the inferred position of the planar crack), and slices 2–10 are the wall-rocks of 10 mm thickness, corresponding to distances of 5–15 mm to 85–95 mm, respectively (Fig. 2g;Higashino et al., 2015). Since the boundary between the coarse-grained Grt–Hbl selvage and the neighboring wall-rock is not sharp and straight based on microscopic observation, slice 1 was prepared as a 10 mm-thick plate in which all the coarse-grained garnet and hornblende are included (Fig. 2h). This slice is termed ‘Grt–Hbl selvage’ in the following geochemical analysis.
The rock samples utilized for X-ray fluorescence (XRF) analysis were powdered in a tungsten-carbide mill at Kyoto University. Loss on ignition was determined after heating at 950 ºC for 24 h using an electric furnace. Sample fusion and analysis by XRF was performed at Tohoku University. A 1:2 ratio of powdered rock sample (1·8 g) and anhydrous lithium borate flux (3·6 g) was weighted into a Pt crucible and fused at 1200 ºC to prepare a glass bead. Utilizing these glass beads, bulk-rock major element compositions were determined by XRF analysis using a PANalytical Epsilon 5 spectrometer. The concentrations of bulk-rock rare earth elements (REE) and trace elements were determined using solution inductively coupled plasma mass spectrometry (ICP-MS) at Tohoku University (Yamasaki, 1996; Yamasaki et al., 2013). Detailed analytical conditions are described in Higashino et al. (2015).
In situ laser ablation (LA-) ICP-MS analyses of REE and trace element concentrations in minerals were performed using an iCAP-Qc quadrupole-based ICP-MS coupled with a NWR-193 ArF Excimer laser ablation system at Kyoto University. Analytical conditions for the LA-ICP-MS analysis are summarized in Higashino et al. (2015).
MINERAL DESCRIPTION
Garnet
Garnet in the Grt–Hbl selvage
Garnet in the Grt–Hbl selvage is ∼7–10 mm in diameter, and contains abundant tiny (i.e. a few μm) inclusions of hornblende (1·9 wt % Cl, XMg = 0·45), biotite (1·1 wt % Cl, XMg = 0·61), plagioclase (An48) and quartz (Fig. 3a, c). It has a composition of Alm57–62Prp19–25Grs15–19Sps2–3 and XMg [=Mg/(Fetotal + Mg)] = 0·24–0·30 (Higashino et al., 2015) and consists of Mn-poor cores (∼1.0 wt % MnO) and more Mn-rich rims (∼1·4–1·5 wt % MnO) with diffuse boundaries (Fig. 4b). With distance from the crack, the Mn-richer rims of the garnet become thinner. The CaO content (∼5·0–6·1 wt %) shows zoning roughly opposite to Mn (Fig. 5a;Table 1). The Fe content remains constant throughout (Table 1). The garnet is also not zoned with respect to trace elements and REE, and their concentrations are low; 34–44 μg/g Sc, 10–20 μg/g Y, and less than 3 μg/g REE (Fig. 5a;Table 2).
Representative mineral compositions from the Grt-Hbl selvage and the wall rock; ∼ 10 mm and ∼ 20 mm from the crack.
| ̀ | Center of the Grt-Hbl selvage | |||||
|---|---|---|---|---|---|---|
| Analyses number | TK2009121002C 2 | TK2009121002C 7 | Bt 3 | Amp 2 | TK2009121002C 14 | Ap13-5 |
| Mineral | Grt core | Grt rim | Bt present in matrix | Hbl present in matrix | Pl present in matrix | Ap |
| SiO2 | 38·8 | 38·4 | 39·1 | 39·1 | 55·4 | n.d. |
| TiO2 | 0·1 | 0·1 | 0·7 | 0·9 | 0·1 | n.d. |
| Al2O3 | 21·4 | 21·3 | 14·3 | 13·9 | 27·5 | n.d. |
| Cr2O3 | b·d | b·d | b·d | b.d. | b·d | n.d. |
| FeO | 27·3 | 27·4 | 16·9 | 20·2 | 0·1 | 0·1 |
| MnO | 0·8 | 1·3 | b.d. | 0·2 | b.d. | 0·0 |
| MgO | 6·1 | 5·8 | 15·1 | 7·5 | b.d. | 0·0 |
| CaO | 5·9 | 5·3 | 0·1 | 11·1 | 9·9 | 55·7 |
| BaO | b.d. | b.d. | 0·2 | 0·1 | b.d. | n.d. |
| Na2O | b.d. | b.d. | 0·1 | 1·3 | 5·7 | b.d. |
| K2O | b.d. | b.d. | 9·0 | 2·2 | 0·1 | n.d. |
| F | n.d. | n.d. | 0·7 | b.d. | n.d. | 3·0 |
| Cl | n.d. | n.d. | 1·1 | 1·9 | n.d. | 0·7 |
| O=F | n.d. | n.d. | 0·3 | b.d. | n.d. | 1·2 |
| O=Cl | n.d. | n.d. | 0·3 | 0·4 | n.d. | 0·1 |
| P2O5 | n.d. | n.d. | n.d. | n.d. | n.d. | 41·3 |
| Total [wt %] | 100·5 | 99·5 | 96·9 | 98·1 | 98·9 | 99·4 |
| number of O | 12 | 12 | 22 | 23 | 8 | 25 |
| Si | 3·01 | 3·01 | 5·84 | 6·11 | 2·52 | n.d. |
| Ti | 0·01 | 0·00 | 0·07 | 0·10 | 0·00 | n.d. |
| Al | 1·96 | 1·97 | 2·52 | 2·57 | 1·48 | n.d. |
| Cr | b·d | b·d | b·d | 0·0 | b·d | n.d. |
| Fetotal | 1·77 | 1·80 | 2·12 | 2·65 | 0·00 | 0·02 |
| Mn | 0·05 | 0·08 | b.d. | 0·0 | b.d. | 0·00 |
| Mg | 0·71 | 0·68 | 3·36 | 1·75 | b.d. | 0·00 |
| Ca | 0·49 | 0·45 | 0·02 | 1·86 | 0·48 | 10·13 |
| Ba | b.d. | b.d. | 0·01 | 0·01 | b.d. | n.d. |
| Na | b.d. | b.d. | 0·03 | 0·40 | 0·50 | b.d. |
| K | b.d. | b.d. | 1·72 | 0·44 | 0·01 | n.d. |
| F | n.d. | n.d. | 0·32 | 0·00 | n.d. | 1·58 |
| Cl | n.d. | n.d. | 0·29 | 0·50 | n.d. | 0·19 |
| P | n.d. | n.d. | n.d. | n.d. | n.d. | 5·94 |
| Total cation | 8·00 | 8·00 | 15·70 | 15·92 | 4·99 | 16·09 |
| Mg/(Mg+Fetotal) | 0·29 | 0·27 | 0·61 | 0·40 | - | - |
| log(fHF/fH2O) of fluid | – | – | −4·32 | – | – | −3·54 |
| log(fHCl/fH2O) of fluid | – | – | −2·41 | – | – | −2·34 |
| An [= 100Ca/(Ca+Na+K+Ba)] | – | – | – | – | 49 | – |
| ∼10 mm off the crack | |||||||||
|---|---|---|---|---|---|---|---|---|---|
| Analyses number | TK2009121002C 41 | TK2009121002C 42 | Bt 23 | Amp 21 | TK2009121002C 30 | TK2009121002C 36 | TK2009121002C 38 | Opx 61 | Ap5-5 |
| Mineral | Grt core | Grt rim | Bt present in matrix | Hbl present in matrix | Pl core present in matrix | Pl mantle present in matrix | Pl rim present in matrix | Opx core present in matrix | Ap |
| SiO2 | 38·2 | 37·8 | 36·7 | 41·1 | 53·3 | 50·4 | 53·7 | 52·0 | n.d. |
| TiO2 | b.d. | 0·1 | 4·9 | 1·5 | 0·2 | b.d. | b.d. | b.d. | n.d. |
| Al2O3 | 21·9 | 21·1 | 14·5 | 13·4 | 28·6 | 30·7 | 27·2 | 1·7 | n.d. |
| Cr2O3 | 0·1 | b.d. | b.d. | b.d. | b.d. | b.d. | b.d. | b.d. | n.d. |
| FeO | 28·0 | 28·3 | 18·2 | 18·6 | b.d. | 0·1 | 1·3 | 27·8 | 0·1 |
| MnO | 1·1 | 1·3 | 0·1 | 0·1 | b.d. | b.d. | b.d. | 0·4 | 0·0 |
| MgO | 6·1 | 5·4 | 12·3 | 8·8 | b.d. | b.d. | 0·2 | 17·9 | 0·0 |
| CaO | 5·8 | 5·9 | b.d. | 11·3 | 11·2 | 14·1 | 10·4 | 0·6 | 56·2 |
| BaO | b.d. | b.d. | 0·7 | 0·1 | 0·2 | b.d. | b.d. | b.d. | n.d. |
| Na2O | b.d. | b.d. | 0·1 | 1·3 | 5·0 | 3·5 | 5·4 | b.d. | b.d. |
| K2O | b.d. | b.d. | 9·3 | 1·7 | 0·1 | 0·1 | 0·1 | b.d. | n.d. |
| F | n.d. | n.d. | 0·4 | b.d. | n.d. | n.d. | n.d. | n.d. | 2·9 |
| Cl | n.d. | n.d. | 0·5 | 0·9 | n.d. | n.d. | n.d. | n.d. | 0·4 |
| O=F | n.d. | n.d. | 0·2 | b.d. | n.d. | n.d. | n.d. | n.d. | 1·2 |
| O=Cl | n.d. | n.d. | 0·1 | 0·2 | n.d. | n.d. | n.d. | n.d. | 0·1 |
| P2O5 | n.d. | n.d. | n.d. | n.d. | n.d. | n.d. | n.d. | n.d. | 42·3 |
| Total [wt %] | 101·3 | 100·1 | 97·3 | 98·5 | 98·5 | 99·0 | 98·4 | 100·4 | 100·5 |
| number of O | 12 | 12 | 22 | 23 | 8 | 8 | 8 | 6 | 25 |
| Si | 2·96 | 2·98 | 5·52 | 6·25 | 2·44 | 2·32 | 2·48 | 1·98 | n.d. |
| Ti | b.d. | 0·01 | 0·55 | 0·17 | 0·01 | b.d. | b.d. | b.d. | n.d. |
| Al | 2·00 | 1·96 | 2·57 | 2·40 | 1·55 | 1·67 | 1·48 | 0·08 | n.d. |
| Cr | 0·00 | b.d. | b.d. | b.d. | b.d. | b.d. | b.d. | b.d. | n.d. |
| Fetotal | 1·81 | 1·86 | 2·28 | 2·36 | b.d. | 0·01 | 0·05 | 0·88 | 0·02 |
| Mn | 0·07 | 0·09 | 0·01 | 0·01 | b.d. | b.d. | b.d. | 0·01 | 0·00 |
| Mg | 0·70 | 0·64 | 2·76 | 2·00 | b.d. | b.d. | 0·01 | 1·01 | 0·00 |
| Ca | 0·48 | 0·50 | b.d. | 1·84 | 0·55 | 0·70 | 0·51 | 0·02 | 10·05 |
| Ba | b.d. | b.d. | 0·04 | 0·00 | 0·00 | b.d. | b.d. | b.d. | n.d. |
| Na | b.d. | b.d. | 0·02 | 0·38 | 0·44 | 0·31 | 0·48 | b.d. | b.d. |
| K | b.d. | b.d. | 1·78 | 0·32 | 0·01 | 0·01 | 0·01 | b.d. | n.d. |
| F | n.d. | n.d. | 0·21 | b.d. | n.d. | n.d. | n.d. | n.d. | 1·55 |
| Cl | n.d. | n.d. | 0·14 | 0·23 | n.d. | n.d. | n.d. | n.d. | 0·12 |
| P | n.d. | n.d. | n.d. | n.d. | n.d. | n.d. | n.d. | n.d. | 5·97 |
| Total cation | 8·04 | 8·04 | 15·54 | 15·73 | 5·00 | 5·01 | 5·02 | 3·99 | 16·04 |
| Mg/(Mg+Fetotal) | 0·28 | 0·25 | 0·55 | 0·46 | – | – | – | 0·54 | – |
| log(fHF/fH2O) of fluid | – | – | –4·46 | – | – | – | – | – | –3·72 |
| log(fHCl/fH2O) of fluid | – | – | –2·79 | – | – | – | – | – | –2·73 |
| An [= 100Ca/(Ca+Na+K+Ba)] | – | – | – | – | 55 | 69 | 51 | – | – |
| ∼20 mm off the crack | |||||||||
|---|---|---|---|---|---|---|---|---|---|
| Analyses number | TK2009121002C 46 | Bt38 | Amp 41 | TK2009121002C 39 | TK2009121002C 50 | TK2009121002C 51 | Opx 65 | Ap8-5 | |
| Mineral | Grt core | Bt present in matrix | Hbl present in matrix | Pl core present in matrix | Pl mantle present in matrix | Pl rim present in matrix | Opx core present in matrix | Ap | |
| SiO2 | 38·2 | 38·1 | 42·0 | 53·3 | 50·6 | 54·9 | 51·5 | n.d. | |
| TiO2 | b.d. | 4·3 | 1·8 | 0·1 | 0·1 | b.d. | 0·1 | n.d. | |
| Al2O3 | 21·3 | 14·2 | 13·3 | 28·8 | 30·8 | 27·7 | 1·9 | n.d. | |
| Cr2O3 | b.d. | b.d. | b.d. | b.d. | b.d. | b.d. | b.d. | n.d. | |
| FeO | 26·9 | 18·0 | 18·0 | 0·2 | 0·1 | b.d. | 28·8 | 0·3 | |
| MnO | 1·0 | b.d. | b.d. | b.d. | 0·1 | b.d. | 0·2 | 0·0 | |
| MgO | 5·8 | 13·1 | 9·4 | b.d. | b.d. | b.d. | 18·3 | 0·0 | |
| CaO | 6·5 | b.d. | 11·4 | 11·9 | 14·1 | 10·4 | 0·6 | 55·8 | |
| BaO | b.d. | 0·3 | 0·1 | b.d. | 0·2 | b.d. | b.d. | n.d. | |
| Na2O | b.d. | 0·1 | 1·3 | 4·8 | 3·4 | 5·5 | b.d. | b.d. | |
| K2O | b.d. | 9·6 | 1·7 | 0·1 | b.d. | 0·1 | b.d. | n.d. | |
| F | n.d. | 0·4 | b.d. | n.d. | n.d. | n.d. | n.d. | 3·0 | |
| Cl | n.d. | 0·4 | 0·6 | n.d. | n.d. | n.d. | n.d. | 0·3 | |
| O=F | n.d. | 0·2 | b.d. | n.d. | n.d. | n.d. | n.d. | 1·3 | |
| O=Cl | n.d. | 0·1 | 0·1 | n.d. | n.d. | n.d. | n.d. | 0·1 | |
| P2O5 | n.d. | n.d. | n.d. | n.d. | n.d. | n.d. | n.d. | 41·9 | |
| Total [wt %] | 99·7 | 98·2 | 99·4 | 99·1 | 99·5 | 98·7 | 101·4 | 100·0 | |
| number of O | 12 | 22 | 23 | 8 | 8 | 8 | 6 | 25 | |
| Si | 3·00 | 5·64 | 6·28 | 2·43 | 2·32 | 2·50 | 1·95 | n.d. | |
| Ti | b.d. | 0·48 | 0·20 | 0·00 | 0·00 | b.d. | 0·00 | n.d. | |
| Al | 1·97 | 2·48 | 2·34 | 1·55 | 1·66 | 1·49 | 0·09 | n.d. | |
| Cr | b.d. | b.d. | b.d. | b.d. | b.d. | b.d. | b.d. | n.d. | |
| Fetotal | 1·76 | 2·22 | 2·25 | 0·01 | 0·01 | b.d. | 0·91 | 0·04 | |
| Mn | 0·06 | b.d. | b.d. | b.d. | 0·00 | b.d. | 0·01 | 0·01 | |
| Mg | 0·68 | 2·88 | 2·09 | b.d. | b.d. | b.d. | 1·03 | 0·00 | |
| Ca | 0·54 | b.d. | 1·83 | 0·58 | 0·69 | 0·51 | 0·02 | 10·05 | |
| Ba | b.d. | 0·01 | 0·00 | b.d. | 0·00 | b.d. | b.d. | n.d. | |
| Na | b.d. | 0·03 | 0·38 | 0·42 | 0·31 | 0·48 | b.d. | b.d. | |
| K | b.d. | 1·80 | 0·33 | 0·01 | b.d. | 0·01 | b.d. | n.d. | |
| F | n.d. | 0·18 | b.d. | n.d. | n.d. | n.d. | n.d. | 1·62 | |
| Cl | n.d. | 0·11 | 0·15 | n.d. | n.d. | n.d. | n.d. | 0·10 | |
| P | n.d. | n.d. | n.d. | n.d. | n.d. | n.d. | n.d. | 5·96 | |
| Total cation | 8·02 | 15·55 | 15·70 | 5·00 | 5·00 | 4·99 | 4·01 | 16·06 | |
| Mg/(Mg+Fetotal) | 0·28 | 0·56 | 0·48 | – | – | – | 0·53 | – | |
| log(fHF/fH2O) of fluid | – | –4·52 | – | – | – | – | – | –3·63 | |
| log(fHCl/fH2O) of fluid | – | –2·87 | – | – | – | – | – | –2·74 | |
| An [= 100Ca/(Ca+Na+K+Ba)] | – | – | – | 58 | 69 | 51 | – | – | |
Fugacity ratios of fluid are calculated based on Munoz (1992) for biotite, and Piccoli & Candela (1994) for apatite assuming P-T conditions of 770 °C and 0.72 GPa. n.d.; not determined· b.d.; below detection limit·
Trace element composition of garnet, hornblende, biotite, orthopyroxene, plagioclase, and apatite determined by in situ LA-ICPMS analyses.
| Mineral | Grt | Grt | Grt | Grt | Grt | Grt | Grt | Grt | |
|---|---|---|---|---|---|---|---|---|---|
| Analysis number | 5_4 | 6_3 | 6_4 | 6_17 | 7_2 | 8_20 | 9_1 | 10_2 | |
| Distance from the crack [mm] | 0.6 | 1.2 | 3.9 | 8.6 | 18.3 | 26.9 | 33.6 | 46.4 | |
| [μg/g] | |||||||||
| Li | 0·3 | 1·0 | 1·1 | 1·3 | 0·5 | 1·1 | 0·5 | 0·8 | |
| P | 44·1 | 64·2 | 61·9 | 48·7 | 56·5 | 42·6 | 30·3 | 58·8 | |
| Sc | 58·4 | 45·6 | 77·2 | 112·8 | 177·2 | 178·1 | 105·6 | 105·1 | |
| V | 94·9 | 139·7 | 142·0 | 115·1 | 126·5 | 98·3 | 100·5 | 143·3 | |
| Cr | 38·7 | 38·2 | 43·0 | 28·1 | 96·2 | 46·1 | 16·3 | 19·2 | |
| Co | 24·5 | 27·0 | 26·2 | 26·3 | 25·2 | 27·4 | 29·5 | 30·6 | |
| Ni | b.d. | b.d. | 1·5 | 0·7 | 0·8 | 0·9 | 0·2 | b.d. | |
| Cu | 0·4 | 0·1 | b.d. | 0·3 | 0·1 | 0·6 | b.d. | 0·4 | |
| Zn | 33·9 | 39·1 | 39·5 | 33·4 | 28·9 | 34·5 | 32·0 | 33·9 | |
| Ga | 7·6 | 7·2 | 8·4 | 8·5 | 7·1 | 6·5 | 8·4 | 9·3 | |
| Ge | 4·7 | 3·8 | 2·6 | 3·6 | 2·7 | 2·4 | 1·2 | 1·1 | |
| Rb | b.d. | b.d. | b.d. | 0·2 | b.d. | b.d. | 0·1 | b.d. | |
| Sr | b.d. | b.d. | b.d. | b.d. | b.d. | b.d. | b.d. | b.d. | |
| Y | 25·7 | 4·3 | 46·1 | 22·5 | 78·8 | 64·2 | 22·6 | 9·6 | |
| Zr | 2·5 | 6·1 | 2·4 | 2·6 | 2·2 | 2·1 | 2·3 | 2·4 | |
| Nb | b.d. | b.d. | b.d. | b.d. | b.d. | 0·0 | b.d. | b.d. | |
| Mo | 0·4 | 0·2 | 0·1 | 0·5 | 0·5 | 0·5 | 0·2 | b.d. | |
| Ba | b.d. | b.d. | b.d. | b.d. | b.d. | b.d. | b.d. | b.d. | |
| La | b.d. | b.d. | b.d. | b.d. | b.d. | b.d. | b.d. | b.d. | |
| Ce | 0·1 | 0·1 | 0·1 | 0·1 | 0·1 | 0·1 | 0·1 | 0·2 | |
| Pr | b.d. | b.d. | b.d. | 0·1 | 0·1 | 0·1 | 0·2 | 0·1 | |
| Nd | 0·3 | 0·7 | 1·2 | 1·4 | 0·7 | 1·4 | 1·4 | 2·3 | |
| Sm | 0·7 | 1·2 | 2·3 | 2·6 | 2·1 | 2·9 | 2·3 | 2·3 | |
| Eu | 0·5 | 0·5 | 0·9 | 1·0 | 0·7 | 0·9 | 0·9 | 1·3 | |
| Gd | 2·1 | 0·9 | 4·1 | 3·6 | 6·6 | 7·5 | 3·3 | 2·9 | |
| Tb | 0·5 | 0·2 | 0·8 | 0·7 | 1·7 | 1·5 | 0·6 | 0·4 | |
| Dy | 3·2 | 1·2 | 6·6 | 3·5 | 12·4 | 10·6 | 3·7 | 2·2 | |
| Ho | 1·1 | 0·2 | 1·5 | 0·8 | 3·0 | 1·7 | 0·6 | 0·3 | |
| Er | 2·6 | 0·2 | 6·0 | 2·1 | 8·1 | 6·3 | 2·3 | 0·4 | |
| Tm | 0·3 | b.d. | 0·7 | 0·3 | 1·0 | 0·9 | 0·3 | b.d. | |
| Yb | 2·3 | 0·1 | 6·9 | 3·0 | 9·3 | 9·2 | 3·9 | 0·3 | |
| Lu | 0·4 | b.d. | 1·3 | 0·4 | 1·5 | 1·2 | 0·5 | b.d. | |
| Pb | 0·1 | 0·1 | b.d. | b.d. | 0·1 | b.d. | b.d. | b.d. | |
| Th | b.d. | b.d. | b.d. | b.d. | b.d. | b.d. | b.d. | b.d. | |
| U | b.d. | b.d. | 0·1 | b.d. | b.d. | b.d. | b.d. | b.d. | |
| Mineral | Hbl | Hbl | Hbl | Hbl | Hbl | Hbl | Hbl | Hbl | Bt |
|---|---|---|---|---|---|---|---|---|---|
| Analysis number | 5_5 | 5_20 | 7_16 | 7_13 | 8_10 | 9_8 | 10_13 | 10_9 | 5_7 |
| Distance from the crack [mm] | 0·3 | 5·0 | 12·8 | 15·0 | 25·3 | 35·1 | 40·5 | 45·6 | 1·1 |
| [μg/g] | |||||||||
| Li | 2·7 | 2·7 | 1·8 | 2·0 | 1·7 | 2·5 | 2·1 | 2·6 | 55·4 |
| P | 82·1 | 71·9 | 41·8 | 30·3 | 62·7 | 62·0 | 54·5 | 32·3 | 25·8 |
| Sc | 68·9 | 92·4 | 260·5 | 362·7 | 327·4 | 182·3 | 263·2 | 219·4 | 11·1 |
| V | 499·0 | 560·8 | 890·2 | 799·4 | 852·6 | 519·5 | 1068·6 | 1025·0 | 485·4 |
| Cr | 53·5 | 67·1 | 208·4 | 114·1 | 84·3 | 36·6 | 89·5 | 231·1 | 68·4 |
| Co | 53·4 | 78·1 | 43·8 | 46·3 | 47·9 | 49·0 | 48·9 | 50·4 | 83·1 |
| Ni | 11·0 | 24·1 | 9·2 | 9·7 | 10·8 | 9·3 | 6·7 | 9·6 | 17·4 |
| Cu | 0·9 | 3·2 | 1·3 | 0·8 | 0·7 | 1·4 | 0·7 | 1·2 | 1·8 |
| Zn | 178·4 | 175·3 | 136·0 | 137·8 | 114·4 | 123·0 | 135·2 | 130·1 | 217·2 |
| Ga | 24·5 | 22·0 | 23·4 | 23·2 | 24·4 | 22·2 | 29·1 | 28·1 | 20·0 |
| Ge | 2·1 | 2·4 | 4·0 | 2·7 | 4·8 | 3·6 | 3·6 | 5·1 | 1·0 |
| Rb | 20·7 | 9·9 | 6·0 | 6·5 | 6·5 | 7·9 | 7·3 | 6·9 | 520·7 |
| Sr | 232·5 | 145·5 | 53·6 | 51·5 | 55·4 | 47·7 | 49·9 | 50·1 | 16·8 |
| Y | 9·9 | 18·4 | 137·5 | 178·1 | 180·9 | 35·0 | 43·9 | 122·6 | 0·3 |
| Zr | 31·4 | 24·7 | 26·3 | 28·1 | 31·8 | 20·5 | 26·2 | 28·5 | 0·2 |
| Nb | 3·6 | 4·0 | 6·8 | 6·0 | 8·0 | 8·3 | 6·9 | 8·2 | 5·9 |
| Mo | 0·5 | 0·2 | b.d. | b.d. | b.d. | b.d. | b.d. | b.d. | 0·9 |
| Ba | 2693·6 | 191·3 | 121·1 | 130·2 | 137·1 | 170·4 | 127·3 | 121·5 | 8581·9 |
| La | 34·2 | 29·8 | 28·7 | 24·9 | 31·3 | 27·0 | 25·5 | 26·7 | 0·1 |
| Ce | 83·9 | 73·2 | 116·8 | 99·0 | 128·5 | 117·5 | 114·1 | 111·3 | b.d. |
| [μg/g] | |||||||||
| Pr | 11·0 | 12·0 | 24·8 | 21·5 | 26·3 | 22·4 | 19·8 | 20·0 | b.d. |
| Nd | 45·9 | 48·4 | 121·6 | 112·8 | 130·7 | 107·7 | 90·7 | 99·7 | b.d. |
| Sm | 8·5 | 11·3 | 34·3 | 31·1 | 35·8 | 27·6 | 23·3 | 25·9 | b.d. |
| Eu | 3·1 | 2·4 | 5·2 | 4·6 | 5·3 | 4·3 | 4·2 | 3·9 | 0·5 |
| Gd | 10·5 | 7·7 | 28·5 | 26·8 | 25·9 | 15·6 | 13·6 | 24·7 | 7·2 |
| Tb | 0·6 | 1·0 | 4·3 | 4·9 | 4·8 | 2·0 | 1·6 | 3·5 | b.d. |
| Dy | 2·4 | 4·4 | 25·7 | 33·0 | 31·5 | 8·0 | 8·4 | 23·9 | b.d. |
| Ho | 0·2 | 0·7 | 6·0 | 6·7 | 7·5 | 1·3 | 1·9 | 4·8 | b.d. |
| Er | 0·8 | 1·8 | 14·5 | 19·0 | 21·5 | 3·2 | 4·6 | 12·9 | b.d. |
| Tm | b.d. | 0·2 | 1·5 | 2·8 | 2·6 | 0·3 | 0·7 | 1·4 | b.d. |
| Yb | 0·2 | 1·0 | 11·1 | 17·7 | 15·3 | 2·3 | 2·7 | 8·9 | b.d. |
| Lu | b.d. | 0·1 | 1·4 | 2·6 | 1·6 | 0·1 | 0·4 | 1·4 | b.d. |
| Pb | 25·6 | 20·4 | 8·7 | 7·2 | 3·6 | 1·7 | 1·9 | 1·7 | 20·0 |
| Th | 1·0 | 0·4 | 0·7 | 0·3 | 0·2 | 0·6 | 0·7 | 0·6 | b.d. |
| U | 2·4 | 1·6 | 0·4 | 0·4 | 0·1 | 0·2 | 0·1 | 0·2 | b.d. |
| Mineral | Bt | Bt | Bt | Bt | Bt | Bt | Bt | Opx | Opx | Opx |
|---|---|---|---|---|---|---|---|---|---|---|
| Analysis number | 5_19 | 6_11 | 7_11 | 8_16 | 8_5 | 9_11 | 10_8 | 5_9 | 6_9 | 7_9 |
| Distance from the crack [mm] | 5·3 | 8·9 | 14·7 | 25·8 | 30·8 | 35·6 | 47·2 | 5·0 | 9·7 | 15·3 |
| [μg/g] | ||||||||||
| Li | 50·7 | 23·5 | 23·8 | 22·0 | 21·6 | 22·8 | 26·1 | 3·2 | 4·4 | 2·2 |
| P | 15·9 | 26·7 | 28·9 | 43·5 | 39·1 | 24·9 | 20·9 | 50·4 | 52·0 | 61·0 |
| Sc | 9·6 | 19·0 | 25·9 | 17·3 | 16·6 | 19·3 | 17·5 | 28·7 | 92·0 | 105·2 |
| V | 497·9 | 697·3 | 770·0 | 605·3 | 648·2 | 654·8 | 895·2 | 108·7 | 133·1 | 92·1 |
| Cr | 74·4 | 63·9 | 189·6 | 60·8 | 94·5 | 76·4 | 209·8 | 33·3 | 39·7 | 25·9 |
| Co | 73·3 | 77·5 | 76·6 | 67·8 | 67·8 | 85·8 | 77·0 | 66·9 | 68·2 | 68·9 |
| Ni | 16·0 | 23·5 | 20·7 | 15·4 | 17·6 | 16·8 | 19·8 | 7·5 | 8·5 | 7·7 |
| Cu | 1·6 | 8·5 | 3·2 | 9·9 | 2·4 | 9·8 | 50·3 | 0·7 | b.d. | b.d. |
| Zn | 209·0 | 188·9 | 181·0 | 140·1 | 150·3 | 158·7 | 149·2 | 377·4 | 356·0 | 351·0 |
| Ga | 20·2 | 17·7 | 18·7 | 16·8 | 19·8 | 20·3 | 23·3 | 8·5 | 10·7 | 6·0 |
| Ge | 0·5 | 0·7 | 1·2 | 0·9 | 2·3 | 1·5 | 1·1 | 4·5 | 3·2 | 3·4 |
| Rb | 534·9 | 360·6 | 303·1 | 283·4 | 275·8 | 316·4 | 328·2 | b.d. | 0·1 | b.d. |
| Sr | 20·3 | 4·5 | 5·8 | 2·9 | 5·8 | 5·1 | 4·1 | b.d. | b.d. | b.d. |
| Y | 0·3 | 0·1 | 0·1 | b.d. | b.d. | b.d. | 0·1 | 0·6 | 2·3 | 3·5 |
| Zr | 0·3 | 1·7 | 1·6 | 0·4 | 1·5 | 0·2 | 1·0 | 0·5 | 1·0 | 0·8 |
| Nb | 5·4 | 8·1 | 9·7 | 8·9 | 9·6 | 11·1 | 8·3 | b.d. | b.d. | b.d. |
| Mo | 1·1 | 0·2 | 0·4 | 0·2 | b.d. | b.d. | b.d. | 0·2 | b.d. | 0·3 |
| Ba | 5465·3 | 2973·4 | 2384·6 | 2492·8 | 2591·9 | 3394·1 | 2393·2 | b.d. | b.d. | b.d. |
| La | 0·1 | b.d. | b.d. | b.d. | b.d. | 0·1 | b.d. | b.d. | 0·1 | 0·1 |
| Ce | b.d. | b.d. | b.d. | b.d. | b.d. | b.d. | 0·0 | b.d. | 0·1 | 0·6 |
| Pr | b.d. | 0·0 | b.d. | b.d. | b.d. | b.d. | b.d. | b.d. | b.d. | b.d. |
| Nd | b.d. | b.d. | b.d. | b.d. | b.d. | b.d. | b.d. | b.d. | 0·3 | 0·4 |
| Sm | b.d. | b.d. | b.d. | b.d. | b.d. | b.d. | b.d. | b.d. | b.d. | 0·1 |
| Eu | 0·3 | 0·1 | 0·2 | 0·2 | 0·2 | 0·3 | 0·1 | b.d. | b.d. | b.d. |
| Gd | 3·6 | 1·0 | 0·4 | 1·0 | 0·6 | b.d. | b.d. | b.d. | b.d. | 0·3 |
| Tb | b.d. | b.d. | b.d. | b.d. | b.d. | b.d. | b.d. | b.d. | b.d. | 0·1 |
| Dy | b.d. | b.d. | b.d. | b.d. | b.d. | b.d. | b.d. | b.d. | 0·4 | 0·7 |
| Ho | b.d. | b.d. | b.d. | b.d. | b.d. | b.d. | b.d. | b.d. | 0·1 | b.d. |
| Er | b.d. | b.d. | b.d. | b.d. | b.d. | b.d. | b.d. | 0·1 | 0·3 | 0·6 |
| Tm | b.d. | b.d. | b.d. | b.d. | b.d. | b.d. | b.d. | b.d. | b.d. | b.d. |
| Yb | b.d. | b.d. | b.d. | b.d. | b.d. | b.d. | b.d. | b.d. | 0·3 | 1·0 |
| Lu | b.d. | b.d. | b.d. | b.d. | b.d. | b.d. | b.d. | b.d. | 0·1 | 0·1 |
| Pb | 20·4 | 9·9 | 6·9 | 2·9 | 2·1 | 1·5 | 1·8 | b.d. | b.d. | b.d. |
| Th | b.d. | b.d. | b.d. | b.d. | b.d. | b.d. | b.d. | b.d. | b.d. | 0·3 |
| U | b.d. | b.d. | b.d. | b.d. | b.d. | b.d. | b.d. | b.d. | b.d. | 0·1 |
| Mineral | Opx | Opx | Opx | Pl | Pl | Pl | Pl | Pl | Pl | Pl |
|---|---|---|---|---|---|---|---|---|---|---|
| Analysis number | 8_3 | 9_10 | 10_3 | 5_15 | 5_11 | 6_8 | 7_1 | 8_14 | 9_16 | 10_10 |
| Distance from the crack [mm] | 28·3 | 35·6 | 45·6 | 1·4 | 5·3 | 10·6 | 20·3 | 25·6 | 36·4 | 45·9 |
| [μg/g] | ||||||||||
| Li | 3·4 | 3·4 | 2·8 | 4·7 | 5·0 | 0·7 | 0·4 | 0·1 | 2·7 | 0·6 |
| P | 54·3 | 39·6 | 44·3 | 37·4 | 99·5 | 76·1 | 84·4 | 43·7 | 55·8 | 53·4 |
| Sc | 53·7 | 55·8 | 66·4 | 9·8 | 8·3 | 5·0 | 6·0 | 10·1 | 10·0 | 10·9 |
| V | 118·0 | 135·1 | 126·1 | b.d. | 0·2 | b.d. | b.d. | 0·3 | b.d. | b.d. |
| Cr | 32·7 | 30·2 | 33·6 | 3·9 | 10·5 | 16·1 | b.d. | 2·7 | b.d. | 7·2 |
| Co | 62·5 | 67·8 | 66·7 | 0·2 | 0·1 | 0·2 | 0·5 | 0·3 | b.d. | 0·5 |
| Ni | 6·6 | 6·3 | 5·8 | b.d. | 1·3 | 0·6 | 1·2 | 0·3 | 0·8 | b.d. |
| Cu | b.d. | 7·2 | b.d. | 1·0 | 0·8 | 0·9 | 1·1 | 0·9 | 1·0 | 1·4 |
| Zn | 293·2 | 285·2 | 283·5 | 0·1 | b.d. | b.d. | b.d. | 2·3 | b.d. | 5·1 |
| Ga | 9·7 | 9·7 | 9·4 | 23·7 | 21·6 | 17·8 | 16·7 | 19·5 | 17·7 | 24·5 |
| Ge | 3·8 | 4·4 | 2·8 | b.d. | 2·4 | 1·2 | 1·4 | 1·4 | 2·1 | 1·7 |
| Rb | b.d. | 0·1 | 0·1 | 0·1 | 0·2 | 0·1 | 0·1 | 0·2 | 0·2 | 0·1 |
| Sr | b.d. | 0·3 | b.d. | 991·9 | 732·0 | 411·1 | 444·4 | 436·3 | 435·2 | 398·2 |
| Y | 2·1 | 1·1 | 2·3 | b.d. | b.d. | b.d. | b.d. | b.d. | b.d. | 0·2 |
| Zr | 0·8 | 1·1 | 0·7 | b.d. | b.d. | b.d. | b.d. | b.d. | b.d. | b.d. |
| Nb | b.d. | b.d. | b.d. | b.d. | b.d. | b.d. | b.d. | b.d. | b.d. | b.d. |
| Mo | b.d. | b.d. | b.d. | 0·5 | b.d. | b.d. | 0·5 | b.d. | b.d. | b.d. |
| Ba | b.d. | 0·1 | b.d. | 106·9 | 57·1 | 45·2 | 42·2 | 42·2 | 61·3 | 40·9 |
| La | b.d. | 0·1 | b.d. | 6·7 | 8·4 | 7·0 | 9·7 | 7·2 | 8·5 | 10·5 |
| Ce | 0·1 | b.d. | 0·1 | 6·3 | 9·5 | 10·7 | 15·7 | 10·1 | 17·6 | 19·8 |
| Pr | b.d. | b.d. | b.d. | 0·4 | 1·0 | 0·8 | 1·4 | 0·7 | 1·6 | 2·0 |
| Nd | 0·2 | b.d. | 0·2 | 0·5 | 1·9 | 4·5 | 3·4 | 2·1 | 5·5 | 6·7 |
| Sm | b.d. | b.d. | b.d. | b.d. | b.d. | b.d. | 0·4 | b.d. | 0·3 | 0·9 |
| Eu | b.d. | b.d. | b.d. | 0·5 | 0·6 | 1·1 | 1·4 | 0·8 | 0·7 | 0·6 |
| Gd | b.d. | b.d. | b.d. | b.d. | b.d. | b.d. | b.d. | b.d. | b.d. | b.d. |
| Tb | b.d. | b.d. | b.d. | b.d. | b.d. | b.d. | b.d. | b.d. | b.d. | b.d. |
| Dy | 0·2 | 0·3 | 0·2 | b.d. | b.d. | b.d. | b.d. | b.d. | b.d. | b.d. |
| Ho | b.d. | 0·1 | 0·1 | b.d. | b.d. | b.d. | b.d. | b.d. | b.d. | b.d. |
| Er | 0·1 | 0·1 | 0·5 | b.d. | b.d. | b.d. | b.d. | b.d. | b.d. | b.d. |
| Tm | b.d. | b.d. | 0·1 | b.d. | b.d. | b.d. | b.d. | b.d. | b.d. | b.d. |
| Yb | 0·2 | 0·3 | 0·2 | b.d. | b.d. | b.d. | b.d. | b.d. | b.d. | b.d. |
| Lu | 0·1 | b.d. | b.d. | b.d. | b.d. | b.d. | b.d. | b.d. | b.d. | b.d. |
| Pb | b.d. | b.d. | b.d. | 41·2 | 40·6 | 28·6 | 13·1 | 10·0 | 4·3 | 4·1 |
| Th | 0·1 | b.d. | b.d. | b.d. | b.d. | b.d. | b.d. | b.d. | b.d. | b.d. |
| U | b.d. | b.d. | b.d. | b.d. | b.d. | b.d. | b.d. | b.d. | b.d. | b.d. |
| Mineral | Ap | Ap | Ap | Ap | Ap | Ap | Ap | Ap | Ap | Ap |
|---|---|---|---|---|---|---|---|---|---|---|
| Analysis number | 1_1 | 2_1 | 4_1 | 4_2 | 5_1 | 6_1 | 8_2 | 9_1 | 10_3 | 10_6 |
| Distance from the crack [mm] | 1·0 | 2·2 | 4·7 | 4·7 | 9·6 | 14·6 | 21·7 | 23·3 | 30·6 | 34·7 |
| [μg/g] | ||||||||||
| Li | b.d. | b.d. | b.d. | b.d. | b.d. | b.d. | b.d. | b.d. | b.d. | b.d. |
| P | n·d· | n·d· | n·d· | n·d· | n·d· | n·d· | n·d· | n·d· | n·d· | n·d· |
| Sc | b.d. | b.d. | b.d. | b.d. | b.d. | b.d. | b.d. | b.d. | b.d. | b.d. |
| V | 2·5 | 4·0 | 1·7 | 2·5 | 3·6 | 2·6 | 3·5 | 2·9 | 3·9 | 2·7 |
| Cr | b.d. | b.d. | b.d. | b.d. | b.d. | b.d. | b.d. | b.d. | b.d. | b.d. |
| Co | b.d. | b.d. | b.d. | b.d. | b.d. | b.d. | b.d. | b.d. | b.d. | b.d. |
| Ni | b.d. | b.d. | b.d. | b.d. | b.d. | b.d. | b.d. | b.d. | b.d. | b.d. |
| Cu | b.d. | b.d. | b.d. | b.d. | b.d. | b.d. | b.d. | b.d. | b.d. | b.d. |
| Zn | b.d. | b.d. | b.d. | b.d. | b.d. | b.d. | b.d. | b.d. | b.d. | b.d. |
| Ga | 7·8 | 11·8 | 7·5 | 8·0 | 9·5 | 5·4 | 5·6 | 7·2 | 6·9 | 16·5 |
| Ge | 3·9 | 5·2 | 3·8 | 3·9 | 8·5 | 5·3 | 7·4 | 5·6 | 7·6 | 18·1 |
| Rb | b.d. | b.d. | b.d. | b.d. | b.d. | b.d. | b.d. | b.d. | b.d. | b.d. |
| Sr | 950·0 | 930·0 | 870·0 | 830·0 | 376·0 | 306·0 | 241·0 | 244·0 | 233·0 | 219·0 |
| Y | 11·7 | 78·0 | 10·0 | 12·3 | 223·0 | 287·0 | 224·0 | 185·0 | 148·0 | 500·0 |
| Zr | b.d. | b.d. | b.d. | b.d. | b.d. | b.d. | b.d. | b.d. | b.d. | b.d. |
| Nb | b.d. | b.d. | b.d. | b.d. | b.d. | b.d. | b.d. | b.d. | b.d. | b.d. |
| Mo | b.d. | b.d. | b.d. | b.d. | b.d. | b.d. | b.d. | b.d. | b.d. | b.d. |
| Ba | b.d. | b.d. | b.d. | b.d. | b.d. | b.d. | b.d. | b.d. | b.d. | b.d. |
| La | 743·0 | 1570·0 | 651·0 | 690·0 | 557·0 | 296·0 | 192·0 | 305·0 | 371·0 | 710·0 |
| Ce | 1100·0 | 1570·0 | 980·0 | 1220·0 | 1247·0 | 835·0 | 660·0 | 785·0 | 846·0 | 1670·0 |
| Pr | 97·6 | 163·0 | 108·0 | 147·0 | 198·0 | 125·2 | 98·0 | 110·2 | 108·0 | 279·0 |
| [μg/g] | ||||||||||
| Nd | 296·0 | 494·0 | 340·0 | 420·0 | 705·0 | 498·0 | 378·0 | 472·0 | 476·0 | 1292·0 |
| Sm | 35·4 | 64·0 | 46·7 | 60·3 | 124·8 | 97·4 | 68·0 | 73·9 | 77·7 | 243·0 |
| Eu | 9·7 | 11·5 | 7·6 | 9·5 | 13·9 | 8·8 | 7·2 | 6·7 | 7·7 | 22·2 |
| Gd | 22·4 | 45·6 | 28·3 | 30·7 | 100·0 | 99·7 | 76·0 | 71·8 | 80·7 | 246·0 |
| Tb | 1·3 | 4·1 | 1·6 | 2·0 | 9·9 | 10·9 | 8·3 | 7·6 | 7·9 | 25·3 |
| Dy | 3·7 | 17·3 | 4·5 | 4·4 | 44·9 | 58·3 | 42·0 | 38·9 | 37·1 | 121·3 |
| Ho | 0·5 | 3·1 | 0·3 | 0·4 | 10·0 | 12·3 | 7·7 | 7·3 | 6·9 | 20·9 |
| Er | 0·6 | 7·2 | 0·5 | 0·6 | 18·9 | 22·2 | 17·0 | 13·7 | 11·6 | 43·6 |
| Tm | 0·1 | 0·7 | b.d. | b.d. | 2·3 | 2·7 | 1·8 | 1·2 | 1·1 | 3·2 |
| Yb | 0·1 | 3·1 | b.d. | 0·1 | 12·8 | 12·7 | 10·1 | 6·5 | 4·7 | 13·1 |
| Lu | b.d. | 0·5 | b.d. | b.d. | 1·4 | 1·5 | 0·8 | 0·8 | 0·5 | 1·8 |
| Pb | 8·0 | 10·1 | 6·0 | 7·2 | 5·1 | 3·3 | 2·5 | 1·8 | 1·3 | 2·3 |
| Th | 14·0 | 35·4 | 2·7 | 5·8 | 7·8 | 2·5 | 1·2 | 2·0 | 2·1 | 34·1 |
| U | 45·1 | 101·0 | 17·5 | 23·9 | 20·7 | 3·3 | 1·1 | 1·1 | 1·1 | 8·9 |
Errors are 15–20% for concentrations of 1000 μg/g, 10–15 % for 10–100 μg/g, and 5–10% for less than 10 μg/g. b.d.; below detection limit.
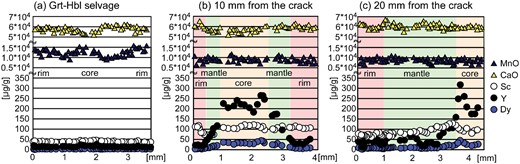
Compositional profiles of garnet in sample TK2009121002C. (a) and (b) show profiles across whole grains, whereas (c) shows the profile for half of the grain. Error bars for each analysis point are smaller than the size of symbols. (a) Garnet in the Grt–Hbl selvage, which has higher MnO and lower CaO than that in the wall-rock. Concentrations of Sc, Y, and Dy are almost constant. (b) Garnet present at ∼ 10 mm from the crack. Note that Y and Dy preserve bell-shaped zoning and Sc is higher than in (a). (c) Garnet present at ∼ 20 mm from the crack. Note that Y and Dy preserve bell-shaped zoning.
Garnet in the wall-rock
Garnet in the wall-rock is typically < 5 mm in diameter and includes biotite, orthopyroxene, plagioclase and minor amounts of quartz (Fig. 3c). It has the composition of Alm58–63Prp20–24Grs14–18Sps2–3 and XMg = 0·24–0·28. It is relatively homogeneous in terms of MnO (∼0·8–0·9 wt % in the core, and ∼0·8–1.0 wt % in the rim) (Fig. 5). The Mn-richer rim becomes thinner with distance from the crack and is absent in garnet at ∼30 mm distance (Fig. 4b). Calcium content is slightly higher than in the garnet in the selvage (Fig. 5). In all garnet grains, rimward increase of Fe and slight decrease of Mg are observed (Table 1).
In contrast to garnet in the selvage, wall-rock garnet grains are zoned with respect to Sc, Y and REE (Gd to Lu) (Fig. 5b). By utilizing the Y zoning, the garnet can be divided into high-Y cores, moderate-Y mantles and low-Y rims. The cores and mantles of garnet show a bell-shaped zoning in Y and HREE, pointing to prograde growth. In garnet located at ∼10 mm from the center of the selvage, Y and REE (Gd to Lu) decrease from the core (∼200 μg/g Y, ∼40 μg/g Dy) to the rim (∼20 μg/g Y, ∼5 μg/g Dy) (Fig. 5b). This trend also applies to the garnet at ∼20 mm distance (Fig. 5c). The rims of the wall-rock garnet grains show similar Y and REE concentrations. The Y-rich cores of garnet include biotite with 0·38–0·40 wt % Cl (XMg = 0·67–0·68), whereas the mantles of garnet include biotite with 0·35–0·37 wt % Cl (XMg = 0·61–0·66), plagioclase (An60) and orthopyroxene (XMg = 0·54–0·56). The Y-poor rims of garnet include biotite with 0·36–0·39 wt % Cl (XMg = 0·54–0·60), plagioclase (An54–61), orthopyroxene and quartz.
Preservation of Y-zoning profiles in garnet cores and mantles in the wall-rock suggests that these garnet domains are unaffected by the selvage-forming event (Fig. 5b, c), which resulted in the flat Y and REE profiles observed in the selvage garnet grains (Fig. 5a). The Y and Dy concentrations of garnet rims in the wall-rock at ∼10 mm from the crack are similar to the garnet in the selvage (Fig. 5), implying that wall-rock garnet in the vicinity of the crack was affected by the selvage-forming event. The flat Y and REE pattern might indicate growth of the garnet rims in an externally-buffered environment rather than an internally-buffered one.
Hornblende
Hornblende in the Grt–Hbl selvage
Hornblende is ∼1–2 mm in diameter, rimming garnet or included in it (Fig. 3a). Chlorine and K concentrations (1·9 wt % Cl and 2·2 wt % K2O in the center of the selvage) decrease towards the wall-rock, whereas XMg remains constant at ∼0·45 (Figs 4d, e, 6a, b;Table 1). This trend is, therefore, not controlled by Mg–Cl avoidance. Fluorine concentration is constantly low and some analysis points are below detection limit (Fig. 6c;Table 1). From the crack towards the wall-rock, Zn, Rb, Sr, Ba, Pb and U in hornblende decrease, whereas Sc, Nb, Ce, Sm, Gd and Dy gradually increase (Fig. 7; Table 2; Supplementary Data Electronic Appendix Fig. 2).
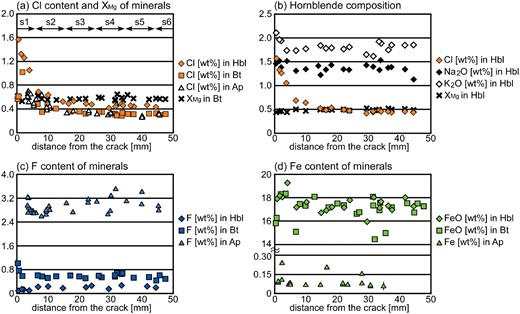
Change of hydrous mineral compositions in sample TK2009121002C as a function of distance from the crack. (a) Chlorine contents of hornblende, biotite and apatite decrease away from the crack, whereas XMg in biotite is almost constant. s1–s6 represent slices 1–6 shown in Fig. 2g. (b) Hornblende composition. Chlorine and K contents similarly decrease away from the crack. Sodium content is almost constant. XMg is broadly constant, although that in the selvage is slightly lower than in the wall-rock. (c) Fluorine concentration of hornblende, biotite and apatite. Some hornblende grains show low values below the detection limit (not shown). (d) The FeO contents of hornblende and biotite (EPMA), and the Fe concentration of apatite (LA-ICP-MS). The FeO contents of hornblende and apatite show weakly decreasing trends from the crack. For simplicity, an error bar is shown only for the rightmost analysis point.
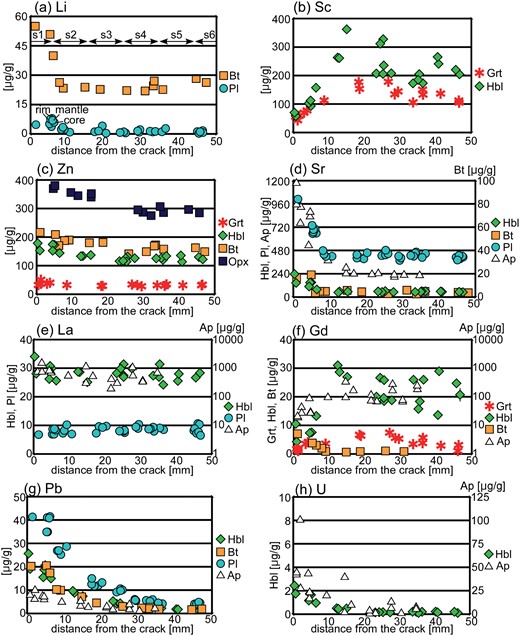
Change of trace element concentrations of minerals as a function of distance from the crack (sample TK2009121002C). For simplicity, error bars are shown only for the rightmost analysis points of each element for each mineral (most of them are within the size of the symbols). (a) Change of Li concentration in biotite and plagioclase. Exponentially decreasing profiles exist within ∼ 10 mm from the crack. s1–s6 represent slices 1–6 shown in Fig. 2g. (b) Scandium concentration in garnet and hornblende. Garnet shows an exponentially increasing profile, and hornblende seems to show a parabolic profile. (c) Zinc concentration in garnet, hornblende, biotite and orthopyroxene decreases with distance from the crack. (d) Strontium concentration of hornblende, biotite, plagioclase and apatite. The concentrations gradually decrease with distance from the crack and become constant at ∼ 8–15 mm. (e) Lanthanum concentrations in hornblende, plagioclase and apatite are broadly constant. (f) Change of Gd concentration in garnet, hornblende, biotite and apatite. Hornblende and apatite show exponentially increasing profiles and biotite shows an exponentially decreasing profile. (g) Change of Pb concentration in hornblende, biotite, plagioclase and apatite. These four minerals show exponentially decreasing profiles with a distance from the crack and become constant at ∼ 36 mm. (h) Change of U concentration of hornblende and apatite. Both minerals show exponentially decreasing profiles and the concentrations become constant at ∼ 20 mm from the crack.
Hornblende in the wall-rock
Hornblende is ∼500 μm in diameter and is present as a matrix phase. Some matrix grains define the gneissic structure along with biotite (Fig. 3c). It often overgrows garnet and orthopyroxene or is included in them (Fig. 3a–c). The Cl content decreases with distance from the crack and becomes constant at ∼0·4 wt % Cl at ∼16 mm distance (Figs 4d, 6b) (Higashino et al., 2015). The FeO (16–18 wt %) and K2O (∼1·7 wt %) contents are slightly higher in the selvage (Fig. 6b, d), whereas the XMg value (∼0·50) is almost constant (Fig. 6b;Table 1). The F content is low or below detection limit of EPMA (Fig. 6c). Zinc, Rb, Sr, Ba, Pb and U contents gradually decrease from the selvage, following exponentially decreasing profiles, and become constant at different distances from the crack: ∼12 mm for Rb, Sr, Nb and Ba, ∼20 mm for Zn and U, and ∼36 mm for Pb (Fig. 7; Table 2; Supplementary Data Electronic Appendix Fig. 2). In contrast, Ce, Sm and Gd contents represent exponentially increasing profiles, and become constant at ∼15 mm distance. Scandium shows a concave down parabolic profile, and Nb and REE (except for La) show relatively large variations (Fig. 7; Table 2; Supplementary Data Electronic Appendix Fig. 2).
Hornblende that constitutes the gneissic structure together with biotite would have been already present before the formation of the selvage (Fig. 3c). In contrast, coarse-grained hornblende in the selvage is considered as newly-grown grains (Fig. 3a). The trace element concentrations of both types of hornblende constitute exponentially decreasing and increasing profiles (Fig. 7; Supplementary Data Electronic Appendix Fig. 2), indicating that they are compositionally affected by the selvage-forming event.
Biotite
Biotite in the Grt–Hbl selvage
Biotite is present as a matrix phase and as inclusions in garnet and hornblende. Most biotite defines a gneissic structure continuous from the wall-rock. Biotite in the center of the selvage has a high Cl concentration (∼1·1 wt %), which gradually decreases from the crack towards the margin of the selvage, defining an exponentially decreasing profile. The XMg is not correlated with Cl content. It is ∼0·61 in the center of the selvage, decreases to ∼0·51 at 2·5 mm distance and again increases outwards (XMg = ∼0·60) (Figs 6a, 8a), suggesting that the decreasing Cl concentration is not controlled by Mg–Cl avoidance. Consistently, the FeO content does not define a clear trend (Fig. 6d). The F content becomes slightly higher towards the margin of the selvage, whereas Ti and K contents are almost constant (Figs 6c, 8c, d;Table 1). Li, Zn, Rb, Ba, Gd and Pb decrease away from the crack, whereas Nb increases (Fig. 7; Supplementary Data Electronic Appendix Fig. 2).
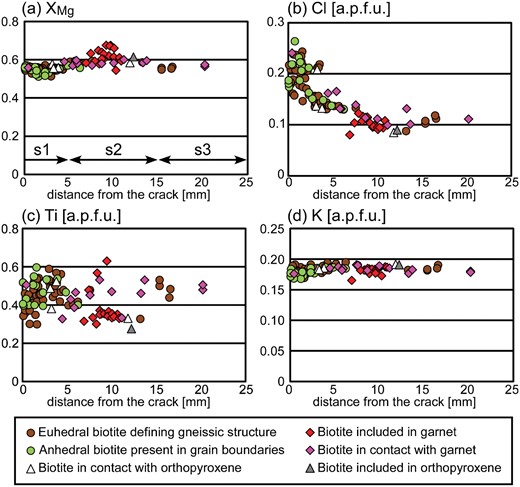
Compositional variation of biotite and its mode of occurrence as a function of distance from the crack (O = 22, sample TK2009121002C). (a) Variation in XMg. Mg–Cl avoidance is only slightly observed for matrix biotite grains. Biotite included in garnet has high XMg values probably because of retrograde Fe–Mg exchange with the host garnet. (b) Variation in Cl. Chlorine concentration exponentially decreases with distance from the crack, irrespective of the mode of occurrence, although some biotite inclusions in garnet do not follow this trend. (c) Variation in Ti. There is no correlation between mode of occurrence and Ti concentrations. (d) Variation in K. The K concentration is broadly constant.
Biotite in the wall-rock
Biotite is present as a matrix phase and as inclusions in garnet, orthopyroxene and plagioclase rims. The matrix biotite often rims garnet and orthopyroxene together with hornblende (Fig. 3b, c). Most of it defines the gneissic structure, while some does not (Fig. 3a–c). Chlorine in biotite shows an exponentially decreasing profile with distance from the crack, and becomes constant at ∼0·37 wt % Cl (XMg = ∼0·55) at ∼16 mm distance (Figs 6a, 8b).
Inclusion biotite grains in garnet and orthopyroxene that define the gneissic structure have Cl contents lower than, or similar to, the nearby matrix biotite. For example, at ∼10 mm from the crack, biotite included in orthopyroxene has ∼0·34–0·37 wt % Cl (XMg = ∼0·60–0·62), whereas matrix biotite has ∼0·43–0·46 wt % Cl (XMg = 0·54–0·56) (Fig. 8a, b). Inclusion biotites in garnet mantles and rims that do not constitute the gneissic structure show similar Cl contents to the matrix biotite at the same distance (Fig. 8b). Lithium, Zn, Rb, Sr, Ba, Gd and Pb decrease away from the crack, whereas Nb increases (Fig. 7; Supplementary Data Electronic Appendix Fig. 2). These element concentrations become constant at different distances from the crack: ∼8 mm for Sr, ∼10 mm for Li, Ba and Gd, ∼15 mm for Rb and Nb, ∼25 mm for Zn, and ∼36 mm for Pb (Fig. 7; Table 2; Supplementary Data Electronic Appendix Fig. 2). The F content becomes constant at a shorter distance than Cl (Fig. 6a, c).
Change of biotite composition from the selvage to the wall-rock
The Cl and other elemental concentrations of the matrix biotite define exponentially decreasing profiles from the center of the selvage as described above (Figs 6a, 7, 8b; Supplementary Data Electronic Appendix Fig. 2). However, biotite inclusions in garnet and orthopyroxene do not always follow this trend (Fig. 8b). This suggests that these inclusions preserve original Cl contents and are not affected by the selvage-forming event due to protection by the host minerals. This observation also indicates that biotite in this sample would have been originally Cl-bearing (< 0·4 wt % Cl). Therefore, biotite with Cl > 0·4 wt % should be considered as having been affected by the selvage-forming event. On the other hand, biotite inclusions in garnet which do not constitute the gneissic structure show similar Cl concentration to matrix biotite. Some of these inclusions are connected to the matrix via cracks, suggesting that they are ‘pseudo-inclusions’ (Kawakami et al., 2006), and that they were not protected from the selvage-forming event.
Plagioclase
Plagioclase in the Grt–Hbl selvage
In the center of the selvage, plagioclase is present as a matrix phase or as inclusions in garnet. It has a diameter of ∼300–500 μm, and is homogeneous in composition (An48) (Fig. 4f). At the edge of the selvage, plagioclase in the matrix shows chemical zoning from the core (An50–60), through the mantle (An55–70), to the rim (An48–55) (Fig. 9a). The core/mantle boundary is gradational, whereas the mantle/rim boundary is sharp (Figs 4f, 9a). For trace element compositions, plagioclase in the center of the selvage (An48) has ∼990 μg/g Sr, ∼110 μg/g Ba, and ∼40 μg/g Pb (Fig. 7; Table 2; Supplementary Data Electronic Appendix Fig. 2), whereas plagioclase at the edge of the selvage contains ∼500–650 μg/g Sr, ∼40–60 μg/g Ba, and ∼20–30 μg/g Pb and is homogeneous in terms of these elements, irrespective of chemical zoning in An content (Fig. 9a;Table 2).
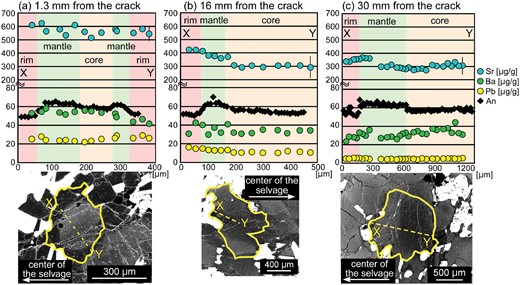
Compositional profiles of plagioclase grains at the selected distances from the crack (sample TK2009121002C). Relationships between An content and trace element concentrations within a single grain are shown. The profiles are determined along the yellow broken lines (X–Y) in the BSE images. Yellow solid lines in the BSE images represent the plagioclase outlines, and the direction of the selvage is indicated by the arrows. For simplicity, error bars are shown only for the rightmost analysis point on each zoning profile, although most of them are within the size of symbols. (a) Plagioclase present at ∼ 1·3 mm from the crack. (b) Plagioclase present at ∼ 16 mm from the crack. Rimward increase of Sr to the opposite side of the selvage is observed. (c) Plagioclase present at ∼ 30 mm away from the crack. Note that variation of trace element concentration within a single grain is apparently smaller than that observed between (a) and (c), that is, the compositional variation observed as a function of distance from the crack.
Plagioclase in the wall-rock
Plagioclase with a diameter of ∼300–1000 μm is present as a matrix phase and as inclusions in garnet and orthopyroxene. It shows a similar chemical zoning pattern to plagioclase at the edge of the selvage (Figs 3d, 4f, 9b, c). The oscillatory zoned cores and mantles in terms of An components possibly preserve chemical zoning formed before the selvage formation, because this microtexture is commonly observed throughout the wall-rock, even at some distance from the crack (Figs 4f, 9). In the wall-rock plagioclase, Na-richer rims (up to ∼150 μm thick) are developed and thickness of the rims become thinner with distance from the crack (Fig. 4f), although their An contents remains constant (Fig. 9). This shows that the rims alone have recrystallized during the selvage-forming event (Fig. 3d). Trace element zoning within a grain, if any, is not correlated with zoning in An content (Fig. 9b, c). It is almost negligible compared to the compositional variation observed as a function of distance from the crack (Figs 7, 9; Table 2): Li, Sr, Ba and Pb concentrations define exponentially decreasing profiles with distance from the crack (Fig. 7; Supplementary Data Electronic Appendix Fig. 2) and the distances at which the concentrations become constant are ∼10 mm for Li, Sr and Ba, and ∼36 mm for Pb (Fig. 7; Supplementary Data Electronic Appendix Fig. 2).
Orthopyroxene
Orthopyroxene is present exclusively in the wall-rock as isolated matrix grains and as inclusions in garnet (Figs 3a–c, 4a). It is commonly ∼200–500 μm in diameter and includes plagioclase and biotite (Fig. 3b). In the vicinity of the selvage, it is often surrounded by hornblende and biotite, implying hydration breakdown reactions of orthopyroxene to form hornblende and biotite during selvage formation (Figs 3b, 4a). Orthopyroxene without hornblende and biotite rims becomes dominant with distance from the crack (Figs 3b, c, 4a).
Each orthopyroxene grain is homogeneous in composition, and has small variations of Al2O3 =1·69–1·91 wt % and XMg = 0·53–0·54 within a distance of ∼20 mm from the crack (Table 1). Although most of the trace element concentrations in orthopyroxene are constant throughout the wall-rock, Zn gradually decreases and becomes constant at ∼30 mm from the crack (Fig. 7c;Table 2).
Apatite
Apatite in the Grt–Hbl selvage
Apatite is present as a matrix phase and as inclusions in garnet. It shows chemical zoning recognized in BSE images as dark cores, bright mantles and dark rims. The core/mantle boundary is gradational, whereas the mantle/rim boundary is sharp (Fig. 3e, f). The variation in F and Cl within a single grain is almost negligible. The Cl concentration is ∼0·70 wt % in the center of the selvage and decreases outwards (Fig. 6a). The F concentration shows large grain-by-grain variations (Fig. 6c). In contrast, for trace elements, there is a tendency that the rims contain higher Ga, Ge, Y, REE, Pb, Th and U than the cores and mantles (Fig. 7; Table 2; Supplementary Data Electronic Appendix Fig. 2). The Fe, Sr, Pb and U contents decrease from the crack towards the selvage margin (Figs 6d, 7), whereas Y, MREE and HREE (except for La and Ce) concentrations increase towards the margin (Fig. 7; Table 2; Supplementary Data Electronic Appendix Fig. 2).
Apatite in the wall-rock
Apatite is present as a matrix phase and as inclusions in garnet and plagioclase rims. These grains show the same zoning as apatite in the selvage in BSE images (Fig. 3e, f). Chlorine contents decrease with distance from the crack, defining an exponentially decreasing profile and become constant at ∼0·36 wt % at ∼16 mm distance (Fig. 6a). Exponentially decreasing profiles are also observed for Sr, Pb and U, and each elemental concentration becomes constant at a different distance from the crack: ∼15 mm for Sr, ∼36 mm for Pb and ∼20 mm for U (Fig. 7). In contrast, concentrations of Y, MREE and HREE (except for La and Ce) exponentially increase with distance from the crack (Fig. 7; Table 2; Supplementary Data Electronic Appendix Fig. 2).
Apatite has a sharp mantle/rim boundary, as in the case of plagioclase (Fig. 3e, f). Apatite in the matrix is commonly in contact with the Na-richer plagioclase rims which possibly recrystallized during the selvage-forming event. The exponentially decreasing profile of Cl in apatite rims suggests that this domain also recrystallized during the selvage formation (Fig. 6a).
P–T CONDITIONS OF GRT–HBL SELVAGE FORMATION
Pressure–temperature conditions for Grt–Hbl selvage formation were estimated using the minerals present there; Y-poor garnet, hornblende and biotite which are not in contact with garnet and do not constitute the gneissic structure, and more Na-rich plagioclase rims. The reason for choosing these combinations of mineral domains that are not in contact with each other is to avoid as much as possible the effects of retrograde Fe–Mg exchange between garnet and biotite/hornblende. The Grt–Bt geothermometer (Holdaway, 2000) and the Grt–Bt–Pl–Qtz (GBPQ) geobarometer (Wu et al., 2004) yielded 740 ± 30°C and 0·67 ± 0·18 GPa; a higher temperature (830 ± 64°C, 0·74 ± 0·18 GPa) can be obtained by considering the effect of F and Cl in biotite (Zhu & Sverjensky, 1992; Wu et al., 2004). On the other hand, the Grt–Hbl Fe–Mg geothermometer (Ravna, 2000) and the Grt–Hbl–Pl–Qtz (GHPQ) geobarometer (Kohn & Spear, 1990) yielded 800 ± 79°C and 0·76 ± 0·15 GPa. Therefore, the Grt–Hbl selvage probably formed at 740–830°C and 0·67–0·76 GPa in the middle to lower crust.
In contrast, equilibrium P–T conditions recorded in the wall-rock can be estimated using mineral compositions distant from the selvage. Minerals beyond the point where major and trace elements become constant are suitable for this estimate (Figs 6, 7). Therefore, the composition of minerals that are not in contact with each other at ∼150 mm distance from the crack are used for P–T estimates; Y-rich garnet cores, orthopyroxene, hornblende and biotite which constitute the gneissic structure, and plagioclase core/mantle. Estimated P–T conditions using the same geothermobarometers as above are ∼760–850 ºC and 0·76–0·94 GPa. Additionally, Grt–Opx geothermobarometry (Harley, 1984a, 1984b) gave slightly lower T and higher P conditions of ∼730 ± 35 ºC and 1·1 ± 0·2 GPa, respectively, but they are within error of each other.
From the microtextural constraints, the Grt–Hbl selvage is considered to have formed through retrograde hydration reactions. However, alternatively, because the temperature conditions estimated from the selvage and the wall-rock are similar, and because Fe is added by brine advection (Figs 10, 11), a change of bulk composition towards the Fe-richer side in the selvage is another possible scenario to explain stabilization of garnet and hornblende.
![(a) Change of modal amount of minerals [vol. %] in each sub-slice with distance from the crack, calculated from X-ray elemental mapping. Modal amount of garnet, hornblende, quartz and apatite is high and that of orthopyroxene, plagioclase and biotite is low in slice 1 (corresponding to the Grt–Hbl selvage). (b) Changes of bulk-rock composition [wt %] of sub-slices with distance from the crack, calculated by using the modal amount of minerals shown in (a), the density of each mineral and the mineral compositions in each slice. The concentration of SiO2 and FeO is notably different in slice 1 (the Grt–Hbl selvage) and becomes constant in slices 2–4 (wall-rock).](https://oup.silverchair-cdn.com/oup/backfile/Content_public/Journal/petrology/60/2/10.1093_petrology_egy116/1/m_egy116f10.jpeg?Expires=1716912499&Signature=ykMyJ5iyLHtzlXEYab8pCOCCLJ~ZTdzJdAujXXHBnH4oz6pZG8KU9n2OEs73uDY0fXKciFzCbEP5qa4uZg3sFfpRNHHAdZ~4qy-5bjbJWtloMWi8qD5B9yexWWkq9UEcYL09pMfi28qNYKYzp3GGkLAa1b62zXL8NJMQu9dILDXigFC24HXUlljR1NZ7QiAuQXlSLxlx6PLWVqU5GCPOcZA7-A5Ofyy2GUjEt6rdYO9mJQGJxPING2-Bstytb-3Xy-r4F~l8ZmtdMhyNtIfwkmXH0yofV90hIAvLmSV1VKUCuNmNJ9bEv3KLTFMlFag3Oc7S5R2X3q7sAmBaxz9Ttg__&Key-Pair-Id=APKAIE5G5CRDK6RD3PGA)
(a) Change of modal amount of minerals [vol. %] in each sub-slice with distance from the crack, calculated from X-ray elemental mapping. Modal amount of garnet, hornblende, quartz and apatite is high and that of orthopyroxene, plagioclase and biotite is low in slice 1 (corresponding to the Grt–Hbl selvage). (b) Changes of bulk-rock composition [wt %] of sub-slices with distance from the crack, calculated by using the modal amount of minerals shown in (a), the density of each mineral and the mineral compositions in each slice. The concentration of SiO2 and FeO is notably different in slice 1 (the Grt–Hbl selvage) and becomes constant in slices 2–4 (wall-rock).
![The fractionation mass change values (τ) for slices 1–4 based on the equation of Ague (2003), taking volume change into account. Bulk-rock compositions of rock slices prepared as distance from the crack (slices 1–10) are used in this calculation. The average Zr concentration in slices 5–10 is used as an immobile reference species (Fig. 2g). The thickness of each pattern reflects errors, including variation of Zr concentration in slices 5–10 (2σ) and the maximum amount of Zr removal in slice 1 [assumed to be 10% following Higashino et al. (2015)]. (a) Mass change values for major elements determined by XRF analysis. Iron and Mn are added to the selvage. (b) The τ value for trace elements and REE. Lithium, Cu, Rb, Ba, Pb and U, elements that tend to be incorporated in fluids rather than melts are added to the selvage (slice 1) and to the neighboring wall-rock (slices 2–4).](https://oup.silverchair-cdn.com/oup/backfile/Content_public/Journal/petrology/60/2/10.1093_petrology_egy116/1/m_egy116f11.jpeg?Expires=1716912499&Signature=qNCPz0foaMFNKYnSWetpUOLe7BmsC3qoYGUZS7xKEotMHwIuEfApv1P~uim25IAIB9n1y0f4RVNzQkYBZxPgiw6B8UsdzliaSNnh-MLU~kATTjoS8if4iwmsQfnFzsX9wWorPQMl3ixXkEIoE2nyopnONi6ellDKB2hrf-oCfimgYLreDSfQOxWKBsxGmpC3vchSw2JyuhNDsVyvD-3VhtlgGuonWoEMWIuF8~q6bLGwYpFnT1caHviYjrZlAUVEhq~6iHes4Pv9L-pMp5i6br16SDPxBbc-c2g6TymPAUEcQNbIIkctMZDMm7sSdKjZlNafIo~zbKPsNG81F0rEPQ__&Key-Pair-Id=APKAIE5G5CRDK6RD3PGA)
The fractionation mass change values (τ) for slices 1–4 based on the equation of Ague (2003), taking volume change into account. Bulk-rock compositions of rock slices prepared as distance from the crack (slices 1–10) are used in this calculation. The average Zr concentration in slices 5–10 is used as an immobile reference species (Fig. 2g). The thickness of each pattern reflects errors, including variation of Zr concentration in slices 5–10 (2σ) and the maximum amount of Zr removal in slice 1 [assumed to be 10% following Higashino et al. (2015)]. (a) Mass change values for major elements determined by XRF analysis. Iron and Mn are added to the selvage. (b) The τ value for trace elements and REE. Lithium, Cu, Rb, Ba, Pb and U, elements that tend to be incorporated in fluids rather than melts are added to the selvage (slice 1) and to the neighboring wall-rock (slices 2–4).
BULK-ROCK COMPOSITIONAL VARIATION WITH DISTANCE FROM THE CRACK
Bulk-rock compositions of the rock slices prepared as a function of distance from the crack (slices 1–10; Fig. 2g) are summarized in Table 3. Major and trace element concentrations, except for P, Cr, Cu and Pb, are almost constant in the wall-rock (slices 5–10). Comparison between the composition of the selvage (slice 1) and the wall rock (slices 5–10) reveals that most of the major element concentrations in the selvage, except for MgO, fall outside the mean ± 2 S.D. range of the wall-rock (slices 5–10; Table 3). Similarly, the Li, P, Sc, Ga, Ge, Sr, Y, Ba, REE, Th and U concentrations of the selvage fall outside the mean ± 2 S.D. range of slices 5–10 (Table 3). These observations suggest that most of the element concentrations of the selvage are meaningfully higher or lower compared to the wall-rock.
Bulk rock compositions of slices 1 to 10 determined by XRF and ICPMS analyses.
| Sample | Slice 1 Grt-Hbl selvage | Slice 2 | Slice 3 | Slice 4 | Slice 5 | Slice 6 | Slice 7 | Slice 8 | Slice 9 | Slice 10 | Average of slices 5-10 | 2S.D. of slices 5-10 |
|---|---|---|---|---|---|---|---|---|---|---|---|---|
| Major elements [wt%] | ||||||||||||
| SiO2 | 43·7 | 46·4 | 45·8 | 45·9 | 45·7 | 46·3 | 46·2 | 46·5 | 47·0 | 46·7 | 46·4 | 0·9 |
| TiO2 | 0·8 | 1·1 | 1·1 | 1·0 | 1·0 | 0·9 | 1·0 | 1·0 | 0·9 | 0·9 | 1·0 | 0·1 |
| Al2O3 | 17·2 | 19·3 | 18·9 | 19·0 | 19·1 | 19·0 | 18·8 | 19·0 | 19·1 | 19·2 | 19·0 | 0·3 |
| Fe2O3 (total) | 19·5 | 13·5 | 14·2 | 14·0 | 14·3 | 14·1 | 14·3 | 13·7 | 13·5 | 13·7 | 13·9 | 0·7 |
| MnO | 0·5 | 0·2 | 0·2 | 0·1 | 0·2 | 0·2 | 0·2 | 0·1 | 0·2 | 0·2 | 0·2 | 0·0 |
| MgO | 6·0 | 5·7 | 6·1 | 6·2 | 6·1 | 5·9 | 6·0 | 5·9 | 5·8 | 5·7 | 5·9 | 0·3 |
| CaO | 6·8 | 7·3 | 7·1 | 7·2 | 7·3 | 7·4 | 7·3 | 7·4 | 7·4 | 7·2 | 7·3 | 0·1 |
| Na2O | 2·1 | 2·5 | 2·7 | 2·3 | 2·3 | 2·4 | 2·5 | 2·5 | 2·6 | 2·9 | 2·5 | 0·4 |
| K2O | 1·3 | 2·0 | 2·1 | 2·1 | 2·0 | 1·8 | 1·9 | 1·9 | 1·8 | 1·8 | 1·9 | 0·2 |
| LOI | 0·1 | 0·1 | 0·0 | 0·0 | 0·0 | 0·0 | 0·0 | 0·0 | 0·0 | 0·0 | 0·0 | 0·0 |
| total | 98·0 | 97·9 | 98·0 | 97·8 | 98·0 | 98·0 | 98·1 | 98·0 | 98·1 | 98·4 | 98·1 | – |
| Trace elements [μg/g] | ||||||||||||
| Li | 14·1 | 8·9 | 6·3 | 6·3 | 4·0 | 7·5 | 6·8 | 6·2 | 4·6 | 5·3 | 5·8 | 2·6 |
| P | 280·4 | 727·2 | 626·2 | 674·5 | 676·2 | 685·5 | 843·4 | 995·3 | 398·9 | 681·9 | 713·5 | 398·4 |
| Sc | 48·6 | 39·4 | 44·4 | 41·5 | 43·0 | 38·8 | 42·1 | 40·9 | 34·6 | 39·4 | 39·8 | 6·0 |
| V | 266·8 | 260·6 | 222·1 | 268·3 | 254·6 | 221·8 | 228·9 | 267·2 | 222·8 | 233·6 | 238·1 | 37·1 |
| Cr | 8·7 | 18·8 | 22·7 | 24·0 | 14·8 | 85·6 | 115·5 | 26·7 | 15·8 | 58·5 | 52·8 | 82·6 |
| Cu | 40·0 | 172·5 | 627·0 | 71·3 | 100·8 | 188·4 | 158·7 | 366·0 | 78·1 | 105·8 | 166·3 | 212·0 |
| Zn | 103·8 | 134·6 | 137·3 | 127·1 | 109·4 | 143·1 | 105·4 | 108·7 | 107·3 | 98·9 | 112·1 | 31·2 |
| Ga | 16·2 | 18·7 | 18·9 | 18·9 | 17·7 | 17·6 | 18·7 | 18·9 | 18·7 | 18·0 | 18·3 | 1·2 |
| Ge | 28·6 | 18·9 | 21·2 | 19·8 | 19·3 | 18·7 | 19·9 | 19·8 | 18·0 | 17·8 | 18·9 | 1·8 |
| Rb | 40·3 | 69·7 | 58·9 | 56·9 | 52·8 | 44·4 | 48·6 | 50·3 | 43·3 | 42·2 | 46·9 | 8·5 |
| Sr | 275·8 | 296·2 | 223·9 | 229·2 | 218·9 | 226·3 | 238·4 | 254·2 | 236·1 | 238·1 | 235·3 | 24·1 |
| Y | 21·7 | 16·2 | 17·1 | 15·7 | 16·3 | 15·9 | 17·7 | 16·5 | 15·6 | 14·9 | 16·2 | 1·9 |
| Zr | 45·6 | 53·2 | 55·1 | 57·6 | 58·5 | 47·2 | 36·8 | 56·8 | 52·0 | 53·1 | 50·7 | 15·8 |
| Nb | 944·3 | 1785·2 | 1538·2 | 1167·4 | 1889·0 | 1737·9 | 1611·4 | 1502·7 | 914·7 | 1708·2 | 1560·7 | 683·6 |
| Ba | 1083·6 | 808·1 | 671·4 | 676·6 | 626·2 | 566·5 | 608·0 | 647·2 | 599·7 | 604·0 | 608·6 | 54·2 |
| La | 14·1 | 10·5 | 9·6 | 9·9 | 9·5 | 9·7 | 10·8 | 11·1 | 10·5 | 10·3 | 10·3 | 1·2 |
| Ce | 27·9 | 20·3 | 20·7 | 21·5 | 20·8 | 20·9 | 23·1 | 23·7 | 22·0 | 21·6 | 22·0 | 2·3 |
| Pr | 3·4 | 2·5 | 2·6 | 2·7 | 2·7 | 2·6 | 2·8 | 2·9 | 2·7 | 2·6 | 2·7 | 0·3 |
| Nd | 14·8 | 11·3 | 11·5 | 11·9 | 11·5 | 11·7 | 12·0 | 12·4 | 11·1 | 11·1 | 11·6 | 1·1 |
| Sm | 3·9 | 3·3 | 3·3 | 3·3 | 3·0 | 3·0 | 3·3 | 3·3 | 3·0 | 2·9 | 3·1 | 0·3 |
| Eu | 1·2 | 1·0 | 1·1 | 1·1 | 1·0 | 1·0 | 1·1 | 1·1 | 1·0 | 1·0 | 1·0 | 0·1 |
| Gd | 3·9 | 3·6 | 3·6 | 3·3 | 3·1 | 3·1 | 3·4 | 3·2 | 3·0 | 2·8 | 3·1 | 0·4 |
| Tb | 0·8 | 0·7 | 0·7 | 0·7 | 0·7 | 0·7 | 0·7 | 0·7 | 0·6 | 0·6 | 0·7 | 0·1 |
| Dy | 4·3 | 3·6 | 3·6 | 3·3 | 3·3 | 3·2 | 3·4 | 3·2 | 3·3 | 3·0 | 3·3 | 0·3 |
| Ho | 1·0 | 0·9 | 0·9 | 0·8 | 0·8 | 0·8 | 0·9 | 0·8 | 0·8 | 0·8 | 0·8 | 0·1 |
| Er | 2·6 | 2·0 | 2·2 | 2·0 | 2·0 | 1·9 | 2·2 | 1·9 | 1·8 | 1·9 | 1·9 | 0·3 |
| Tm | 0·5 | 0·4 | 0·4 | 0·4 | 0·4 | 0·4 | 0·4 | 0·4 | 0·4 | 0·3 | 0·4 | 0·0 |
| Yb | 2·5 | 1·9 | 2·1 | 1·7 | 1·9 | 1·8 | 2·0 | 1·8 | 1·7 | 1·7 | 1·8 | 0·2 |
| Lu | 0·6 | 0·5 | 0·5 | 0·5 | 0·4 | 0·5 | 0·5 | 0·4 | 0·4 | 0·5 | 0·5 | 0·0 |
| Pb | 12·0 | 19·3 | 55·0 | 7·0 | 5·8 | 4·3 | 4·0 | 21·8 | 7·0 | 5·3 | 8·1 | 13·6 |
| Bi | 1·2 | 1·3 | 1·5 | 1·2 | 1·1 | 1·1 | 1·2 | 1·2 | 1·2 | 1·1 | 1·2 | 0·1 |
| Th | 3·2 | 3·1 | 3·1 | 3·0 | 3·0 | 3·0 | 3·0 | 3·0 | 3·0 | 3·0 | 3·0 | 0·0 |
| U | 0·7 | 0·5 | 0·2 | 0·1 | 0·0 | 0·0 | 0·1 | 0·1 | 0·1 | 0·1 | 0·1 | 0·0 |
Since slices 2–4 are considered to be affected by the selvage formation, the average and standard deviation of slices 5–10 are shown·
In order to detect changes in bulk-rock composition with distance from the center of the selvage in more detail, 2·5 mm-thick slices parallel to the selvage were made and their bulk-rock compositions were determined (Fig. 10b). That is, slices 1–4 were subdivided further into 2·5 mm-thick sub-slices and the modal amounts of garnet, orthopyroxene, hornblende, biotite, plagioclase (separated into mantle + core parts and rim parts), quartz and apatite were determined in each sub-slice, using X-ray elemental mapping by EPMA. Bulk-rock compositions of the sub-slices were calculated by combining modal information and mineral compositions. Accessory minerals such as zircon, pyrite, and ilmenite were neglected. As a result, the wall-rock compositions (sub-slices 5–16) are shown to be almost constant. On the other hand, the selvage (sub-slices 1–4) showed distinctly different compositions from the wall-rock sub-slices (Fig. 10b). This compositional difference corresponds well to the results obtained from the XRF analyses of slices 1–4. The ‘sub-slice’ bulk compositions show clear differences between the selvage and the wall-rock, especially in Fe2O3 (FeO) and SiO2 (Fig. 10b;Table 3). The Fe2O3 (FeO) and SiO2 in the selvage is higher and lower than the wall-rock, respectively (Fig. 10b).
DISCUSSION
Grt–Hbl selvage formation through brine advection in a crack
Evidence for the Grt–Hbl selvage formation through an open system process
The randomly oriented network texture of the Grt–Hbl selvages and cracks in them (Fig. 2b) shows a similar pattern to the veins formed by fluid- or melt-induced fracture propagation (e.g. Gieré & Williams, 1992; Gudmundsson et al., 2001; Engvik et al., 2005; Carson & Ague, 2008) and are unlikely to be extensional cracks that tend to be oriented. Absence of leucosome along the Grt–Hbl selvage suggests that it was formed by fluid advection rather than melt-related processes (cf. Daczko et al., 2001; Angiboust et al., 2017).
Bulk-rock compositional variation with distance from the center of the selvage reflects whether the Grt–Hbl selvage was formed by pressure- or kinetically-dependent closed-system segregation or by open-system processes with the addition and loss of elements (e.g. Oliver & Bons, 2001). In the case of vein formation in a closed system, mass movement to form the vein is limited to the wall-rock in the vicinity of the vein (Oliver & Bons, 2001). Therefore, assuming that the wall-rock distant from the vein preserves an original composition, the amount of mass addition and loss in the vein/selvage should be balanced with the mass loss and addition in the wall-rock, respectively. In contrast, in the case of open-system vein formation, the chemical composition in the vein/selvage shows mass addition and loss that are not correlated with the mass loss and addition in the wall-rock, respectively (Oliver & Bons, 2001).
In this study, the bulk-rock compositions of the selvage and the sub-slices of the wall rock are unbalanced (Fig. 10b); the bulk-rock compositions of the Grt–Hbl selvage plot outside the range of chemical variation (mean ± 2 S.D.) of other wall-rock slices (Table 3). Using the criteria of Oliver & Bons (2001), we consider that the Grt–Hbl selvage and its surroundings were formed through a fluid-related, open-system process. This contrasts with an anorthositic leucosome vein, which is interpreted to have formed through closed-system partial melting (Daczko et al., 2001).
Brine advection through the crack revealed by the elements added to the Grt–Hbl selvage and the wall rock
The fHCl/fH2O ratio of the brine estimated using biotite and apatite compositions (e.g. Munoz, 1992; Piccoli & Candela, 1994) decreases with distance from the crack (Table 1), suggesting that the brine changed its composition as it reacted with the wall-rock. The fHCl/fH2O ratio of the brine in the Grt–Hbl selvage is similar to that estimated from Cl-rich biotite in Balchenfjella, eastern SRM (Higashino et al., 2013) and higher than that in Harlov & Förster (2002) who reported brine metasomatism. On the other hand, the fHF/fH2O ratio is small and does not show any trend with distance from the crack (Table 1), implying the relative insignificance of F in the brine.
Mechanism of mineral microtexture formation through wet grain–boundary diffusion from the crack
In order to understand the formation mechanisms of multi-scale chemical zoning in the wall-rock during brine advection through the crack, it is important to successfully explain the following two zoning profiles simultaneously: (i) chemical zoning profiles recorded within each mineral, and (ii) exponentially decreasing/increasing elemental profiles recorded in the wall-rock minerals.
Chemical zoning in plagioclase
Plagioclase rims, several tens of μm in width, which are observed both microscopically (Fig. 3d) and chemically as discontinuous zoning in An content (Fig. 9), are unlikely to have been formed by diffusion, because the NaSi–CaAl interdiffusion coefficient is on the order of 10-30–10-28 m2/s at 740–830°C under dry conditions (Grove et al., 1984) and this is too sluggish to form plagioclase rims of several tens of μm in width. Even under fluid-present conditions (XH2O = 0·5; N2–H2O fluid), this is of the order of 10-25 m2/s at 740°C and 10-23 m2/s at 830°C, and takes 102–103 Myr to diffuse a distance of ∼100 μm (Baschek & Johannes, 1995). On the other hand, a thin fluid film at the interface between parent and product phases could initiate dissolution-reprecipitation (e.g. O’Neil & Taylor, 1967; Milke et al., 2013; Ruiz-Agudo et al., 2014). The phase boundary is seemingly sharp with/without porosity under micrometre-scale observations (Harlov et al., 2011; Harlov, 2015). Therefore, the plagioclase rims recognized by sharp mantle/rim boundaries in this study (Figs 3d, 9) were presumably formed by the dissolution–reprecipitation process under wet grain–boundary conditions (e.g. Putnis & Austrheim, 2010).
Relationships between the exponentially decreasing/increasing profiles and diffusion coefficients
The wall-rock part of the studied sample can be regarded as comprising multi-phase polycrystals. Each mineral composition shows exponentially decreasing/increasing profiles with distance from the crack (Fig. 7; Supplementary Data Electronic Appendix Fig. 2). As mentioned above, plagioclase rims formed by a dissolution-reprecipitation process means that the grain boundaries were once wet and worked as a reaction front. In a case of advection towards the wall-rock through grain boundaries, all element concentrations should become constant at the same distance from the crack (cf. Skelton et al., 2000; Ague, 2002). In this sample, however, the distance at which trace element concentrations become constant depends on the particular elements (Fig. 7). This would provide evidence for diffusion being a predominant process to form the trace element profiles shown in Fig. 7. Therefore, overall observation suggests that the chemical environment of the recrystallized selvage was defined by advection of brine, and the interaction of the brine with the wall-rocks was dominated by diffusion.
Notation list for a diffusion equation.
| Symbol | Definition | Unit | Values |
|---|---|---|---|
| C | concentration in the mineral at any location and time | μg/g | |
| Cs | concentration in the mineral in the center of the selvage | μg/g | |
| Cw | steady-state value concentration in the mineral in the wall rock | μg/g | |
| C* | dimentionless concentration | None | 0 ≤ C* ≤ 1 |
| D | diffusion coefficient | m2/s | |
| L | maximum distance to observe exponential decay profiles | m | |
| t | time | s | |
| t0 | maximum time to form exponential decay profiles | s | |
| t* | dimentionless time | None | |
| t'd | diffusion time from the crack towards the wall rock | s | |
| x | distance | m | |
| X | dimentionless distance | None | 0 ≤ X ≤ 1 |
Solutions to the diffusion equation depend on boundary conditions. In this study, two kinds of boundary conditions are considered: (1) fixed supply of diffusing species, and (2) continuous supply of diffusing species. In case (1), the solution to Fick’s second law is shown as a Gaussian, whereas in case (2), the solution is shown as an error function (Fig. 12a, b).
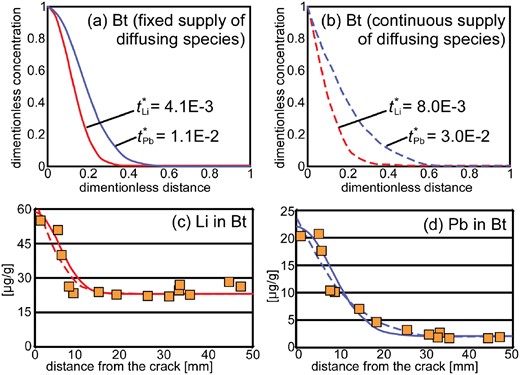
Solutions of diffusion equations fitted to the exponentially decreasing profiles (sample TK2009121002C). A summary of the solutions is given in Table 5. (a) Solution of non-dimensional diffusion equation for Li and Pb in biotite under the boundary condition of fixed supply of diffusing species. The result shows that the diffusion coefficients for Li and Pb differ by one order of magnitude. (b) Solution of non-dimensional diffusion equation for Li and Pb in biotite under the boundary condition of continuous supply of diffusing species. The difference of diffusion coefficients between Li and Pb is one order of magnitude. (c, d) Comparison of fitting curves for the exponentially decreasing profile of Li (c) and Pb (d) in biotite. Both fittings give similar correlation coefficients (Table 5). Solid curves represent fitting under the boundary condition of fixed supply of diffusing species, and broken curves represent fitting under the boundary condition of continuous supply of diffusing species.
If brine advection occurred through a planar crack in the center of the selvage for a short period, the exponentially decreasing/increasing profiles (Fig. 7; Supplementary Data Electronic Appendix Fig. 2) may be rearranged so that best-fit diffusion profiles are obtained from the non-dimensional diffusion equation with the boundary condition of fixed supply (Fig. 12a;Table 5). For comparison, diffusion profiles with the boundary condition of continuous supply of diffusing species are also calculated (Fig. 12b;Table 5). The high values of the correlation coefficient R2 (Table 5) indicate that the exponentially decreasing/increasing profiles were formed by a diffusion process. Consistently, the R2 values of elements not showing the exponentially decreasing/increasing profiles are low (Fig. 7e;Table 5). Flat compositional profiles with distance from the crack would mean that diffusion of the elements did not occur because there was no chemical potential gradient between the brine in the planar crack and the wall-rock or simply because the concentrations in the brine were low (Fig. 7e). Theoretically, it is possible to reveal from R2 values which boundary conditions are appropriate (Table 5). However, the similar R2 values in both boundary conditions for each element–mineral pair make it difficult exactly to determine the appropriate boundary conditions in this study (Table 5). The high R2 values mean that an advection term would be very small, even if the trace element profiles in Fig. 7 were fitted by the advection–diffusion equation. Based on these arguments, therefore, grain–boundary diffusion is a possible process to form the exponentially decreasing/increasing profiles.
Summary of solutions of the non-dimensional diffusion equation for two boundary conditions
| Element | Mineral | fixed supply of diffusing species | continuous supply of diffusing species | ||
|---|---|---|---|---|---|
| t* | correlation coefficient (R2) | t* | correlation coefficient (R2) | ||
| Li | Biotite | 4·1E-03 | 0·8372 | 8·0E-03 | 0·8297 |
| Plagioclase | 8·1E-03 | 0·7051 | 2·0E-02 | 0·6770 | |
| Cl | Hornblende | 2·2E-03 | 0·8779 | 6·7E-03 | 0·9501 |
| Biotite | 2·4E-03 | 0·9251 | 7·2E-03 | 0·9151 | |
| Apatite | 2·2E-03 | 0·4050 | 6·5E-03 | 0·5703 | |
| Sc | Garnet | 5·2E-03 | 0·7300 | 1·1E-02 | 0·7743 |
| Hornblende | 4·9E-03 | 0·6382 | 9·5E-03 | 0·6014 | |
| Zn | Garnet | 5·6E-03 | 0·5236 | 1·2E-02 | 0·5075 |
| Hornblende | 1·3E-02 | 0·8087 | 2·7E-02 | 0·7894 | |
| Biotite | 2·2E-02 | 0·6685 | 3·8E-02 | 0·6994 | |
| Orthopyroxene | 3·8E-02 | 0·9218 | 8·5E-02 | 0·9073 | |
| Rb | Hornblende | 1·9E-03 | 0·5904 | 4·8E-05 | 0·8501 |
| Biotite | 6·4E-03 | 0·8621 | 1·4E-02 | 0·8564 | |
| Sr | Hornblende | 3·6E-03 | 0·8414 | 8·1E-03 | 0·8705 |
| Biotite | 3·7E-03 | 0·5796 | 7·1E-03 | 0·5863 | |
| Plagioclase | 3·3E-03 | 0·8746 | 5·8E-03 | 0·9375 | |
| Apatite | 5·4E-03 | 0·9042 | 1·2E-02 | 0·9282 | |
| Y | Apatite | 6·6E-03 | 0·4583 | 1·1E-02 | 0·4469 |
| Zr | Garnet | 2·8E-03 | 0·5057 | 1·0E-02 | 0·4924 |
| Nb | Hornblende | 1·1E-02 | 0·8185 | 2·8E-02 | 0·8308 |
| Biotite | 8·6E-03 | 0·7032 | 2·2E-02 | 0·6660 | |
| Ba | Hornblende | 1·9E-05 | 0·5628 | 2·4E-05 | 0·9923 |
| Biotite | 2·3E-03 | 0·8961 | 3·8E-03 | 0·9047 | |
| Plagioclase | 1·2E-03 | 0·4330 | 1·6E-03 | 0·6186 | |
| La | Hornblende | 7·6E-06 | 0·1440 | 1·9E-05 | 0·3147 |
| Plagioclase | 4·1E-03 | 0·1442 | 9·0E-03 | 0·1490 | |
| Apatite | 3·9E-03 | 0·2281 | 1·5E-02 | 0·2228 | |
| Sm | Garnet | 1·7E-03 | 0·6224 | 3·6E-03 | 0·6591 |
| Hornblende | 4·6E-03 | 0·8055 | 9·7E-03 | 0·7616 | |
| Gd | Garnet | 1·1E-03 | 0·3367 | 2·6E-03 | 0·3502 |
| Hornblende | 5·4E-03 | 0·6301 | 1·1E-02 | 0·5700 | |
| Biotite | 3·6E-03 | 0·9495 | 6·9E-03 | 0·9690 | |
| Apatite | 6·2E-03 | 0·3859 | 1·1E-02 | 0·3851 | |
| Pb | Hornblende | 1·6E-02 | 0·9528 | 3·9E-02 | 0·9665 |
| Biotite | 1·1E-02 | 0·9458 | 3·0E-02 | 0·9391 | |
| Plagioclase | 2·1E-02 | 0·9692 | 4·4E-02 | 0·9700 | |
| Apatite | 1·8E-02 | 0·8627 | 4·0E-02 | 0·8685 | |
| U | Hornblende | 7·1E-03 | 0·9281 | 1·7E-02 | 0·9346 |
| Apatite | 3·2E-03 | 0·5443 | 2·0E-02 | 0·5558 | |
As shown as t* in Table 5, the difference in the non-dimensional diffusion profiles infers differences in D. About two orders of magnitude difference in t* values correspond to the difference in D between elements (Table 5). This means that a few cm difference (maximum example; 10 mm in Li versus 36 mm in Pb) in the distance at which trace element concentrations become constant in the diffusion profile were formed by two orders of magnitude difference in D.
The t* value tends to be dependent on each element, and not on mineral species (Fig. 12; Table 5). Comparing the profile of Li with Pb, for example, the estimated diffusion coefficient of grain–boundary diffusion would be independent of the electronic charge and the radius of diffusing elements (Figs 7, 12; Supplementary Data Electronic Appendix Fig. 2). Generally, grain–boundary diffusion coefficients decrease with increasing electronic charge and ionic radius of diffusing species. They also decrease when the diameter of diffusing species approaches one tenth of the width of grain boundaries (e.g. Beck & Schultz, 1970; Olejnik & White, 1972; Farver & Yund, 1995). Therefore, the observed difference in the diffusion distance of the exponentially decreasing/increasing profiles should represent the size of diffusing species. However, the observed diffusion distance in this study is not simply correlated with the radius of the cations, pointing to the movement of the cations in the form of complex diffusing species such as chloride complexes (e.g. Williams-Jones et al., 2012). In addition, although the exponentially decreasing profiles of Pb in hornblende, biotite, plagioclase and apatite are considered to be formed by diffusion (Fig. 7g), changes in the bulk-rock Pb concentration are not gradual with distance from the center of the Grt–Hbl selvage (Fig. 11b). This implies that the mass transfer would be controlled not only by chloride species. Since this sample includes sulfides, sulfide ions might be compounded with Cu and Pb and control the bulk-rock compositional changes of these elements (Fig. 11b). Therefore, this observation is very valuable to understand existing forms of cations in the brine.
Generally, the width of grain boundary is inferred to be 1–3 nm in the grain–boundary diffusion process (e.g. Joesten, 1991; Farver et al., 1994). Although a very small amount of fluid could cause wet grain–boundary diffusion, the lower limit of the necessary fluid abundance is still unknown (Dohmen & Milke, 2010). In this study, grain boundaries are considered to work as a reaction front (Figs 4f, 9), and the formation mechanism of the trace element profiles as a distance from the crack could be explained by wet grain–boundary diffusion (Figs 7, 12; Supplementary Data Electronic Appendix Fig. 2). The variation in the distances at which the element concentration becomes constant, irrespective of mineral species, is likely to be controlled by the difference in wet grain–boundary diffusion coefficients for each diffusing species. As such, grain–boundary diffusion in wet conditions is proposed to form the exponentially decreasing/increasing profiles and to cause dissolution-reprecipitation of mineral rims.
CONCLUSIONS
In this study, we discussed microtextural and mineralogical developments during a brine-induced diffusion process. The exponentially decreasing profile of Cl and the decreasing width of plagioclase rims with a sharp mantle/rim boundary with distance from the crack (Figs 4d, f, 6a) are considered to provide evidence for mass transfer through wet grain–boundary diffusion by brines. Even without nearby exponentially decreasing/increasing profiles, minerals with sharp chemical zoning patterns, coexisting with Cl-bearing minerals, could characterize grain boundaries wetted by brines. Field mapping of these microtextures has potential to unravel the large-scale distribution and fluid pathways of brines.
ACKNOWLEDGEMENTS
We would like to thank Prof. S. Angiboust, Prof. B. Yardley, Dr B. Dyck, and two anonymous reviewers for constructive reviews and Prof. R. Gieré for his editorial efforts. This research is a part of the science program of JARE. Professor H. Ishizuka and Prof. H. Kojima are thanked for providing rock samples collected during the JARE 27 survey. Professor S. Yamasaki and Dr R. Yamada are thanked for supports in XRF and solution ICPMS analyses, and members of the JARE geology group are thanked for their fruitful discussions especially through NIPR symposiums and Nishi-Higashi seminars.
FUNDING
This study was supported by Japan Society for the Promotion of Science (JSPS) KAKENHI Grant Numbers JP13J00715 and JP16J01136 to F. Higashino, JP23740391 and JP26400513 to T. Kawakami, and JP22244067 and JP21109004 to T. Hirajima.
